

Key Insights
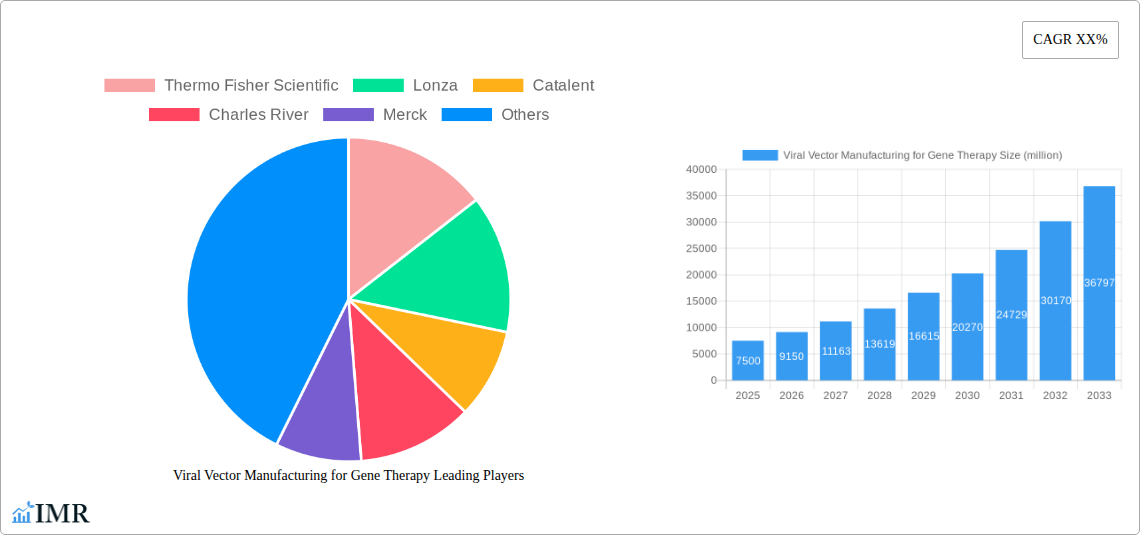
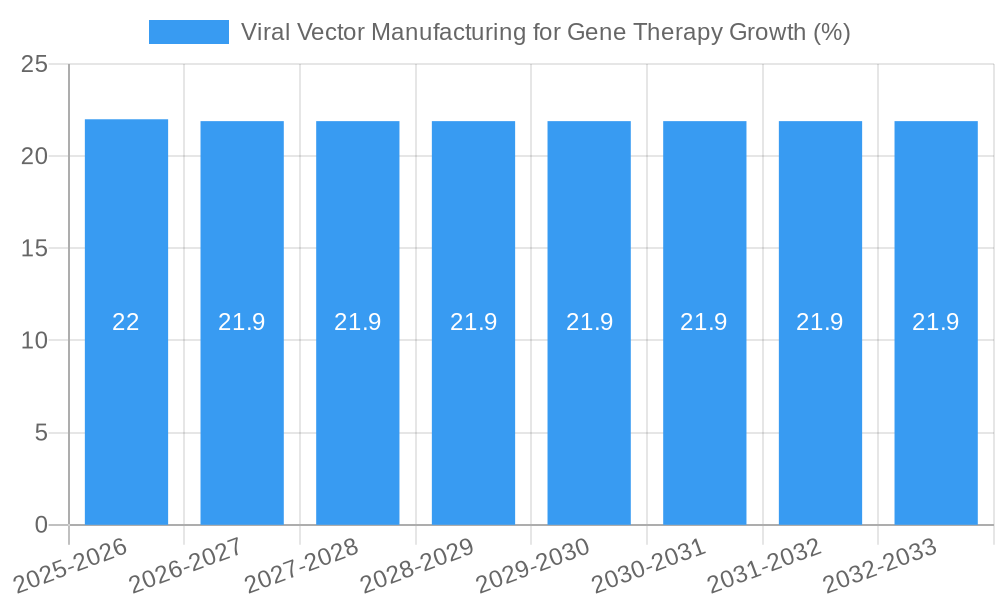
The global Viral Vector Manufacturing for Gene Therapy market is poised for substantial expansion, driven by the burgeoning demand for advanced therapeutic modalities and a robust pipeline of gene-based treatments. With an estimated market size of $7,500 million in 2025, the sector is projected to grow at a Compound Annual Growth Rate (CAGR) of approximately 22% during the forecast period of 2025-2033. This remarkable growth trajectory is underpinned by escalating investments in research and development, increasing regulatory approvals for gene therapies, and a growing understanding of the therapeutic potential of viral vectors across a spectrum of diseases, including rare genetic disorders, cancer, and infectious diseases. The application segment of Vaccine Development is expected to be a significant contributor, benefiting from the ongoing advancements in prophylactic and therapeutic vaccines. Furthermore, the Gene Therapy segment, encompassing treatments for inherited diseases and oncology, will continue to be a primary growth engine. Academic and scientific research institutions are also playing a crucial role, fostering innovation and driving the preclinical and clinical validation of novel viral vector-based therapies.
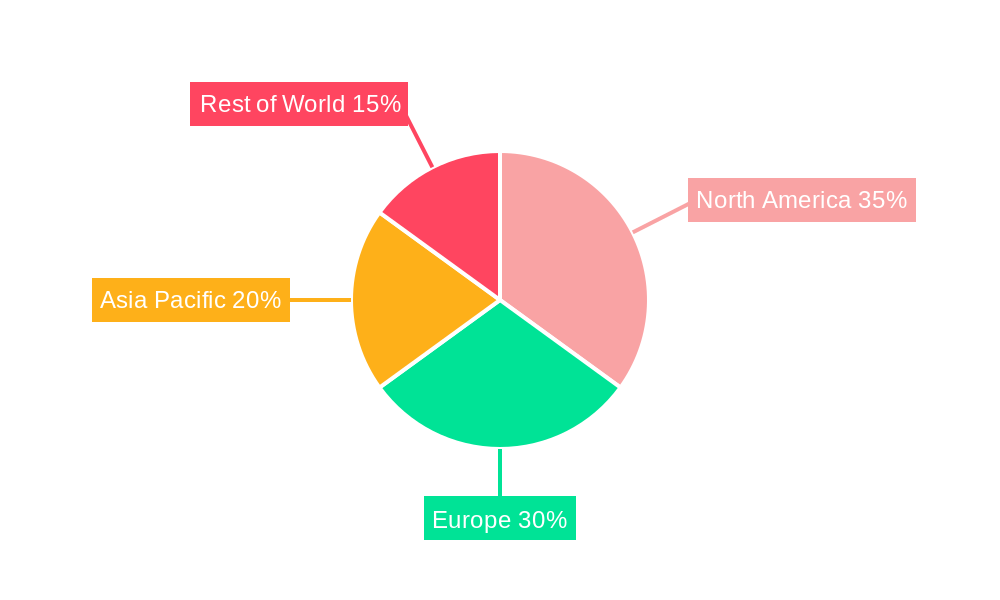
The market's dynamism is further amplified by key trends such as the increasing adoption of contract development and manufacturing organizations (CDMOs) to scale production efficiently and manage the complexities of viral vector manufacturing. Technological advancements in process optimization, purification techniques, and analytical methods are also contributing to improved yields and quality, thereby reducing manufacturing costs and accelerating therapy development. However, the market faces certain restraints, including the high cost of viral vector production, stringent regulatory hurdles, and the need for specialized expertise and infrastructure. Nonetheless, the relentless pursuit of innovative treatments for unmet medical needs, coupled with strategic collaborations between pharmaceutical companies, biotech firms, and CDMOs, is expected to propel the viral vector manufacturing market to new heights. The dominance of Adeno-Associated Virus (AAV) and Lentivirus types within the market is anticipated to persist due to their established safety profiles and broad applicability in gene delivery. North America and Europe are expected to lead the market, driven by advanced healthcare infrastructure and significant R&D investments, while the Asia Pacific region shows promising growth potential.
Viral Vector Manufacturing for Gene Therapy: Unlocking Therapeutic Potential and Market Dominance
Report Description: This comprehensive report delves into the dynamic and rapidly evolving viral vector manufacturing market for gene therapy. It provides an in-depth analysis of market size, growth trends, key players, technological advancements, and future outlook, offering critical insights for stakeholders in the biopharmaceutical and life sciences industries. Covering the study period of 2019–2033, with a base year of 2025, this report equips you with the knowledge to navigate this high-growth sector. We explore the intricate dynamics of AAV manufacturing, lentivirus manufacturing, and adenovirus manufacturing, crucial for gene therapy applications and vaccine development. Understand the competitive landscape, identify emerging opportunities, and strategize for success in this multi-billion dollar market, estimated to reach $XX million units in 2025.
Viral Vector Manufacturing for Gene Therapy Market Dynamics & Structure
The viral vector manufacturing market for gene therapy is characterized by a moderately concentrated structure, with a few key players holding significant market share while a growing number of niche and emerging companies contribute to innovation. Technological innovation remains the primary driver, fueled by advancements in vector design, process optimization, and scalability for AAV, lentivirus, and adenovirus platforms. The regulatory framework, evolving with stringent guidelines from bodies like the FDA and EMA, presents both opportunities for compliant manufacturers and barriers for new entrants. Competitive product substitutes are emerging, primarily in the form of non-viral gene delivery methods, though viral vectors currently offer superior transduction efficiency for many gene therapy applications. End-user demographics are primarily dominated by gene therapy developers, pharmaceutical and biotechnology companies, and academic scientific research institutions. Merger and acquisition (M&A) trends are significant, driven by the need for integrated supply chains, enhanced manufacturing capacity, and access to specialized expertise.
- Market Concentration: Dominated by established CDMOs and specialized vector manufacturers.
- Technological Innovation Drivers: Improved vector yields, purity, and scalability; next-generation vector development.
- Regulatory Frameworks: Increasingly stringent guidelines impacting manufacturing processes and quality control.
- Competitive Product Substitutes: Non-viral delivery systems, mRNA technologies.
- End-User Demographics: Pharmaceutical companies (xx%), Biotechnology companies (xx%), Academic and Research Institutions (xx%).
- M&A Trends: Strategic acquisitions to expand capacity, gain technological expertise, and secure market position.
Viral Vector Manufacturing for Gene Therapy Growth Trends & Insights
The viral vector manufacturing market for gene therapy is experiencing robust growth, projected to reach $XX million units by 2025, with a compound annual growth rate (CAGR) of xx% during the forecast period of 2025–2033. This expansion is underpinned by a significant increase in the pipeline of gene therapy candidates, particularly for rare diseases and oncology. The adoption rates of gene therapies are accelerating as regulatory approvals expand and clinical trial successes become more frequent. Technological disruptions are pivotal, with continuous improvements in upstream and downstream processing, such as single-use technologies and continuous manufacturing, driving down costs and increasing efficiency. Consumer behavior shifts are also influencing the market, with increasing patient and physician awareness of the therapeutic potential of gene therapies. The historical period (2019–2024) has witnessed a steady rise in demand for AAV manufacturing services and lentivirus manufacturing services, laying the groundwork for the current growth trajectory. The market penetration of gene therapies, while still in its nascent stages for many indications, is poised for significant expansion.
- Market Size Evolution: From $XX million units in 2019 to an estimated $XX million units in 2025, and projected to reach $XX million units by 2033.
- Adoption Rates: Steadily increasing due to expanding therapeutic indications and improved accessibility.
- Technological Disruptions: Innovations in bioprocessing, vector design, and analytical technologies.
- Consumer Behavior Shifts: Growing patient and physician demand for advanced therapeutic options.
- Market Penetration: Increasing, particularly in orphan diseases and oncology.
- CAGR: xx% for the forecast period (2025–2033).
Dominant Regions, Countries, or Segments in Viral Vector Manufacturing for Gene Therapy
The gene therapy application segment is unequivocally the dominant driver of the viral vector manufacturing market. Within this, AAV vectors represent the most significant type, accounting for a substantial market share of xx% in 2025, owing to their favorable safety profile and broad applicability. North America, led by the United States, currently holds the largest market share, estimated at xx% in 2025, driven by a strong pipeline of gene therapy products, robust R&D investment, and favorable reimbursement policies. The United States' dominance is further amplified by the presence of leading gene therapy developers and a mature contract development and manufacturing organization (CDMO) ecosystem. Economic policies that incentivize biopharmaceutical innovation and investments in advanced manufacturing infrastructure are key drivers of this regional dominance. The gene therapy application, specifically for rare genetic disorders, is a significant growth area within this segment.
- Dominant Segment (Application): Gene Therapy (estimated xx% market share in 2025).
- Dominant Type: AAV vectors (estimated xx% market share in 2025).
- Dominant Region: North America (estimated xx% market share in 2025).
- Key Country: United States.
- Growth Drivers in North America: Strong R&D pipeline, significant venture capital investment, supportive regulatory environment.
- Market Share of Key Regions: North America (xx%), Europe (xx%), Asia Pacific (xx%), Rest of World (xx%).
- Growth Potential within Gene Therapy: Focus on inherited blood disorders, neurological conditions, and rare pediatric diseases.
Viral Vector Manufacturing for Gene Therapy Product Landscape
The product landscape in viral vector manufacturing is characterized by continuous innovation in vector design and production platforms. Companies are focusing on developing high-titer, high-purity viral vectors that are both cost-effective and scalable. Key product innovations include improved serotypes of AAV vectors for enhanced tissue tropism and reduced immunogenicity, as well as advancements in lentivirus manufacturing for efficient gene delivery to dividing and non-dividing cells. Performance metrics such as vector yield, transduction efficiency, and the ability to achieve consistent batch-to-batch quality are paramount. Unique selling propositions revolve around specialized manufacturing capabilities, adherence to Good Manufacturing Practices (GMP), and comprehensive analytical services for robust quality control.
Key Drivers, Barriers & Challenges in Viral Vector Manufacturing for Gene Therapy
Key Drivers: The viral vector manufacturing market is propelled by several key drivers. The increasing number of gene therapy clinical trials and approvals is a primary catalyst. Advancements in genetic engineering and molecular biology enable the development of more sophisticated and effective viral vectors. Growing investment in biotechnology and pharmaceutical R&D fuels demand for manufacturing services. The expanding therapeutic applications for gene therapies, particularly for previously untreatable diseases, further drives market growth.
Barriers & Challenges: Despite the growth, significant barriers and challenges exist. High manufacturing costs associated with complex viral vector production processes remain a hurdle. Scalability to meet increasing global demand presents technical and logistical complexities. Stringent regulatory requirements necessitate rigorous quality control and validation, impacting timelines and costs. Immunogenicity concerns associated with viral vectors and the potential for off-target effects require careful vector design and clinical evaluation. Supply chain disruptions, as seen historically, can impact raw material availability and lead times.
Emerging Opportunities in Viral Vector Manufacturing for Gene Therapy
Emerging opportunities lie in the expansion of gene therapies to broader indications, including infectious diseases, cardiovascular conditions, and autoimmune disorders. The development of non-integrating lentiviral vectors and novel AAV serotypes offers new avenues for therapeutic interventions. There is a growing demand for GMP-compliant manufacturing capacity, creating opportunities for CDMOs to expand their services. Furthermore, advancements in ex vivo gene therapy manufacturing processes are creating new market segments. The increasing focus on personalized medicine also presents an opportunity for specialized, small-batch manufacturing of viral vectors.
Growth Accelerators in the Viral Vector Manufacturing for Gene Therapy Industry
Long-term growth in the viral vector manufacturing industry will be accelerated by significant technological breakthroughs in vector engineering, leading to improved efficacy and safety profiles. Strategic partnerships between biopharmaceutical companies and specialized CDMOs are crucial for de-risking development and scaling up production. Market expansion strategies, including penetration into emerging economies and addressing underserved therapeutic areas, will also be key accelerators. The development of standardized manufacturing platforms and analytical tools will streamline production and reduce costs, further fueling growth.
Key Players Shaping the Viral Vector Manufacturing for Gene Therapy Market
- Thermo Fisher Scientific
- Lonza
- Catalent
- Charles River
- Merck
- SK pharmteco
- Oxford Biomedica
- AGC Biologics (MolMed)
- Gene Universal
- Polyplus (Sartorius)
- CCRM
- FUJIFILM Diosynth Biotechnologies
- Biovian
- Miltenyi Bioindustry
- Aldevron
- Takara Bio
- Yposkesi
- Genezen
- Exthera
- Flash Therapeutics
- VIVEBiotech
- FinVector
- Eurogentec
- VGXI
- GenScript ProBio
- EurekaBio
- Obio Technology
- GeneSail Biotech
- VectorBuilder
- WuXi ATU
- Ubrigene
- Porton Biologics
- Pharmaron
- PackGene Biotechnology
- Hillgene
- Asymchem
Notable Milestones in Viral Vector Manufacturing for Gene Therapy Sector
- 2019: First successful approval of a CAR-T therapy utilizing lentiviral vectors for a solid tumor indication.
- 2020: Significant increase in demand for adenovirus manufacturing for COVID-19 vaccine development, highlighting manufacturing scalability challenges and solutions.
- 2021: Major investment rounds for several AAV manufacturing CDMOs, signaling growing investor confidence.
- 2022: Approval of several new gene therapies for rare genetic disorders, driving increased demand for vector production.
- 2023: Advancements in continuous manufacturing processes for viral vectors demonstrated, promising improved efficiency.
- 2024: Establishment of new large-scale viral vector manufacturing facilities by key players to meet projected demand.
In-Depth Viral Vector Manufacturing for Gene Therapy Market Outlook
The future outlook for the viral vector manufacturing market is exceptionally strong, driven by the sustained innovation in gene therapy and the increasing number of approved therapies. Growth accelerators will continue to include advancements in vector technology, a focus on cost reduction through process optimization, and strategic expansions of manufacturing capacity by key players. The market is poised to benefit from emerging therapeutic applications and increasing global access to gene-based medicines. Opportunities for collaboration and vertical integration within the supply chain will further solidify market growth.
Disclaimer: All quantitative values are estimated for illustrative purposes and are based on market research projections. The specific values for market size and CAGR require consultation with the full report.
Viral Vector Manufacturing for Gene Therapy Segmentation
-
1. Application
- 1.1. Vaccine Development
- 1.2. Gene Therapy
- 1.3. Academic Scientific Research Institution
- 1.4. Others
-
2. Types
- 2.1. AAV
- 2.2. Lentivirus
- 2.3. Adenovirus
- 2.4. HSV
- 2.5. Others
Viral Vector Manufacturing for Gene Therapy Segmentation By Geography
-
1. North America
- 1.1. United States
- 1.2. Canada
- 1.3. Mexico
-
2. South America
- 2.1. Brazil
- 2.2. Argentina
- 2.3. Rest of South America
-
3. Europe
- 3.1. United Kingdom
- 3.2. Germany
- 3.3. France
- 3.4. Italy
- 3.5. Spain
- 3.6. Russia
- 3.7. Benelux
- 3.8. Nordics
- 3.9. Rest of Europe
-
4. Middle East & Africa
- 4.1. Turkey
- 4.2. Israel
- 4.3. GCC
- 4.4. North Africa
- 4.5. South Africa
- 4.6. Rest of Middle East & Africa
-
5. Asia Pacific
- 5.1. China
- 5.2. India
- 5.3. Japan
- 5.4. South Korea
- 5.5. ASEAN
- 5.6. Oceania
- 5.7. Rest of Asia Pacific
Viral Vector Manufacturing for Gene Therapy REPORT HIGHLIGHTS
| Aspects | Details |
|---|---|
| Study Period | 2019-2033 |
| Base Year | 2024 |
| Estimated Year | 2025 |
| Forecast Period | 2025-2033 |
| Historical Period | 2019-2024 |
| Growth Rate | CAGR of XX% from 2019-2033 |
| Segmentation |
|
Table of Contents
- 1. Introduction
- 1.1. Research Scope
- 1.2. Market Segmentation
- 1.3. Research Methodology
- 1.4. Definitions and Assumptions
- 2. Executive Summary
- 2.1. Introduction
- 3. Market Dynamics
- 3.1. Introduction
- 3.2. Market Drivers
- 3.3. Market Restrains
- 3.4. Market Trends
- 4. Market Factor Analysis
- 4.1. Porters Five Forces
- 4.2. Supply/Value Chain
- 4.3. PESTEL analysis
- 4.4. Market Entropy
- 4.5. Patent/Trademark Analysis
- 5. Global Viral Vector Manufacturing for Gene Therapy Analysis, Insights and Forecast, 2019-2031
- 5.1. Market Analysis, Insights and Forecast - by Application
- 5.1.1. Vaccine Development
- 5.1.2. Gene Therapy
- 5.1.3. Academic Scientific Research Institution
- 5.1.4. Others
- 5.2. Market Analysis, Insights and Forecast - by Types
- 5.2.1. AAV
- 5.2.2. Lentivirus
- 5.2.3. Adenovirus
- 5.2.4. HSV
- 5.2.5. Others
- 5.3. Market Analysis, Insights and Forecast - by Region
- 5.3.1. North America
- 5.3.2. South America
- 5.3.3. Europe
- 5.3.4. Middle East & Africa
- 5.3.5. Asia Pacific
- 5.1. Market Analysis, Insights and Forecast - by Application
- 6. North America Viral Vector Manufacturing for Gene Therapy Analysis, Insights and Forecast, 2019-2031
- 6.1. Market Analysis, Insights and Forecast - by Application
- 6.1.1. Vaccine Development
- 6.1.2. Gene Therapy
- 6.1.3. Academic Scientific Research Institution
- 6.1.4. Others
- 6.2. Market Analysis, Insights and Forecast - by Types
- 6.2.1. AAV
- 6.2.2. Lentivirus
- 6.2.3. Adenovirus
- 6.2.4. HSV
- 6.2.5. Others
- 6.1. Market Analysis, Insights and Forecast - by Application
- 7. South America Viral Vector Manufacturing for Gene Therapy Analysis, Insights and Forecast, 2019-2031
- 7.1. Market Analysis, Insights and Forecast - by Application
- 7.1.1. Vaccine Development
- 7.1.2. Gene Therapy
- 7.1.3. Academic Scientific Research Institution
- 7.1.4. Others
- 7.2. Market Analysis, Insights and Forecast - by Types
- 7.2.1. AAV
- 7.2.2. Lentivirus
- 7.2.3. Adenovirus
- 7.2.4. HSV
- 7.2.5. Others
- 7.1. Market Analysis, Insights and Forecast - by Application
- 8. Europe Viral Vector Manufacturing for Gene Therapy Analysis, Insights and Forecast, 2019-2031
- 8.1. Market Analysis, Insights and Forecast - by Application
- 8.1.1. Vaccine Development
- 8.1.2. Gene Therapy
- 8.1.3. Academic Scientific Research Institution
- 8.1.4. Others
- 8.2. Market Analysis, Insights and Forecast - by Types
- 8.2.1. AAV
- 8.2.2. Lentivirus
- 8.2.3. Adenovirus
- 8.2.4. HSV
- 8.2.5. Others
- 8.1. Market Analysis, Insights and Forecast - by Application
- 9. Middle East & Africa Viral Vector Manufacturing for Gene Therapy Analysis, Insights and Forecast, 2019-2031
- 9.1. Market Analysis, Insights and Forecast - by Application
- 9.1.1. Vaccine Development
- 9.1.2. Gene Therapy
- 9.1.3. Academic Scientific Research Institution
- 9.1.4. Others
- 9.2. Market Analysis, Insights and Forecast - by Types
- 9.2.1. AAV
- 9.2.2. Lentivirus
- 9.2.3. Adenovirus
- 9.2.4. HSV
- 9.2.5. Others
- 9.1. Market Analysis, Insights and Forecast - by Application
- 10. Asia Pacific Viral Vector Manufacturing for Gene Therapy Analysis, Insights and Forecast, 2019-2031
- 10.1. Market Analysis, Insights and Forecast - by Application
- 10.1.1. Vaccine Development
- 10.1.2. Gene Therapy
- 10.1.3. Academic Scientific Research Institution
- 10.1.4. Others
- 10.2. Market Analysis, Insights and Forecast - by Types
- 10.2.1. AAV
- 10.2.2. Lentivirus
- 10.2.3. Adenovirus
- 10.2.4. HSV
- 10.2.5. Others
- 10.1. Market Analysis, Insights and Forecast - by Application
- 11. Competitive Analysis
- 11.1. Global Market Share Analysis 2024
- 11.2. Company Profiles
- 11.2.1 Thermo Fisher Scientific
- 11.2.1.1. Overview
- 11.2.1.2. Products
- 11.2.1.3. SWOT Analysis
- 11.2.1.4. Recent Developments
- 11.2.1.5. Financials (Based on Availability)
- 11.2.2 Lonza
- 11.2.2.1. Overview
- 11.2.2.2. Products
- 11.2.2.3. SWOT Analysis
- 11.2.2.4. Recent Developments
- 11.2.2.5. Financials (Based on Availability)
- 11.2.3 Catalent
- 11.2.3.1. Overview
- 11.2.3.2. Products
- 11.2.3.3. SWOT Analysis
- 11.2.3.4. Recent Developments
- 11.2.3.5. Financials (Based on Availability)
- 11.2.4 Charles River
- 11.2.4.1. Overview
- 11.2.4.2. Products
- 11.2.4.3. SWOT Analysis
- 11.2.4.4. Recent Developments
- 11.2.4.5. Financials (Based on Availability)
- 11.2.5 Merck
- 11.2.5.1. Overview
- 11.2.5.2. Products
- 11.2.5.3. SWOT Analysis
- 11.2.5.4. Recent Developments
- 11.2.5.5. Financials (Based on Availability)
- 11.2.6 SK pharmteco
- 11.2.6.1. Overview
- 11.2.6.2. Products
- 11.2.6.3. SWOT Analysis
- 11.2.6.4. Recent Developments
- 11.2.6.5. Financials (Based on Availability)
- 11.2.7 Oxford Biomedica
- 11.2.7.1. Overview
- 11.2.7.2. Products
- 11.2.7.3. SWOT Analysis
- 11.2.7.4. Recent Developments
- 11.2.7.5. Financials (Based on Availability)
- 11.2.8 AGC Biologics(MolMed)
- 11.2.8.1. Overview
- 11.2.8.2. Products
- 11.2.8.3. SWOT Analysis
- 11.2.8.4. Recent Developments
- 11.2.8.5. Financials (Based on Availability)
- 11.2.9 Gene Universal
- 11.2.9.1. Overview
- 11.2.9.2. Products
- 11.2.9.3. SWOT Analysis
- 11.2.9.4. Recent Developments
- 11.2.9.5. Financials (Based on Availability)
- 11.2.10 Polyplus (Sartorius)
- 11.2.10.1. Overview
- 11.2.10.2. Products
- 11.2.10.3. SWOT Analysis
- 11.2.10.4. Recent Developments
- 11.2.10.5. Financials (Based on Availability)
- 11.2.11 CCRM
- 11.2.11.1. Overview
- 11.2.11.2. Products
- 11.2.11.3. SWOT Analysis
- 11.2.11.4. Recent Developments
- 11.2.11.5. Financials (Based on Availability)
- 11.2.12 FUJIFILM Diosynth Biotechnologies
- 11.2.12.1. Overview
- 11.2.12.2. Products
- 11.2.12.3. SWOT Analysis
- 11.2.12.4. Recent Developments
- 11.2.12.5. Financials (Based on Availability)
- 11.2.13 Biovian
- 11.2.13.1. Overview
- 11.2.13.2. Products
- 11.2.13.3. SWOT Analysis
- 11.2.13.4. Recent Developments
- 11.2.13.5. Financials (Based on Availability)
- 11.2.14 Miltenyi Bioindustry
- 11.2.14.1. Overview
- 11.2.14.2. Products
- 11.2.14.3. SWOT Analysis
- 11.2.14.4. Recent Developments
- 11.2.14.5. Financials (Based on Availability)
- 11.2.15 Aldevron
- 11.2.15.1. Overview
- 11.2.15.2. Products
- 11.2.15.3. SWOT Analysis
- 11.2.15.4. Recent Developments
- 11.2.15.5. Financials (Based on Availability)
- 11.2.16 Takara Bio
- 11.2.16.1. Overview
- 11.2.16.2. Products
- 11.2.16.3. SWOT Analysis
- 11.2.16.4. Recent Developments
- 11.2.16.5. Financials (Based on Availability)
- 11.2.17 Yposkesi
- 11.2.17.1. Overview
- 11.2.17.2. Products
- 11.2.17.3. SWOT Analysis
- 11.2.17.4. Recent Developments
- 11.2.17.5. Financials (Based on Availability)
- 11.2.18 Genezen
- 11.2.18.1. Overview
- 11.2.18.2. Products
- 11.2.18.3. SWOT Analysis
- 11.2.18.4. Recent Developments
- 11.2.18.5. Financials (Based on Availability)
- 11.2.19 Exthera
- 11.2.19.1. Overview
- 11.2.19.2. Products
- 11.2.19.3. SWOT Analysis
- 11.2.19.4. Recent Developments
- 11.2.19.5. Financials (Based on Availability)
- 11.2.20 Flash Therapeutics
- 11.2.20.1. Overview
- 11.2.20.2. Products
- 11.2.20.3. SWOT Analysis
- 11.2.20.4. Recent Developments
- 11.2.20.5. Financials (Based on Availability)
- 11.2.21 VIVEBiotech
- 11.2.21.1. Overview
- 11.2.21.2. Products
- 11.2.21.3. SWOT Analysis
- 11.2.21.4. Recent Developments
- 11.2.21.5. Financials (Based on Availability)
- 11.2.22 FinVector
- 11.2.22.1. Overview
- 11.2.22.2. Products
- 11.2.22.3. SWOT Analysis
- 11.2.22.4. Recent Developments
- 11.2.22.5. Financials (Based on Availability)
- 11.2.23 Eurogentec
- 11.2.23.1. Overview
- 11.2.23.2. Products
- 11.2.23.3. SWOT Analysis
- 11.2.23.4. Recent Developments
- 11.2.23.5. Financials (Based on Availability)
- 11.2.24 VGXI
- 11.2.24.1. Overview
- 11.2.24.2. Products
- 11.2.24.3. SWOT Analysis
- 11.2.24.4. Recent Developments
- 11.2.24.5. Financials (Based on Availability)
- 11.2.25 GenScript ProBio
- 11.2.25.1. Overview
- 11.2.25.2. Products
- 11.2.25.3. SWOT Analysis
- 11.2.25.4. Recent Developments
- 11.2.25.5. Financials (Based on Availability)
- 11.2.26 EurekaBio
- 11.2.26.1. Overview
- 11.2.26.2. Products
- 11.2.26.3. SWOT Analysis
- 11.2.26.4. Recent Developments
- 11.2.26.5. Financials (Based on Availability)
- 11.2.27 Obio Technology
- 11.2.27.1. Overview
- 11.2.27.2. Products
- 11.2.27.3. SWOT Analysis
- 11.2.27.4. Recent Developments
- 11.2.27.5. Financials (Based on Availability)
- 11.2.28 GeneSail Biotech
- 11.2.28.1. Overview
- 11.2.28.2. Products
- 11.2.28.3. SWOT Analysis
- 11.2.28.4. Recent Developments
- 11.2.28.5. Financials (Based on Availability)
- 11.2.29 VectorBuilder
- 11.2.29.1. Overview
- 11.2.29.2. Products
- 11.2.29.3. SWOT Analysis
- 11.2.29.4. Recent Developments
- 11.2.29.5. Financials (Based on Availability)
- 11.2.30 WuXi ATU
- 11.2.30.1. Overview
- 11.2.30.2. Products
- 11.2.30.3. SWOT Analysis
- 11.2.30.4. Recent Developments
- 11.2.30.5. Financials (Based on Availability)
- 11.2.31 Ubrigene
- 11.2.31.1. Overview
- 11.2.31.2. Products
- 11.2.31.3. SWOT Analysis
- 11.2.31.4. Recent Developments
- 11.2.31.5. Financials (Based on Availability)
- 11.2.32 Porton Biologics
- 11.2.32.1. Overview
- 11.2.32.2. Products
- 11.2.32.3. SWOT Analysis
- 11.2.32.4. Recent Developments
- 11.2.32.5. Financials (Based on Availability)
- 11.2.33 Pharmaron
- 11.2.33.1. Overview
- 11.2.33.2. Products
- 11.2.33.3. SWOT Analysis
- 11.2.33.4. Recent Developments
- 11.2.33.5. Financials (Based on Availability)
- 11.2.34 PackGene Biotechnology
- 11.2.34.1. Overview
- 11.2.34.2. Products
- 11.2.34.3. SWOT Analysis
- 11.2.34.4. Recent Developments
- 11.2.34.5. Financials (Based on Availability)
- 11.2.35 Hillgene
- 11.2.35.1. Overview
- 11.2.35.2. Products
- 11.2.35.3. SWOT Analysis
- 11.2.35.4. Recent Developments
- 11.2.35.5. Financials (Based on Availability)
- 11.2.36 Asymchem
- 11.2.36.1. Overview
- 11.2.36.2. Products
- 11.2.36.3. SWOT Analysis
- 11.2.36.4. Recent Developments
- 11.2.36.5. Financials (Based on Availability)
- 11.2.1 Thermo Fisher Scientific
List of Figures
- Figure 1: Global Viral Vector Manufacturing for Gene Therapy Revenue Breakdown (million, %) by Region 2024 & 2032
- Figure 2: North America Viral Vector Manufacturing for Gene Therapy Revenue (million), by Application 2024 & 2032
- Figure 3: North America Viral Vector Manufacturing for Gene Therapy Revenue Share (%), by Application 2024 & 2032
- Figure 4: North America Viral Vector Manufacturing for Gene Therapy Revenue (million), by Types 2024 & 2032
- Figure 5: North America Viral Vector Manufacturing for Gene Therapy Revenue Share (%), by Types 2024 & 2032
- Figure 6: North America Viral Vector Manufacturing for Gene Therapy Revenue (million), by Country 2024 & 2032
- Figure 7: North America Viral Vector Manufacturing for Gene Therapy Revenue Share (%), by Country 2024 & 2032
- Figure 8: South America Viral Vector Manufacturing for Gene Therapy Revenue (million), by Application 2024 & 2032
- Figure 9: South America Viral Vector Manufacturing for Gene Therapy Revenue Share (%), by Application 2024 & 2032
- Figure 10: South America Viral Vector Manufacturing for Gene Therapy Revenue (million), by Types 2024 & 2032
- Figure 11: South America Viral Vector Manufacturing for Gene Therapy Revenue Share (%), by Types 2024 & 2032
- Figure 12: South America Viral Vector Manufacturing for Gene Therapy Revenue (million), by Country 2024 & 2032
- Figure 13: South America Viral Vector Manufacturing for Gene Therapy Revenue Share (%), by Country 2024 & 2032
- Figure 14: Europe Viral Vector Manufacturing for Gene Therapy Revenue (million), by Application 2024 & 2032
- Figure 15: Europe Viral Vector Manufacturing for Gene Therapy Revenue Share (%), by Application 2024 & 2032
- Figure 16: Europe Viral Vector Manufacturing for Gene Therapy Revenue (million), by Types 2024 & 2032
- Figure 17: Europe Viral Vector Manufacturing for Gene Therapy Revenue Share (%), by Types 2024 & 2032
- Figure 18: Europe Viral Vector Manufacturing for Gene Therapy Revenue (million), by Country 2024 & 2032
- Figure 19: Europe Viral Vector Manufacturing for Gene Therapy Revenue Share (%), by Country 2024 & 2032
- Figure 20: Middle East & Africa Viral Vector Manufacturing for Gene Therapy Revenue (million), by Application 2024 & 2032
- Figure 21: Middle East & Africa Viral Vector Manufacturing for Gene Therapy Revenue Share (%), by Application 2024 & 2032
- Figure 22: Middle East & Africa Viral Vector Manufacturing for Gene Therapy Revenue (million), by Types 2024 & 2032
- Figure 23: Middle East & Africa Viral Vector Manufacturing for Gene Therapy Revenue Share (%), by Types 2024 & 2032
- Figure 24: Middle East & Africa Viral Vector Manufacturing for Gene Therapy Revenue (million), by Country 2024 & 2032
- Figure 25: Middle East & Africa Viral Vector Manufacturing for Gene Therapy Revenue Share (%), by Country 2024 & 2032
- Figure 26: Asia Pacific Viral Vector Manufacturing for Gene Therapy Revenue (million), by Application 2024 & 2032
- Figure 27: Asia Pacific Viral Vector Manufacturing for Gene Therapy Revenue Share (%), by Application 2024 & 2032
- Figure 28: Asia Pacific Viral Vector Manufacturing for Gene Therapy Revenue (million), by Types 2024 & 2032
- Figure 29: Asia Pacific Viral Vector Manufacturing for Gene Therapy Revenue Share (%), by Types 2024 & 2032
- Figure 30: Asia Pacific Viral Vector Manufacturing for Gene Therapy Revenue (million), by Country 2024 & 2032
- Figure 31: Asia Pacific Viral Vector Manufacturing for Gene Therapy Revenue Share (%), by Country 2024 & 2032
List of Tables
- Table 1: Global Viral Vector Manufacturing for Gene Therapy Revenue million Forecast, by Region 2019 & 2032
- Table 2: Global Viral Vector Manufacturing for Gene Therapy Revenue million Forecast, by Application 2019 & 2032
- Table 3: Global Viral Vector Manufacturing for Gene Therapy Revenue million Forecast, by Types 2019 & 2032
- Table 4: Global Viral Vector Manufacturing for Gene Therapy Revenue million Forecast, by Region 2019 & 2032
- Table 5: Global Viral Vector Manufacturing for Gene Therapy Revenue million Forecast, by Application 2019 & 2032
- Table 6: Global Viral Vector Manufacturing for Gene Therapy Revenue million Forecast, by Types 2019 & 2032
- Table 7: Global Viral Vector Manufacturing for Gene Therapy Revenue million Forecast, by Country 2019 & 2032
- Table 8: United States Viral Vector Manufacturing for Gene Therapy Revenue (million) Forecast, by Application 2019 & 2032
- Table 9: Canada Viral Vector Manufacturing for Gene Therapy Revenue (million) Forecast, by Application 2019 & 2032
- Table 10: Mexico Viral Vector Manufacturing for Gene Therapy Revenue (million) Forecast, by Application 2019 & 2032
- Table 11: Global Viral Vector Manufacturing for Gene Therapy Revenue million Forecast, by Application 2019 & 2032
- Table 12: Global Viral Vector Manufacturing for Gene Therapy Revenue million Forecast, by Types 2019 & 2032
- Table 13: Global Viral Vector Manufacturing for Gene Therapy Revenue million Forecast, by Country 2019 & 2032
- Table 14: Brazil Viral Vector Manufacturing for Gene Therapy Revenue (million) Forecast, by Application 2019 & 2032
- Table 15: Argentina Viral Vector Manufacturing for Gene Therapy Revenue (million) Forecast, by Application 2019 & 2032
- Table 16: Rest of South America Viral Vector Manufacturing for Gene Therapy Revenue (million) Forecast, by Application 2019 & 2032
- Table 17: Global Viral Vector Manufacturing for Gene Therapy Revenue million Forecast, by Application 2019 & 2032
- Table 18: Global Viral Vector Manufacturing for Gene Therapy Revenue million Forecast, by Types 2019 & 2032
- Table 19: Global Viral Vector Manufacturing for Gene Therapy Revenue million Forecast, by Country 2019 & 2032
- Table 20: United Kingdom Viral Vector Manufacturing for Gene Therapy Revenue (million) Forecast, by Application 2019 & 2032
- Table 21: Germany Viral Vector Manufacturing for Gene Therapy Revenue (million) Forecast, by Application 2019 & 2032
- Table 22: France Viral Vector Manufacturing for Gene Therapy Revenue (million) Forecast, by Application 2019 & 2032
- Table 23: Italy Viral Vector Manufacturing for Gene Therapy Revenue (million) Forecast, by Application 2019 & 2032
- Table 24: Spain Viral Vector Manufacturing for Gene Therapy Revenue (million) Forecast, by Application 2019 & 2032
- Table 25: Russia Viral Vector Manufacturing for Gene Therapy Revenue (million) Forecast, by Application 2019 & 2032
- Table 26: Benelux Viral Vector Manufacturing for Gene Therapy Revenue (million) Forecast, by Application 2019 & 2032
- Table 27: Nordics Viral Vector Manufacturing for Gene Therapy Revenue (million) Forecast, by Application 2019 & 2032
- Table 28: Rest of Europe Viral Vector Manufacturing for Gene Therapy Revenue (million) Forecast, by Application 2019 & 2032
- Table 29: Global Viral Vector Manufacturing for Gene Therapy Revenue million Forecast, by Application 2019 & 2032
- Table 30: Global Viral Vector Manufacturing for Gene Therapy Revenue million Forecast, by Types 2019 & 2032
- Table 31: Global Viral Vector Manufacturing for Gene Therapy Revenue million Forecast, by Country 2019 & 2032
- Table 32: Turkey Viral Vector Manufacturing for Gene Therapy Revenue (million) Forecast, by Application 2019 & 2032
- Table 33: Israel Viral Vector Manufacturing for Gene Therapy Revenue (million) Forecast, by Application 2019 & 2032
- Table 34: GCC Viral Vector Manufacturing for Gene Therapy Revenue (million) Forecast, by Application 2019 & 2032
- Table 35: North Africa Viral Vector Manufacturing for Gene Therapy Revenue (million) Forecast, by Application 2019 & 2032
- Table 36: South Africa Viral Vector Manufacturing for Gene Therapy Revenue (million) Forecast, by Application 2019 & 2032
- Table 37: Rest of Middle East & Africa Viral Vector Manufacturing for Gene Therapy Revenue (million) Forecast, by Application 2019 & 2032
- Table 38: Global Viral Vector Manufacturing for Gene Therapy Revenue million Forecast, by Application 2019 & 2032
- Table 39: Global Viral Vector Manufacturing for Gene Therapy Revenue million Forecast, by Types 2019 & 2032
- Table 40: Global Viral Vector Manufacturing for Gene Therapy Revenue million Forecast, by Country 2019 & 2032
- Table 41: China Viral Vector Manufacturing for Gene Therapy Revenue (million) Forecast, by Application 2019 & 2032
- Table 42: India Viral Vector Manufacturing for Gene Therapy Revenue (million) Forecast, by Application 2019 & 2032
- Table 43: Japan Viral Vector Manufacturing for Gene Therapy Revenue (million) Forecast, by Application 2019 & 2032
- Table 44: South Korea Viral Vector Manufacturing for Gene Therapy Revenue (million) Forecast, by Application 2019 & 2032
- Table 45: ASEAN Viral Vector Manufacturing for Gene Therapy Revenue (million) Forecast, by Application 2019 & 2032
- Table 46: Oceania Viral Vector Manufacturing for Gene Therapy Revenue (million) Forecast, by Application 2019 & 2032
- Table 47: Rest of Asia Pacific Viral Vector Manufacturing for Gene Therapy Revenue (million) Forecast, by Application 2019 & 2032
Frequently Asked Questions
1. What is the projected Compound Annual Growth Rate (CAGR) of the Viral Vector Manufacturing for Gene Therapy?
The projected CAGR is approximately XX%.
2. Which companies are prominent players in the Viral Vector Manufacturing for Gene Therapy?
Key companies in the market include Thermo Fisher Scientific, Lonza, Catalent, Charles River, Merck, SK pharmteco, Oxford Biomedica, AGC Biologics(MolMed), Gene Universal, Polyplus (Sartorius), CCRM, FUJIFILM Diosynth Biotechnologies, Biovian, Miltenyi Bioindustry, Aldevron, Takara Bio, Yposkesi, Genezen, Exthera, Flash Therapeutics, VIVEBiotech, FinVector, Eurogentec, VGXI, GenScript ProBio, EurekaBio, Obio Technology, GeneSail Biotech, VectorBuilder, WuXi ATU, Ubrigene, Porton Biologics, Pharmaron, PackGene Biotechnology, Hillgene, Asymchem.
3. What are the main segments of the Viral Vector Manufacturing for Gene Therapy?
The market segments include Application, Types.
4. Can you provide details about the market size?
The market size is estimated to be USD XXX million as of 2022.
5. What are some drivers contributing to market growth?
N/A
6. What are the notable trends driving market growth?
N/A
7. Are there any restraints impacting market growth?
N/A
8. Can you provide examples of recent developments in the market?
N/A
9. What pricing options are available for accessing the report?
Pricing options include single-user, multi-user, and enterprise licenses priced at USD 2900.00, USD 4350.00, and USD 5800.00 respectively.
10. Is the market size provided in terms of value or volume?
The market size is provided in terms of value, measured in million.
11. Are there any specific market keywords associated with the report?
Yes, the market keyword associated with the report is "Viral Vector Manufacturing for Gene Therapy," which aids in identifying and referencing the specific market segment covered.
12. How do I determine which pricing option suits my needs best?
The pricing options vary based on user requirements and access needs. Individual users may opt for single-user licenses, while businesses requiring broader access may choose multi-user or enterprise licenses for cost-effective access to the report.
13. Are there any additional resources or data provided in the Viral Vector Manufacturing for Gene Therapy report?
While the report offers comprehensive insights, it's advisable to review the specific contents or supplementary materials provided to ascertain if additional resources or data are available.
14. How can I stay updated on further developments or reports in the Viral Vector Manufacturing for Gene Therapy?
To stay informed about further developments, trends, and reports in the Viral Vector Manufacturing for Gene Therapy, consider subscribing to industry newsletters, following relevant companies and organizations, or regularly checking reputable industry news sources and publications.
Methodology
Step 1 - Identification of Relevant Samples Size from Population Database


Step 2 - Approaches for Defining Global Market Size (Value, Volume* & Price*)

Note*: In applicable scenarios
Step 3 - Data Sources
Primary Research
- Web Analytics
- Survey Reports
- Research Institute
- Latest Research Reports
- Opinion Leaders
Secondary Research
- Annual Reports
- White Paper
- Latest Press Release
- Industry Association
- Paid Database
- Investor Presentations

Step 4 - Data Triangulation
Involves using different sources of information in order to increase the validity of a study
These sources are likely to be stakeholders in a program - participants, other researchers, program staff, other community members, and so on.
Then we put all data in single framework & apply various statistical tools to find out the dynamic on the market.
During the analysis stage, feedback from the stakeholder groups would be compared to determine areas of agreement as well as areas of divergence
