

Key Insights
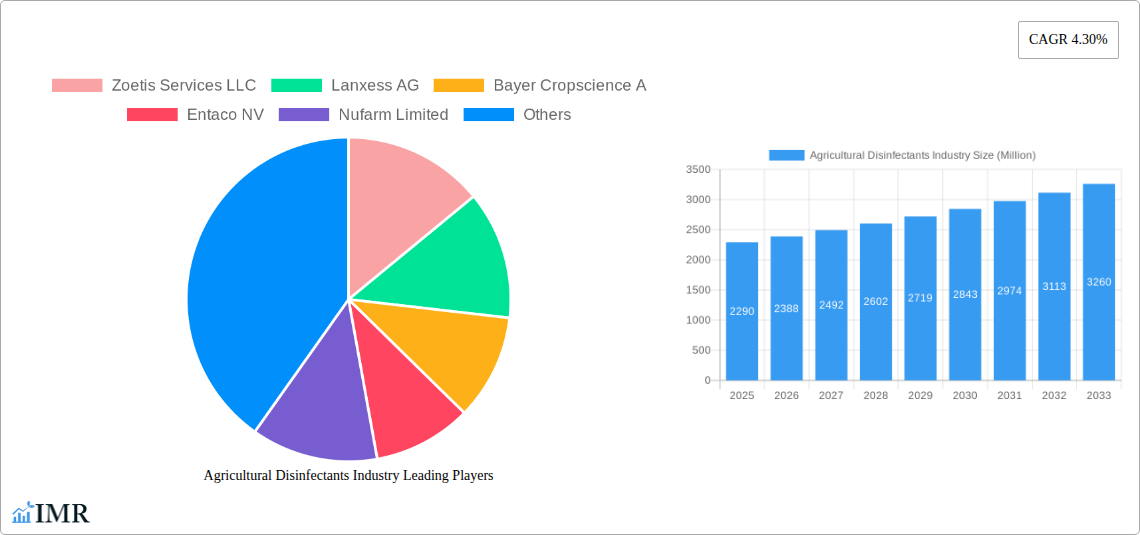
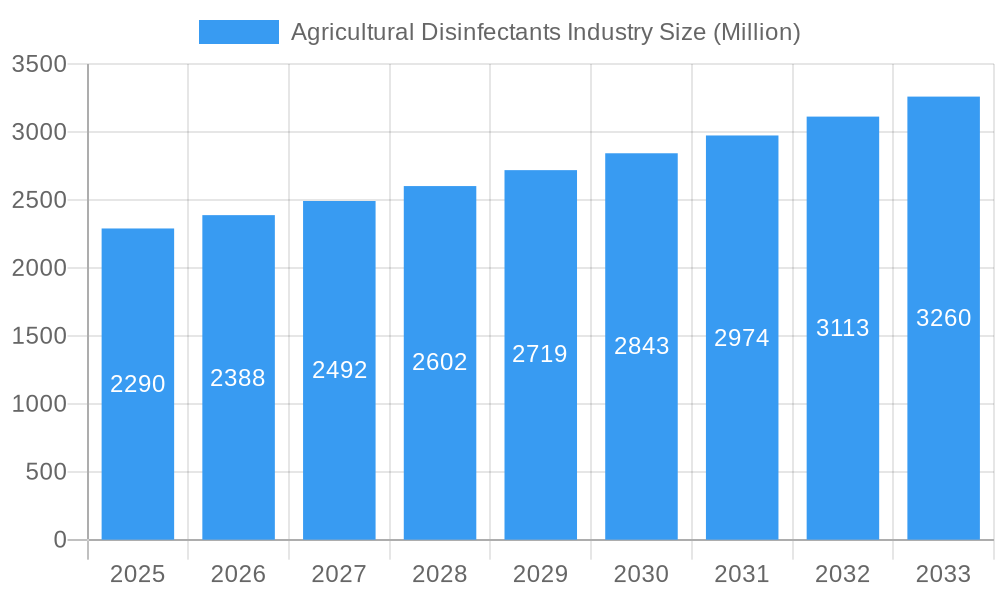
The agricultural disinfectants market, valued at $2.29 billion in 2025, is projected to experience steady growth, driven by increasing concerns about food safety and the rising prevalence of animal and plant diseases. The market's Compound Annual Growth Rate (CAGR) of 4.30% from 2025 to 2033 indicates a consistent expansion, fueled by the adoption of advanced disinfection technologies and stricter regulatory frameworks regarding hygiene standards in agriculture. Key drivers include the growing demand for safe and high-quality agricultural produce, a surge in intensive farming practices necessitating robust disinfection protocols, and increasing awareness among farmers about the economic benefits of disease prevention. Market segmentation reveals a preference for liquid formulations, with surface sanitization being the dominant application. Quaternary Ammonium Chloride Salts remain a significant chemical type, although the market is witnessing growing interest in environmentally friendly alternatives like hydrogen peroxide and peracetic acid. Challenges include the potential for disinfectant resistance development in pathogens and fluctuating raw material prices. The geographic distribution reveals a strong presence in North America and Europe, with Asia-Pacific expected to witness significant growth in the forecast period driven by expanding agricultural production. Major players in the market are continuously investing in research and development to create more effective and sustainable disinfection solutions.
Agricultural Disinfectants Industry Market Size (In Billion)
The competitive landscape is characterized by both established multinational corporations and smaller specialized companies. The presence of large players like Zoetis, Bayer, and Lanxess ensures a steady supply and innovation in the market. However, smaller players focused on niche applications or specific chemical types are also contributing significantly to the market's diversification and overall growth. Future growth hinges on the development of novel disinfectants with enhanced efficacy, reduced environmental impact, and improved cost-effectiveness. The increasing adoption of precision agriculture and integrated pest management strategies also presents opportunities for growth in specialized disinfectants tailored to specific crop needs. Government support and educational initiatives aimed at promoting best practices in agricultural sanitation are likely to further stimulate market expansion. The market's overall outlook remains positive, promising substantial growth opportunities for companies capable of adapting to evolving market dynamics and technological advancements.
Agricultural Disinfectants Industry Company Market Share
Agricultural Disinfectants Industry Market Report: 2019-2033
This comprehensive report provides a detailed analysis of the Agricultural Disinfectants market, encompassing market dynamics, growth trends, regional insights, product landscapes, and key players. With a focus on parent market (Animal Health and Crop Protection) and child market segments (Chemical Disinfectants specifically for agricultural applications), this report is a valuable resource for industry professionals, investors, and strategic decision-makers. The study period covers 2019-2033, with 2025 as the base and estimated year.
Study Period: 2019–2033 Base Year: 2025 Estimated Year: 2025 Forecast Period: 2025–2033 Historical Period: 2019–2024
Agricultural Disinfectants Industry Market Dynamics & Structure
The agricultural disinfectants market is characterized by moderate concentration, with several key players dominating significant market shares. Technological innovation, driven by the need for enhanced efficacy and environmentally friendly solutions, is a major driver. Stringent regulatory frameworks concerning chemical usage and environmental impact significantly influence market strategies. Competitive pressure from substitute products, such as natural disinfectants, is growing. End-user demographics, including large-scale farms and smallholder farmers, impact product demand and pricing strategies. M&A activity has been moderate, with key players strategically acquiring smaller companies to expand their product portfolios and technological capabilities.
- Market Concentration: Moderately concentrated, with top 5 players holding approximately xx% market share in 2024 (estimated).
- Technological Innovation: Focus on bio-based disinfectants, improved efficacy, and reduced environmental impact.
- Regulatory Framework: Stringent regulations on chemical usage and disposal significantly impact market dynamics.
- Competitive Substitutes: Growing adoption of natural and eco-friendly alternatives.
- End-User Demographics: Large-scale farms represent a significant portion of the market, with growing demand from smallholder farmers in developing economies.
- M&A Trends: Moderate activity, with xx major deals recorded between 2019 and 2024.
Agricultural Disinfectants Industry Growth Trends & Insights
The agricultural disinfectants market experienced steady growth during the historical period (2019-2024), driven by increasing awareness of disease prevention and biosecurity in agriculture. The market size was valued at approximately XX million units in 2024 and is projected to reach XX million units by 2033, exhibiting a CAGR of xx% during the forecast period. Technological advancements, such as the development of novel disinfectant formulations with enhanced efficacy and broader application, have been significant drivers. Consumer behavior shifts towards sustainable and environmentally responsible farming practices are also influencing product choices. Market penetration in developing economies is expected to increase significantly.
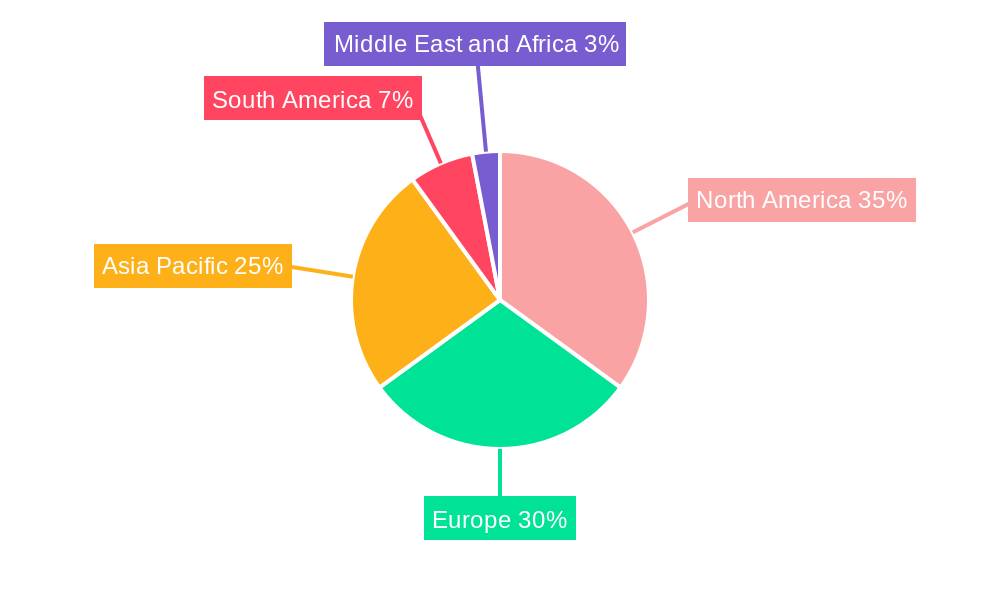
Dominant Regions, Countries, or Segments in Agricultural Disinfectants Industry
North America and Europe currently dominate the agricultural disinfectants market, driven by advanced agricultural practices, stringent regulatory frameworks, and high levels of awareness regarding biosecurity. However, Asia-Pacific is expected to show the fastest growth due to increasing agricultural production and rising demand for disease prevention measures. Within segments, liquid formulations maintain the largest market share, followed by powder. Quaternary Ammonium Chloride Salts dominate the chemical type segment, though Hydrogen Dioxide and Peryoxyacetic Acid are gaining traction due to their environmental benefits. Surface application remains the most prevalent, followed by water sanitizing.
- Leading Regions: North America, Europe, Asia-Pacific.
- Key Drivers (Asia-Pacific): Rising agricultural output, increasing government investment in agricultural infrastructure, and growing awareness of biosecurity.
- Market Share (Chemical Type): Quaternary Ammonium Chloride Salts (xx%), Hydrogen Dioxide and Peryoxyacetic Acid (xx%), Hypochlorites and Halogens (xx%), Other Chemical Types (xx%).
- Market Share (Form): Liquid (xx%), Powder (xx%).
- Market Share (Application): Surface (xx%), Aerial (xx%), Water Sanitizing (xx%).
Agricultural Disinfectants Industry Product Landscape
The agricultural disinfectants market features a wide range of products with varying formulations, efficacy, and target applications. Innovations focus on enhanced efficacy against specific pathogens, improved environmental compatibility, and ease of application. Unique selling propositions include broad-spectrum activity, reduced toxicity, and ease of use. Technological advancements involve the incorporation of nanotechnology and targeted delivery systems.
Key Drivers, Barriers & Challenges in Agricultural Disinfectants Industry
Key Drivers:
- Increasing awareness of animal and plant diseases.
- Growing demand for enhanced biosecurity measures.
- Rising adoption of advanced agricultural technologies.
- Stringent government regulations promoting disease prevention.
Key Challenges:
- Fluctuating raw material prices.
- Stringent regulatory approvals and compliance costs.
- Intense competition from existing and emerging players.
- Potential environmental concerns associated with certain chemical disinfectants.
Emerging Opportunities in Agricultural Disinfectants Industry
Emerging opportunities lie in developing eco-friendly and sustainable disinfectants, expanding into untapped markets in developing economies, and catering to specific needs of various agricultural segments (e.g., poultry, livestock, horticulture). Innovative application methods, such as automated spraying systems, represent another growth avenue.
Growth Accelerators in the Agricultural Disinfectants Industry
Technological advancements in disinfectant formulations, strategic partnerships to expand market reach, and proactive expansion into new geographic markets are key catalysts for long-term growth. Sustainable and environmentally friendly options are gaining significant traction and represent a major growth opportunity.
Key Players Shaping the Agricultural Disinfectants Industry Market
Notable Milestones in Agricultural Disinfectants Industry Sector
- 2021 (July): Ceva Santé Animale Group and INRAE Technologies signed an agreement to strengthen collaboration in animal health, focusing on infectious disease prevention and animal welfare.
- 2021 (October): Lanxess AG acquired Theseo, a disinfection and hygiene solutions provider, enhancing its position in animal hygiene.
In-Depth Agricultural Disinfectants Industry Market Outlook
The agricultural disinfectants market is poised for continued growth, driven by technological innovation, rising demand for biosecurity, and expansion into new markets. Strategic partnerships, focus on sustainability, and the development of tailored solutions for specific agricultural segments will be crucial for success in this dynamic market. The focus on environmentally friendly alternatives will shape the future competitive landscape, creating exciting opportunities for companies committed to innovation and sustainability.
Agricultural Disinfectants Industry Segmentation
- 1. Production Analysis
- 2. Consumption Analysis
- 3. Import Market Analysis (Value & Volume)
- 4. Export Market Analysis (Value & Volume)
- 5. Price Trend Analysis
Agricultural Disinfectants Industry Segmentation By Geography
-
1. North America
- 1.1. United States
- 1.2. Canada
- 1.3. Mexico
-
2. South America
- 2.1. Brazil
- 2.2. Argentina
- 2.3. Rest of South America
-
3. Europe
- 3.1. United Kingdom
- 3.2. Germany
- 3.3. France
- 3.4. Italy
- 3.5. Spain
- 3.6. Russia
- 3.7. Benelux
- 3.8. Nordics
- 3.9. Rest of Europe
-
4. Middle East & Africa
- 4.1. Turkey
- 4.2. Israel
- 4.3. GCC
- 4.4. North Africa
- 4.5. South Africa
- 4.6. Rest of Middle East & Africa
-
5. Asia Pacific
- 5.1. China
- 5.2. India
- 5.3. Japan
- 5.4. South Korea
- 5.5. ASEAN
- 5.6. Oceania
- 5.7. Rest of Asia Pacific
Agricultural Disinfectants Industry Regional Market Share
Geographic Coverage of Agricultural Disinfectants Industry
Agricultural Disinfectants Industry REPORT HIGHLIGHTS
| Aspects | Details |
|---|---|
| Study Period | 2020-2034 |
| Base Year | 2025 |
| Estimated Year | 2026 |
| Forecast Period | 2026-2034 |
| Historical Period | 2020-2025 |
| Growth Rate | CAGR of 4.30% from 2020-2034 |
| Segmentation |
|
Table of Contents
- 1. Introduction
- 1.1. Research Scope
- 1.2. Market Segmentation
- 1.3. Research Methodology
- 1.4. Definitions and Assumptions
- 2. Executive Summary
- 2.1. Introduction
- 3. Market Dynamics
- 3.1. Introduction
- 3.2. Market Drivers
- 3.2.1. Skilled Labor Shortage; Favorable Government Policies
- 3.3. Market Restrains
- 3.3.1. Fragmentation of Land Holdings; Increasing Interest of Farmers Toward Custom Hiring Center
- 3.4. Market Trends
- 3.4.1. Growing Area Under Protected Cultivation
- 4. Market Factor Analysis
- 4.1. Porters Five Forces
- 4.2. Supply/Value Chain
- 4.3. PESTEL analysis
- 4.4. Market Entropy
- 4.5. Patent/Trademark Analysis
- 5. Global Agricultural Disinfectants Industry Analysis, Insights and Forecast, 2020-2032
- 5.1. Market Analysis, Insights and Forecast - by Production Analysis
- 5.2. Market Analysis, Insights and Forecast - by Consumption Analysis
- 5.3. Market Analysis, Insights and Forecast - by Import Market Analysis (Value & Volume)
- 5.4. Market Analysis, Insights and Forecast - by Export Market Analysis (Value & Volume)
- 5.5. Market Analysis, Insights and Forecast - by Price Trend Analysis
- 5.6. Market Analysis, Insights and Forecast - by Region
- 5.6.1. North America
- 5.6.2. South America
- 5.6.3. Europe
- 5.6.4. Middle East & Africa
- 5.6.5. Asia Pacific
- 5.1. Market Analysis, Insights and Forecast - by Production Analysis
- 6. North America Agricultural Disinfectants Industry Analysis, Insights and Forecast, 2020-2032
- 6.1. Market Analysis, Insights and Forecast - by Production Analysis
- 6.2. Market Analysis, Insights and Forecast - by Consumption Analysis
- 6.3. Market Analysis, Insights and Forecast - by Import Market Analysis (Value & Volume)
- 6.4. Market Analysis, Insights and Forecast - by Export Market Analysis (Value & Volume)
- 6.5. Market Analysis, Insights and Forecast - by Price Trend Analysis
- 6.1. Market Analysis, Insights and Forecast - by Production Analysis
- 7. South America Agricultural Disinfectants Industry Analysis, Insights and Forecast, 2020-2032
- 7.1. Market Analysis, Insights and Forecast - by Production Analysis
- 7.2. Market Analysis, Insights and Forecast - by Consumption Analysis
- 7.3. Market Analysis, Insights and Forecast - by Import Market Analysis (Value & Volume)
- 7.4. Market Analysis, Insights and Forecast - by Export Market Analysis (Value & Volume)
- 7.5. Market Analysis, Insights and Forecast - by Price Trend Analysis
- 7.1. Market Analysis, Insights and Forecast - by Production Analysis
- 8. Europe Agricultural Disinfectants Industry Analysis, Insights and Forecast, 2020-2032
- 8.1. Market Analysis, Insights and Forecast - by Production Analysis
- 8.2. Market Analysis, Insights and Forecast - by Consumption Analysis
- 8.3. Market Analysis, Insights and Forecast - by Import Market Analysis (Value & Volume)
- 8.4. Market Analysis, Insights and Forecast - by Export Market Analysis (Value & Volume)
- 8.5. Market Analysis, Insights and Forecast - by Price Trend Analysis
- 8.1. Market Analysis, Insights and Forecast - by Production Analysis
- 9. Middle East & Africa Agricultural Disinfectants Industry Analysis, Insights and Forecast, 2020-2032
- 9.1. Market Analysis, Insights and Forecast - by Production Analysis
- 9.2. Market Analysis, Insights and Forecast - by Consumption Analysis
- 9.3. Market Analysis, Insights and Forecast - by Import Market Analysis (Value & Volume)
- 9.4. Market Analysis, Insights and Forecast - by Export Market Analysis (Value & Volume)
- 9.5. Market Analysis, Insights and Forecast - by Price Trend Analysis
- 9.1. Market Analysis, Insights and Forecast - by Production Analysis
- 10. Asia Pacific Agricultural Disinfectants Industry Analysis, Insights and Forecast, 2020-2032
- 10.1. Market Analysis, Insights and Forecast - by Production Analysis
- 10.2. Market Analysis, Insights and Forecast - by Consumption Analysis
- 10.3. Market Analysis, Insights and Forecast - by Import Market Analysis (Value & Volume)
- 10.4. Market Analysis, Insights and Forecast - by Export Market Analysis (Value & Volume)
- 10.5. Market Analysis, Insights and Forecast - by Price Trend Analysis
- 10.1. Market Analysis, Insights and Forecast - by Production Analysis
- 11. Competitive Analysis
- 11.1. Global Market Share Analysis 2025
- 11.2. Company Profiles
- 11.2.1 Zoetis Services LLC
- 11.2.1.1. Overview
- 11.2.1.2. Products
- 11.2.1.3. SWOT Analysis
- 11.2.1.4. Recent Developments
- 11.2.1.5. Financials (Based on Availability)
- 11.2.2 Lanxess AG
- 11.2.2.1. Overview
- 11.2.2.2. Products
- 11.2.2.3. SWOT Analysis
- 11.2.2.4. Recent Developments
- 11.2.2.5. Financials (Based on Availability)
- 11.2.3 Bayer Cropscience A
- 11.2.3.1. Overview
- 11.2.3.2. Products
- 11.2.3.3. SWOT Analysis
- 11.2.3.4. Recent Developments
- 11.2.3.5. Financials (Based on Availability)
- 11.2.4 Entaco NV
- 11.2.4.1. Overview
- 11.2.4.2. Products
- 11.2.4.3. SWOT Analysis
- 11.2.4.4. Recent Developments
- 11.2.4.5. Financials (Based on Availability)
- 11.2.5 Nufarm Limited
- 11.2.5.1. Overview
- 11.2.5.2. Products
- 11.2.5.3. SWOT Analysis
- 11.2.5.4. Recent Developments
- 11.2.5.5. Financials (Based on Availability)
- 11.2.6 Corteva Agri Science
- 11.2.6.1. Overview
- 11.2.6.2. Products
- 11.2.6.3. SWOT Analysis
- 11.2.6.4. Recent Developments
- 11.2.6.5. Financials (Based on Availability)
- 11.2.7 Stepan Company
- 11.2.7.1. Overview
- 11.2.7.2. Products
- 11.2.7.3. SWOT Analysis
- 11.2.7.4. Recent Developments
- 11.2.7.5. Financials (Based on Availability)
- 11.2.8 Neogen Corporation
- 11.2.8.1. Overview
- 11.2.8.2. Products
- 11.2.8.3. SWOT Analysis
- 11.2.8.4. Recent Developments
- 11.2.8.5. Financials (Based on Availability)
- 11.2.9 Thymox Technology
- 11.2.9.1. Overview
- 11.2.9.2. Products
- 11.2.9.3. SWOT Analysis
- 11.2.9.4. Recent Developments
- 11.2.9.5. Financials (Based on Availability)
- 11.2.10 Ceva Sante Animale Group
- 11.2.10.1. Overview
- 11.2.10.2. Products
- 11.2.10.3. SWOT Analysis
- 11.2.10.4. Recent Developments
- 11.2.10.5. Financials (Based on Availability)
- 11.2.1 Zoetis Services LLC
List of Figures
- Figure 1: Global Agricultural Disinfectants Industry Revenue Breakdown (Million, %) by Region 2025 & 2033
- Figure 2: North America Agricultural Disinfectants Industry Revenue (Million), by Production Analysis 2025 & 2033
- Figure 3: North America Agricultural Disinfectants Industry Revenue Share (%), by Production Analysis 2025 & 2033
- Figure 4: North America Agricultural Disinfectants Industry Revenue (Million), by Consumption Analysis 2025 & 2033
- Figure 5: North America Agricultural Disinfectants Industry Revenue Share (%), by Consumption Analysis 2025 & 2033
- Figure 6: North America Agricultural Disinfectants Industry Revenue (Million), by Import Market Analysis (Value & Volume) 2025 & 2033
- Figure 7: North America Agricultural Disinfectants Industry Revenue Share (%), by Import Market Analysis (Value & Volume) 2025 & 2033
- Figure 8: North America Agricultural Disinfectants Industry Revenue (Million), by Export Market Analysis (Value & Volume) 2025 & 2033
- Figure 9: North America Agricultural Disinfectants Industry Revenue Share (%), by Export Market Analysis (Value & Volume) 2025 & 2033
- Figure 10: North America Agricultural Disinfectants Industry Revenue (Million), by Price Trend Analysis 2025 & 2033
- Figure 11: North America Agricultural Disinfectants Industry Revenue Share (%), by Price Trend Analysis 2025 & 2033
- Figure 12: North America Agricultural Disinfectants Industry Revenue (Million), by Country 2025 & 2033
- Figure 13: North America Agricultural Disinfectants Industry Revenue Share (%), by Country 2025 & 2033
- Figure 14: South America Agricultural Disinfectants Industry Revenue (Million), by Production Analysis 2025 & 2033
- Figure 15: South America Agricultural Disinfectants Industry Revenue Share (%), by Production Analysis 2025 & 2033
- Figure 16: South America Agricultural Disinfectants Industry Revenue (Million), by Consumption Analysis 2025 & 2033
- Figure 17: South America Agricultural Disinfectants Industry Revenue Share (%), by Consumption Analysis 2025 & 2033
- Figure 18: South America Agricultural Disinfectants Industry Revenue (Million), by Import Market Analysis (Value & Volume) 2025 & 2033
- Figure 19: South America Agricultural Disinfectants Industry Revenue Share (%), by Import Market Analysis (Value & Volume) 2025 & 2033
- Figure 20: South America Agricultural Disinfectants Industry Revenue (Million), by Export Market Analysis (Value & Volume) 2025 & 2033
- Figure 21: South America Agricultural Disinfectants Industry Revenue Share (%), by Export Market Analysis (Value & Volume) 2025 & 2033
- Figure 22: South America Agricultural Disinfectants Industry Revenue (Million), by Price Trend Analysis 2025 & 2033
- Figure 23: South America Agricultural Disinfectants Industry Revenue Share (%), by Price Trend Analysis 2025 & 2033
- Figure 24: South America Agricultural Disinfectants Industry Revenue (Million), by Country 2025 & 2033
- Figure 25: South America Agricultural Disinfectants Industry Revenue Share (%), by Country 2025 & 2033
- Figure 26: Europe Agricultural Disinfectants Industry Revenue (Million), by Production Analysis 2025 & 2033
- Figure 27: Europe Agricultural Disinfectants Industry Revenue Share (%), by Production Analysis 2025 & 2033
- Figure 28: Europe Agricultural Disinfectants Industry Revenue (Million), by Consumption Analysis 2025 & 2033
- Figure 29: Europe Agricultural Disinfectants Industry Revenue Share (%), by Consumption Analysis 2025 & 2033
- Figure 30: Europe Agricultural Disinfectants Industry Revenue (Million), by Import Market Analysis (Value & Volume) 2025 & 2033
- Figure 31: Europe Agricultural Disinfectants Industry Revenue Share (%), by Import Market Analysis (Value & Volume) 2025 & 2033
- Figure 32: Europe Agricultural Disinfectants Industry Revenue (Million), by Export Market Analysis (Value & Volume) 2025 & 2033
- Figure 33: Europe Agricultural Disinfectants Industry Revenue Share (%), by Export Market Analysis (Value & Volume) 2025 & 2033
- Figure 34: Europe Agricultural Disinfectants Industry Revenue (Million), by Price Trend Analysis 2025 & 2033
- Figure 35: Europe Agricultural Disinfectants Industry Revenue Share (%), by Price Trend Analysis 2025 & 2033
- Figure 36: Europe Agricultural Disinfectants Industry Revenue (Million), by Country 2025 & 2033
- Figure 37: Europe Agricultural Disinfectants Industry Revenue Share (%), by Country 2025 & 2033
- Figure 38: Middle East & Africa Agricultural Disinfectants Industry Revenue (Million), by Production Analysis 2025 & 2033
- Figure 39: Middle East & Africa Agricultural Disinfectants Industry Revenue Share (%), by Production Analysis 2025 & 2033
- Figure 40: Middle East & Africa Agricultural Disinfectants Industry Revenue (Million), by Consumption Analysis 2025 & 2033
- Figure 41: Middle East & Africa Agricultural Disinfectants Industry Revenue Share (%), by Consumption Analysis 2025 & 2033
- Figure 42: Middle East & Africa Agricultural Disinfectants Industry Revenue (Million), by Import Market Analysis (Value & Volume) 2025 & 2033
- Figure 43: Middle East & Africa Agricultural Disinfectants Industry Revenue Share (%), by Import Market Analysis (Value & Volume) 2025 & 2033
- Figure 44: Middle East & Africa Agricultural Disinfectants Industry Revenue (Million), by Export Market Analysis (Value & Volume) 2025 & 2033
- Figure 45: Middle East & Africa Agricultural Disinfectants Industry Revenue Share (%), by Export Market Analysis (Value & Volume) 2025 & 2033
- Figure 46: Middle East & Africa Agricultural Disinfectants Industry Revenue (Million), by Price Trend Analysis 2025 & 2033
- Figure 47: Middle East & Africa Agricultural Disinfectants Industry Revenue Share (%), by Price Trend Analysis 2025 & 2033
- Figure 48: Middle East & Africa Agricultural Disinfectants Industry Revenue (Million), by Country 2025 & 2033
- Figure 49: Middle East & Africa Agricultural Disinfectants Industry Revenue Share (%), by Country 2025 & 2033
- Figure 50: Asia Pacific Agricultural Disinfectants Industry Revenue (Million), by Production Analysis 2025 & 2033
- Figure 51: Asia Pacific Agricultural Disinfectants Industry Revenue Share (%), by Production Analysis 2025 & 2033
- Figure 52: Asia Pacific Agricultural Disinfectants Industry Revenue (Million), by Consumption Analysis 2025 & 2033
- Figure 53: Asia Pacific Agricultural Disinfectants Industry Revenue Share (%), by Consumption Analysis 2025 & 2033
- Figure 54: Asia Pacific Agricultural Disinfectants Industry Revenue (Million), by Import Market Analysis (Value & Volume) 2025 & 2033
- Figure 55: Asia Pacific Agricultural Disinfectants Industry Revenue Share (%), by Import Market Analysis (Value & Volume) 2025 & 2033
- Figure 56: Asia Pacific Agricultural Disinfectants Industry Revenue (Million), by Export Market Analysis (Value & Volume) 2025 & 2033
- Figure 57: Asia Pacific Agricultural Disinfectants Industry Revenue Share (%), by Export Market Analysis (Value & Volume) 2025 & 2033
- Figure 58: Asia Pacific Agricultural Disinfectants Industry Revenue (Million), by Price Trend Analysis 2025 & 2033
- Figure 59: Asia Pacific Agricultural Disinfectants Industry Revenue Share (%), by Price Trend Analysis 2025 & 2033
- Figure 60: Asia Pacific Agricultural Disinfectants Industry Revenue (Million), by Country 2025 & 2033
- Figure 61: Asia Pacific Agricultural Disinfectants Industry Revenue Share (%), by Country 2025 & 2033
List of Tables
- Table 1: Global Agricultural Disinfectants Industry Revenue Million Forecast, by Production Analysis 2020 & 2033
- Table 2: Global Agricultural Disinfectants Industry Revenue Million Forecast, by Consumption Analysis 2020 & 2033
- Table 3: Global Agricultural Disinfectants Industry Revenue Million Forecast, by Import Market Analysis (Value & Volume) 2020 & 2033
- Table 4: Global Agricultural Disinfectants Industry Revenue Million Forecast, by Export Market Analysis (Value & Volume) 2020 & 2033
- Table 5: Global Agricultural Disinfectants Industry Revenue Million Forecast, by Price Trend Analysis 2020 & 2033
- Table 6: Global Agricultural Disinfectants Industry Revenue Million Forecast, by Region 2020 & 2033
- Table 7: Global Agricultural Disinfectants Industry Revenue Million Forecast, by Production Analysis 2020 & 2033
- Table 8: Global Agricultural Disinfectants Industry Revenue Million Forecast, by Consumption Analysis 2020 & 2033
- Table 9: Global Agricultural Disinfectants Industry Revenue Million Forecast, by Import Market Analysis (Value & Volume) 2020 & 2033
- Table 10: Global Agricultural Disinfectants Industry Revenue Million Forecast, by Export Market Analysis (Value & Volume) 2020 & 2033
- Table 11: Global Agricultural Disinfectants Industry Revenue Million Forecast, by Price Trend Analysis 2020 & 2033
- Table 12: Global Agricultural Disinfectants Industry Revenue Million Forecast, by Country 2020 & 2033
- Table 13: United States Agricultural Disinfectants Industry Revenue (Million) Forecast, by Application 2020 & 2033
- Table 14: Canada Agricultural Disinfectants Industry Revenue (Million) Forecast, by Application 2020 & 2033
- Table 15: Mexico Agricultural Disinfectants Industry Revenue (Million) Forecast, by Application 2020 & 2033
- Table 16: Global Agricultural Disinfectants Industry Revenue Million Forecast, by Production Analysis 2020 & 2033
- Table 17: Global Agricultural Disinfectants Industry Revenue Million Forecast, by Consumption Analysis 2020 & 2033
- Table 18: Global Agricultural Disinfectants Industry Revenue Million Forecast, by Import Market Analysis (Value & Volume) 2020 & 2033
- Table 19: Global Agricultural Disinfectants Industry Revenue Million Forecast, by Export Market Analysis (Value & Volume) 2020 & 2033
- Table 20: Global Agricultural Disinfectants Industry Revenue Million Forecast, by Price Trend Analysis 2020 & 2033
- Table 21: Global Agricultural Disinfectants Industry Revenue Million Forecast, by Country 2020 & 2033
- Table 22: Brazil Agricultural Disinfectants Industry Revenue (Million) Forecast, by Application 2020 & 2033
- Table 23: Argentina Agricultural Disinfectants Industry Revenue (Million) Forecast, by Application 2020 & 2033
- Table 24: Rest of South America Agricultural Disinfectants Industry Revenue (Million) Forecast, by Application 2020 & 2033
- Table 25: Global Agricultural Disinfectants Industry Revenue Million Forecast, by Production Analysis 2020 & 2033
- Table 26: Global Agricultural Disinfectants Industry Revenue Million Forecast, by Consumption Analysis 2020 & 2033
- Table 27: Global Agricultural Disinfectants Industry Revenue Million Forecast, by Import Market Analysis (Value & Volume) 2020 & 2033
- Table 28: Global Agricultural Disinfectants Industry Revenue Million Forecast, by Export Market Analysis (Value & Volume) 2020 & 2033
- Table 29: Global Agricultural Disinfectants Industry Revenue Million Forecast, by Price Trend Analysis 2020 & 2033
- Table 30: Global Agricultural Disinfectants Industry Revenue Million Forecast, by Country 2020 & 2033
- Table 31: United Kingdom Agricultural Disinfectants Industry Revenue (Million) Forecast, by Application 2020 & 2033
- Table 32: Germany Agricultural Disinfectants Industry Revenue (Million) Forecast, by Application 2020 & 2033
- Table 33: France Agricultural Disinfectants Industry Revenue (Million) Forecast, by Application 2020 & 2033
- Table 34: Italy Agricultural Disinfectants Industry Revenue (Million) Forecast, by Application 2020 & 2033
- Table 35: Spain Agricultural Disinfectants Industry Revenue (Million) Forecast, by Application 2020 & 2033
- Table 36: Russia Agricultural Disinfectants Industry Revenue (Million) Forecast, by Application 2020 & 2033
- Table 37: Benelux Agricultural Disinfectants Industry Revenue (Million) Forecast, by Application 2020 & 2033
- Table 38: Nordics Agricultural Disinfectants Industry Revenue (Million) Forecast, by Application 2020 & 2033
- Table 39: Rest of Europe Agricultural Disinfectants Industry Revenue (Million) Forecast, by Application 2020 & 2033
- Table 40: Global Agricultural Disinfectants Industry Revenue Million Forecast, by Production Analysis 2020 & 2033
- Table 41: Global Agricultural Disinfectants Industry Revenue Million Forecast, by Consumption Analysis 2020 & 2033
- Table 42: Global Agricultural Disinfectants Industry Revenue Million Forecast, by Import Market Analysis (Value & Volume) 2020 & 2033
- Table 43: Global Agricultural Disinfectants Industry Revenue Million Forecast, by Export Market Analysis (Value & Volume) 2020 & 2033
- Table 44: Global Agricultural Disinfectants Industry Revenue Million Forecast, by Price Trend Analysis 2020 & 2033
- Table 45: Global Agricultural Disinfectants Industry Revenue Million Forecast, by Country 2020 & 2033
- Table 46: Turkey Agricultural Disinfectants Industry Revenue (Million) Forecast, by Application 2020 & 2033
- Table 47: Israel Agricultural Disinfectants Industry Revenue (Million) Forecast, by Application 2020 & 2033
- Table 48: GCC Agricultural Disinfectants Industry Revenue (Million) Forecast, by Application 2020 & 2033
- Table 49: North Africa Agricultural Disinfectants Industry Revenue (Million) Forecast, by Application 2020 & 2033
- Table 50: South Africa Agricultural Disinfectants Industry Revenue (Million) Forecast, by Application 2020 & 2033
- Table 51: Rest of Middle East & Africa Agricultural Disinfectants Industry Revenue (Million) Forecast, by Application 2020 & 2033
- Table 52: Global Agricultural Disinfectants Industry Revenue Million Forecast, by Production Analysis 2020 & 2033
- Table 53: Global Agricultural Disinfectants Industry Revenue Million Forecast, by Consumption Analysis 2020 & 2033
- Table 54: Global Agricultural Disinfectants Industry Revenue Million Forecast, by Import Market Analysis (Value & Volume) 2020 & 2033
- Table 55: Global Agricultural Disinfectants Industry Revenue Million Forecast, by Export Market Analysis (Value & Volume) 2020 & 2033
- Table 56: Global Agricultural Disinfectants Industry Revenue Million Forecast, by Price Trend Analysis 2020 & 2033
- Table 57: Global Agricultural Disinfectants Industry Revenue Million Forecast, by Country 2020 & 2033
- Table 58: China Agricultural Disinfectants Industry Revenue (Million) Forecast, by Application 2020 & 2033
- Table 59: India Agricultural Disinfectants Industry Revenue (Million) Forecast, by Application 2020 & 2033
- Table 60: Japan Agricultural Disinfectants Industry Revenue (Million) Forecast, by Application 2020 & 2033
- Table 61: South Korea Agricultural Disinfectants Industry Revenue (Million) Forecast, by Application 2020 & 2033
- Table 62: ASEAN Agricultural Disinfectants Industry Revenue (Million) Forecast, by Application 2020 & 2033
- Table 63: Oceania Agricultural Disinfectants Industry Revenue (Million) Forecast, by Application 2020 & 2033
- Table 64: Rest of Asia Pacific Agricultural Disinfectants Industry Revenue (Million) Forecast, by Application 2020 & 2033
Frequently Asked Questions
1. What is the projected Compound Annual Growth Rate (CAGR) of the Agricultural Disinfectants Industry?
The projected CAGR is approximately 4.30%.
2. Which companies are prominent players in the Agricultural Disinfectants Industry?
Key companies in the market include Zoetis Services LLC, Lanxess AG, Bayer Cropscience A, Entaco NV, Nufarm Limited, Corteva Agri Science, Stepan Company, Neogen Corporation, Thymox Technology, Ceva Sante Animale Group.
3. What are the main segments of the Agricultural Disinfectants Industry?
The market segments include Production Analysis, Consumption Analysis, Import Market Analysis (Value & Volume), Export Market Analysis (Value & Volume), Price Trend Analysis.
4. Can you provide details about the market size?
The market size is estimated to be USD 2.29 Million as of 2022.
5. What are some drivers contributing to market growth?
Skilled Labor Shortage; Favorable Government Policies.
6. What are the notable trends driving market growth?
Growing Area Under Protected Cultivation.
7. Are there any restraints impacting market growth?
Fragmentation of Land Holdings; Increasing Interest of Farmers Toward Custom Hiring Center.
8. Can you provide examples of recent developments in the market?
In 2021, Ceva Santé Animale Group and INRAE Technologies signed an agreement to consolidate their collaboration in animal health. This collaboration will focus on the animal, human, and environmental health. It will particularly focus on the prevention of infectious diseases of animal origin and the improvement of animal welfare.
9. What pricing options are available for accessing the report?
Pricing options include single-user, multi-user, and enterprise licenses priced at USD 4750, USD 5250, and USD 8750 respectively.
10. Is the market size provided in terms of value or volume?
The market size is provided in terms of value, measured in Million.
11. Are there any specific market keywords associated with the report?
Yes, the market keyword associated with the report is "Agricultural Disinfectants Industry," which aids in identifying and referencing the specific market segment covered.
12. How do I determine which pricing option suits my needs best?
The pricing options vary based on user requirements and access needs. Individual users may opt for single-user licenses, while businesses requiring broader access may choose multi-user or enterprise licenses for cost-effective access to the report.
13. Are there any additional resources or data provided in the Agricultural Disinfectants Industry report?
While the report offers comprehensive insights, it's advisable to review the specific contents or supplementary materials provided to ascertain if additional resources or data are available.
14. How can I stay updated on further developments or reports in the Agricultural Disinfectants Industry?
To stay informed about further developments, trends, and reports in the Agricultural Disinfectants Industry, consider subscribing to industry newsletters, following relevant companies and organizations, or regularly checking reputable industry news sources and publications.
Methodology
Step 1 - Identification of Relevant Samples Size from Population Database


Step 2 - Approaches for Defining Global Market Size (Value, Volume* & Price*)

Note*: In applicable scenarios
Step 3 - Data Sources
Primary Research
- Web Analytics
- Survey Reports
- Research Institute
- Latest Research Reports
- Opinion Leaders
Secondary Research
- Annual Reports
- White Paper
- Latest Press Release
- Industry Association
- Paid Database
- Investor Presentations

Step 4 - Data Triangulation
Involves using different sources of information in order to increase the validity of a study
These sources are likely to be stakeholders in a program - participants, other researchers, program staff, other community members, and so on.
Then we put all data in single framework & apply various statistical tools to find out the dynamic on the market.
During the analysis stage, feedback from the stakeholder groups would be compared to determine areas of agreement as well as areas of divergence