

Key Insights
The global cashew industry is poised for significant expansion, with a current market size estimated at USD 8.78 billion. This robust market is projected to grow at a Compound Annual Growth Rate (CAGR) of 4.60% through 2033. This impressive trajectory is fueled by several key drivers, including the increasing global demand for healthy snacks, the versatile applications of cashews in culinary and industrial sectors, and a rising awareness of their nutritional benefits, such as being a good source of healthy fats, protein, and minerals. Furthermore, advancements in cashew cultivation and processing technologies are contributing to improved yields and quality, making cashews more accessible and affordable worldwide. The market is also experiencing a surge in demand from emerging economies, driven by evolving dietary preferences and rising disposable incomes. This growth is further supported by the increasing popularity of plant-based diets, where cashews are a staple ingredient for creating dairy alternatives and meat substitutes.
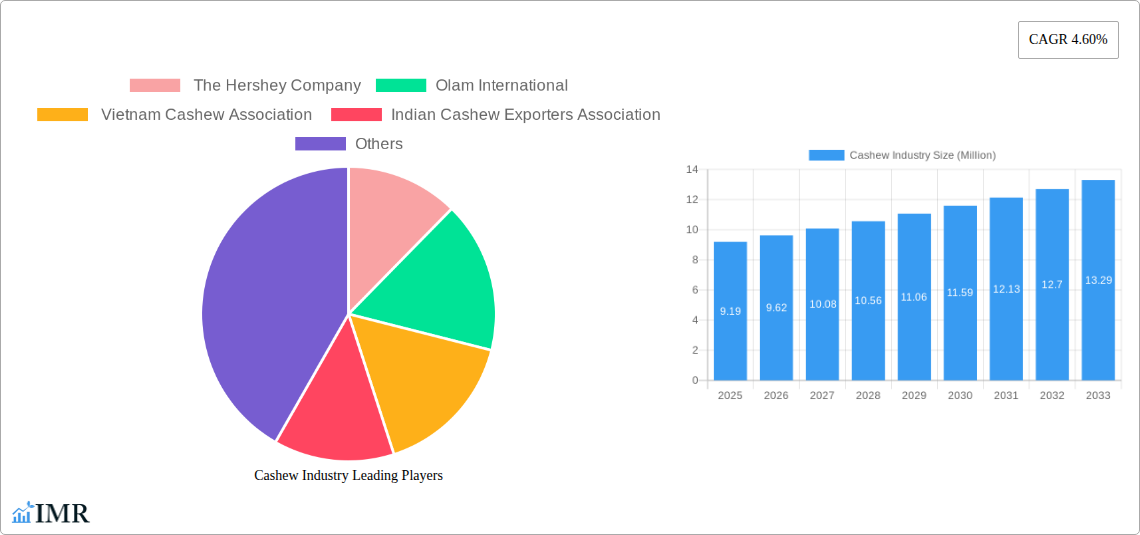
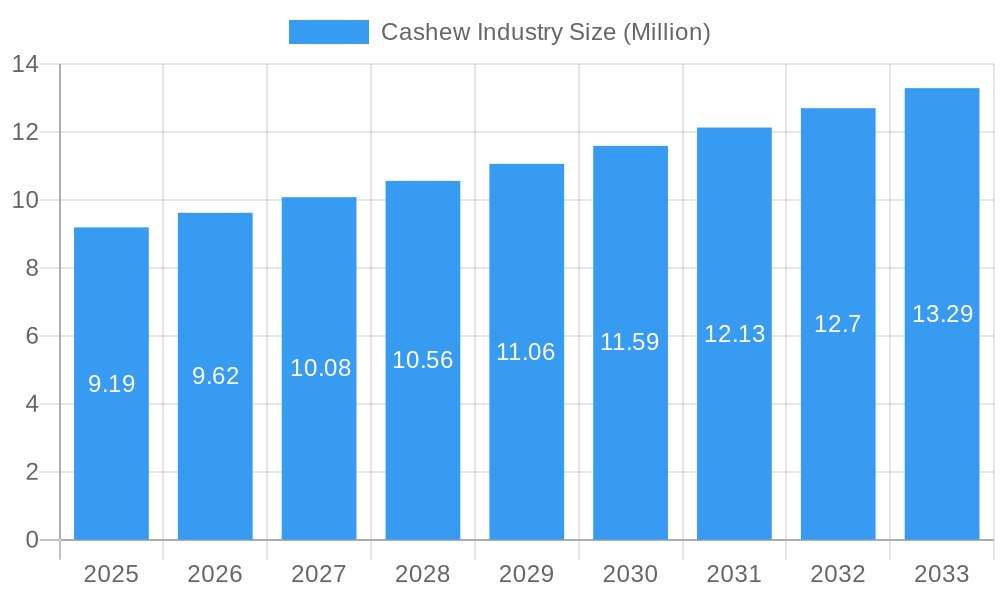
Cashew Industry Market Size (In Million)
Despite the optimistic outlook, the cashew market faces certain restraints. These include price volatility influenced by supply chain disruptions, fluctuating weather patterns impacting crop yields, and the inherent challenges associated with cashew processing, such as the caustic nature of the cashew nut shell liquid. Nonetheless, the industry is actively addressing these challenges through investments in sustainable farming practices, improved storage facilities, and innovative processing techniques to mitigate risks and enhance efficiency. Key trends shaping the market include a growing preference for value-added cashew products like roasted, salted, and flavored cashews, as well as cashew butter and milk. The Asia Pacific region, particularly India and Vietnam, continues to dominate both production and consumption, driven by established cashew industries and burgeoning domestic markets. North America and Europe represent significant consumption markets, with a strong demand for premium and organic cashew products.
Cashew Industry Company Market Share
Cashew Industry: Comprehensive Market Analysis & Future Outlook (2019-2033)
This in-depth report provides a holistic view of the global cashew industry, encompassing production, consumption, trade, pricing, and key market dynamics. It delves into parent and child markets, offering granular insights for stakeholders seeking to capitalize on growth opportunities. All values are presented in Million units.
Cashew Industry Market Dynamics & Structure
The global cashew industry is characterized by a moderately concentrated market, with key players like Olam International and The Hershey Company holding significant influence. Technological innovation is a pivotal driver, particularly in processing efficiency and developing novel cashew-based products. Regulatory frameworks, while varied across regions, are increasingly focusing on sustainable sourcing and fair trade practices. Competitive product substitutes, such as almonds and other tree nuts, pose a constant challenge, necessitating continuous product differentiation and value addition. End-user demographics are evolving, with a growing demand from health-conscious consumers and the food service sector. Merger and acquisition (M&A) trends are observed as companies seek to expand their global reach, secure supply chains, and enhance their product portfolios. For instance, recent acquisitions have focused on consolidating processing capabilities and gaining access to key raw material origins.
- Market Concentration: Moderate, with key multinational corporations and national associations influencing market direction.
- Technological Innovation: Focus on automated processing, shelling efficiency, and development of value-added products (cashew milk, butter).
- Regulatory Frameworks: Increasing emphasis on food safety standards, ethical sourcing, and sustainable agricultural practices.
- Competitive Substitutes: Almonds, walnuts, pistachios, and other edible nuts represent significant competitive pressures.
- End-User Demographics: Growing demand from health-conscious consumers, vegan populations, and the snack food industry.
- M&A Trends: Strategic acquisitions to enhance processing capacity, market access, and supply chain integration.
Cashew Industry Growth Trends & Insights
The global cashew industry is poised for robust growth, driven by an expanding consumer base seeking nutrient-rich and versatile food ingredients. The market size evolution is projected to witness a steady upward trajectory, fueled by increasing adoption rates of cashew-based products in various culinary applications, from snacks and confectionery to plant-based dairy alternatives. Technological disruptions, such as advanced processing techniques for improved kernel quality and extended shelf life, are significantly impacting market dynamics. Consumer behavior shifts, characterized by a heightened awareness of health benefits associated with cashews, including their rich content of healthy fats, proteins, and minerals, are further accelerating demand. Market penetration is expected to deepen, especially in emerging economies where disposable incomes are rising and dietary habits are diversifying. The forecast period anticipates sustained Compound Annual Growth Rates (CAGRs) as the industry innovates and adapts to evolving global food trends.
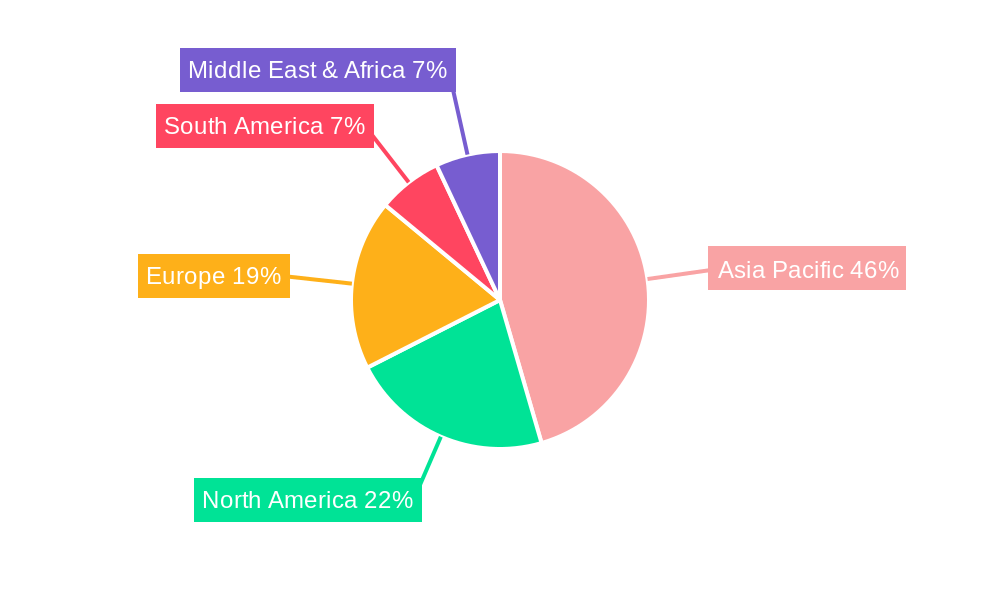
Dominant Regions, Countries, or Segments in Cashew Industry
The Export Market Analysis (Value & Volume) segment is currently a dominant force driving growth in the global cashew industry. Vietnam, a leading exporter, consistently showcases strong performance due to its established processing infrastructure and significant export volumes. The country's strategic position and extensive trade agreements facilitate the distribution of processed cashews to major consumer markets worldwide.
- Production Analysis: Vietnam and India remain at the forefront of cashew production, contributing significantly to global supply. However, production is also gaining traction in West African countries like Ivory Coast and Nigeria, supported by governmental initiatives and increased investment.
- Consumption Analysis: North America and Europe are key consumption hubs, driven by rising health consciousness and the popularity of plant-based diets. Asia-Pacific, particularly China and India, presents substantial growth potential due to a burgeoning middle class and increasing adoption of western dietary habits.
- Import Market Analysis (Value & Volume): The United States and the European Union are the largest importers of cashews, primarily for further processing and direct consumption. Vietnam's strong processing capabilities also make it a significant importer of raw cashews for re-export.
- Export Market Analysis (Value & Volume): Vietnam dominates the export market, accounting for a substantial share of global processed cashew exports. India also holds a significant position, particularly in exporting specific grades and value-added products.
- Price Trend Analysis: Fluctuations in raw cashew nut prices, influenced by weather patterns, crop yields, and global demand, directly impact the overall market. Processing costs, labor availability, and currency exchange rates also play a crucial role in price determination.
- Industry Developments: Investments in modern processing technologies, capacity expansions, and the development of new cashew-derived products are key developments shaping the industry, aiming to enhance value addition and market competitiveness.
Cashew Industry Product Landscape
The cashew product landscape is increasingly diverse, moving beyond raw and roasted kernels to encompass a wide array of value-added items. Cashew milk and cashew butter have witnessed a surge in popularity as dairy alternatives, appealing to vegan and lactose-intolerant consumers. Innovative applications include cashew-based cheeses, yogurts, and even ingredients for savory dishes. Performance metrics are assessed by kernel quality, such as uniformity of size, absence of blemishes, and flavor profile. Technological advancements in processing are enabling the creation of novel textures and functionalities, expanding the culinary potential of cashews and their unique selling propositions.
Key Drivers, Barriers & Challenges in Cashew Industry
Key Drivers: The cashew industry is propelled by increasing global demand for healthy snacks and plant-based food alternatives. Growing consumer awareness of the nutritional benefits of cashews, coupled with rising disposable incomes in emerging markets, are significant drivers. Technological advancements in processing and packaging further enhance market appeal. Strategic partnerships and investments in sustainable farming practices also contribute to growth.
Barriers & Challenges: Supply chain disruptions, including fluctuating raw cashew availability due to weather conditions and disease outbreaks, pose a major challenge. Volatile pricing of raw materials, coupled with labor shortages in processing facilities, impacts profitability. Stringent food safety regulations and trade policies in different countries can also create barriers to entry and market access. Intense competition from other nuts and alternative snack options further pressures market players.
Emerging Opportunities in Cashew Industry
Emerging opportunities in the cashew industry lie in the growing demand for functional foods and personalized nutrition. Untapped markets in Africa and parts of Asia present significant potential for both production expansion and market penetration. Innovative applications, such as cashew-based ingredients for the pharmaceutical and cosmetic industries, are gaining traction. Evolving consumer preferences for convenience and ready-to-eat cashew products, including flavored and seasoned variants, offer avenues for product development. The development of more sustainable and ethical sourcing certifications will also attract environmentally conscious consumers and premium market segments.
Growth Accelerators in the Cashew Industry Industry
Technological breakthroughs in post-harvest management and processing are key growth accelerators, enabling higher yields and improved kernel quality. Strategic partnerships between producing nations and importing countries can foster more stable supply chains and predictable pricing. Market expansion strategies focusing on educating consumers about the health benefits and versatility of cashews will further drive demand. Investment in research and development to create new cashew-based products and applications, catering to evolving dietary trends, will also fuel long-term growth. Furthermore, initiatives promoting direct trade and fair pricing for farmers can lead to increased and more consistent production.
Key Players Shaping the Cashew Industry Market
- The Hershey Company
- Olam International
- Vietnam Cashew Association
- Indian Cashew Exporters Association
Notable Milestones in Cashew Industry Sector
- 2020: Increased investment in automated cashew processing technologies to improve efficiency and reduce labor dependency.
- 2021: Launch of new cashew milk and cashew-based cheese alternatives by major food manufacturers, reflecting growing demand for plant-based products.
- 2022: Vietnam Cashew Association and Indian Cashew Exporters Association collaborating on harmonizing quality standards and promoting sustainable practices.
- 2023: Olam International expanding its cashew processing facilities in Africa to enhance local value addition and secure supply chains.
- 2024 (Estimated): Emergence of new insect-resistant cashew varieties to mitigate crop losses in key producing regions.
In-Depth Cashew Industry Market Outlook
The future outlook for the cashew industry is exceptionally promising, driven by a confluence of escalating global demand for healthy, plant-based food products, and continuous innovation. Growth accelerators such as advancements in processing technologies, strategic international collaborations, and targeted market expansion initiatives will solidify its upward trajectory. Future market potential is immense, particularly in leveraging untapped consumer bases in emerging economies and diversifying product applications beyond traditional food items. Strategic opportunities lie in embracing sustainable sourcing practices, enhancing supply chain resilience, and developing premium, value-added cashew products that cater to sophisticated consumer tastes and health-conscious trends.
Cashew Industry Segmentation
- 1. Production Analysis
- 2. Consumption Analysis
- 3. Import Market Analysis (Value & Volume)
- 4. Export Market Analysis (Value & Volume)
- 5. Price Trend Analysis
Cashew Industry Segmentation By Geography
-
1. North America
- 1.1. United States
- 1.2. Canada
- 1.3. Mexico
-
2. South America
- 2.1. Brazil
- 2.2. Argentina
- 2.3. Rest of South America
-
3. Europe
- 3.1. United Kingdom
- 3.2. Germany
- 3.3. France
- 3.4. Italy
- 3.5. Spain
- 3.6. Russia
- 3.7. Benelux
- 3.8. Nordics
- 3.9. Rest of Europe
-
4. Middle East & Africa
- 4.1. Turkey
- 4.2. Israel
- 4.3. GCC
- 4.4. North Africa
- 4.5. South Africa
- 4.6. Rest of Middle East & Africa
-
5. Asia Pacific
- 5.1. China
- 5.2. India
- 5.3. Japan
- 5.4. South Korea
- 5.5. ASEAN
- 5.6. Oceania
- 5.7. Rest of Asia Pacific
Cashew Industry Regional Market Share
Geographic Coverage of Cashew Industry
Cashew Industry REPORT HIGHLIGHTS
| Aspects | Details |
|---|---|
| Study Period | 2020-2034 |
| Base Year | 2025 |
| Estimated Year | 2026 |
| Forecast Period | 2026-2034 |
| Historical Period | 2020-2025 |
| Growth Rate | CAGR of 4.60% from 2020-2034 |
| Segmentation |
|
Table of Contents
- 1. Introduction
- 1.1. Research Scope
- 1.2. Market Segmentation
- 1.3. Research Objective
- 1.4. Definitions and Assumptions
- 2. Executive Summary
- 2.1. Market Snapshot
- 3. Market Dynamics
- 3.1. Market Drivers
- 3.2. Market Restrains
- 3.3. Market Trends
- 3.4. Market Opportunities
- 4. Market Factor Analysis
- 4.1. Porters Five Forces
- 4.1.1. Bargaining Power of Suppliers
- 4.1.2. Bargaining Power of Buyers
- 4.1.3. Threat of New Entrants
- 4.1.4. Threat of Substitutes
- 4.1.5. Competitive Rivalry
- 4.2. PESTEL analysis
- 4.3. BCG Analysis
- 4.3.1. Stars (High Growth, High Market Share)
- 4.3.2. Cash Cows (Low Growth, High Market Share)
- 4.3.3. Question Mark (High Growth, Low Market Share)
- 4.3.4. Dogs (Low Growth, Low Market Share)
- 4.4. Ansoff Matrix Analysis
- 4.5. Supply Chain Analysis
- 4.6. Regulatory Landscape
- 4.7. Current Market Potential and Opportunity Assessment (TAM–SAM–SOM Framework)
- 4.8. IMR Analyst Note
- 4.1. Porters Five Forces
- 5. Market Analysis, Insights and Forecast 2021-2033
- 5.1. Market Analysis, Insights and Forecast - by Production Analysis
- 5.2. Market Analysis, Insights and Forecast - by Consumption Analysis
- 5.3. Market Analysis, Insights and Forecast - by Import Market Analysis (Value & Volume)
- 5.4. Market Analysis, Insights and Forecast - by Export Market Analysis (Value & Volume)
- 5.5. Market Analysis, Insights and Forecast - by Price Trend Analysis
- 5.6. Market Analysis, Insights and Forecast - by Region
- 5.6.1. North America
- 5.6.2. South America
- 5.6.3. Europe
- 5.6.4. Middle East & Africa
- 5.6.5. Asia Pacific
- 6. Global Cashew Industry Analysis, Insights and Forecast, 2021-2033
- 6.1. Market Analysis, Insights and Forecast - by Production Analysis
- 6.2. Market Analysis, Insights and Forecast - by Consumption Analysis
- 6.3. Market Analysis, Insights and Forecast - by Import Market Analysis (Value & Volume)
- 6.4. Market Analysis, Insights and Forecast - by Export Market Analysis (Value & Volume)
- 6.5. Market Analysis, Insights and Forecast - by Price Trend Analysis
- 7. North America Cashew Industry Analysis, Insights and Forecast, 2020-2032
- 7.1. Market Analysis, Insights and Forecast - by Production Analysis
- 7.2. Market Analysis, Insights and Forecast - by Consumption Analysis
- 7.3. Market Analysis, Insights and Forecast - by Import Market Analysis (Value & Volume)
- 7.4. Market Analysis, Insights and Forecast - by Export Market Analysis (Value & Volume)
- 7.5. Market Analysis, Insights and Forecast - by Price Trend Analysis
- 8. South America Cashew Industry Analysis, Insights and Forecast, 2020-2032
- 8.1. Market Analysis, Insights and Forecast - by Production Analysis
- 8.2. Market Analysis, Insights and Forecast - by Consumption Analysis
- 8.3. Market Analysis, Insights and Forecast - by Import Market Analysis (Value & Volume)
- 8.4. Market Analysis, Insights and Forecast - by Export Market Analysis (Value & Volume)
- 8.5. Market Analysis, Insights and Forecast - by Price Trend Analysis
- 9. Europe Cashew Industry Analysis, Insights and Forecast, 2020-2032
- 9.1. Market Analysis, Insights and Forecast - by Production Analysis
- 9.2. Market Analysis, Insights and Forecast - by Consumption Analysis
- 9.3. Market Analysis, Insights and Forecast - by Import Market Analysis (Value & Volume)
- 9.4. Market Analysis, Insights and Forecast - by Export Market Analysis (Value & Volume)
- 9.5. Market Analysis, Insights and Forecast - by Price Trend Analysis
- 10. Middle East & Africa Cashew Industry Analysis, Insights and Forecast, 2020-2032
- 10.1. Market Analysis, Insights and Forecast - by Production Analysis
- 10.2. Market Analysis, Insights and Forecast - by Consumption Analysis
- 10.3. Market Analysis, Insights and Forecast - by Import Market Analysis (Value & Volume)
- 10.4. Market Analysis, Insights and Forecast - by Export Market Analysis (Value & Volume)
- 10.5. Market Analysis, Insights and Forecast - by Price Trend Analysis
- 11. Asia Pacific Cashew Industry Analysis, Insights and Forecast, 2020-2032
- 11.1. Market Analysis, Insights and Forecast - by Production Analysis
- 11.2. Market Analysis, Insights and Forecast - by Consumption Analysis
- 11.3. Market Analysis, Insights and Forecast - by Import Market Analysis (Value & Volume)
- 11.4. Market Analysis, Insights and Forecast - by Export Market Analysis (Value & Volume)
- 11.5. Market Analysis, Insights and Forecast - by Price Trend Analysis
- 12. Competitive Analysis
- 12.1. Company Profiles
- 12.1.1 The Hershey Company
- 12.1.1.1. Company Overview
- 12.1.1.2. Products
- 12.1.1.3. Company Financials
- 12.1.1.4. SWOT Analysis
- 12.1.2 Olam International
- 12.1.2.1. Company Overview
- 12.1.2.2. Products
- 12.1.2.3. Company Financials
- 12.1.2.4. SWOT Analysis
- 12.1.3 Vietnam Cashew Association
- 12.1.3.1. Company Overview
- 12.1.3.2. Products
- 12.1.3.3. Company Financials
- 12.1.3.4. SWOT Analysis
- 12.1.4 Indian Cashew Exporters Association
- 12.1.4.1. Company Overview
- 12.1.4.2. Products
- 12.1.4.3. Company Financials
- 12.1.4.4. SWOT Analysis
- 12.1.1 The Hershey Company
- 12.2. Market Entropy
- 12.2.1 Company's Key Areas Served
- 12.2.2 Recent Developments
- 12.3. Company Market Share Analysis 2025
- 12.3.1 Top 5 Companies Market Share Analysis
- 12.3.2 Top 3 Companies Market Share Analysis
- 12.4. List of Potential Customers
- 13. Research Methodology
List of Figures
- Figure 1: Global Cashew Industry Revenue Breakdown (Million, %) by Region 2025 & 2033
- Figure 2: Global Cashew Industry Volume Breakdown (Metric Tons, %) by Region 2025 & 2033
- Figure 3: North America Cashew Industry Revenue (Million), by Production Analysis 2025 & 2033
- Figure 4: North America Cashew Industry Volume (Metric Tons), by Production Analysis 2025 & 2033
- Figure 5: North America Cashew Industry Revenue Share (%), by Production Analysis 2025 & 2033
- Figure 6: North America Cashew Industry Volume Share (%), by Production Analysis 2025 & 2033
- Figure 7: North America Cashew Industry Revenue (Million), by Consumption Analysis 2025 & 2033
- Figure 8: North America Cashew Industry Volume (Metric Tons), by Consumption Analysis 2025 & 2033
- Figure 9: North America Cashew Industry Revenue Share (%), by Consumption Analysis 2025 & 2033
- Figure 10: North America Cashew Industry Volume Share (%), by Consumption Analysis 2025 & 2033
- Figure 11: North America Cashew Industry Revenue (Million), by Import Market Analysis (Value & Volume) 2025 & 2033
- Figure 12: North America Cashew Industry Volume (Metric Tons), by Import Market Analysis (Value & Volume) 2025 & 2033
- Figure 13: North America Cashew Industry Revenue Share (%), by Import Market Analysis (Value & Volume) 2025 & 2033
- Figure 14: North America Cashew Industry Volume Share (%), by Import Market Analysis (Value & Volume) 2025 & 2033
- Figure 15: North America Cashew Industry Revenue (Million), by Export Market Analysis (Value & Volume) 2025 & 2033
- Figure 16: North America Cashew Industry Volume (Metric Tons), by Export Market Analysis (Value & Volume) 2025 & 2033
- Figure 17: North America Cashew Industry Revenue Share (%), by Export Market Analysis (Value & Volume) 2025 & 2033
- Figure 18: North America Cashew Industry Volume Share (%), by Export Market Analysis (Value & Volume) 2025 & 2033
- Figure 19: North America Cashew Industry Revenue (Million), by Price Trend Analysis 2025 & 2033
- Figure 20: North America Cashew Industry Volume (Metric Tons), by Price Trend Analysis 2025 & 2033
- Figure 21: North America Cashew Industry Revenue Share (%), by Price Trend Analysis 2025 & 2033
- Figure 22: North America Cashew Industry Volume Share (%), by Price Trend Analysis 2025 & 2033
- Figure 23: North America Cashew Industry Revenue (Million), by Country 2025 & 2033
- Figure 24: North America Cashew Industry Volume (Metric Tons), by Country 2025 & 2033
- Figure 25: North America Cashew Industry Revenue Share (%), by Country 2025 & 2033
- Figure 26: North America Cashew Industry Volume Share (%), by Country 2025 & 2033
- Figure 27: South America Cashew Industry Revenue (Million), by Production Analysis 2025 & 2033
- Figure 28: South America Cashew Industry Volume (Metric Tons), by Production Analysis 2025 & 2033
- Figure 29: South America Cashew Industry Revenue Share (%), by Production Analysis 2025 & 2033
- Figure 30: South America Cashew Industry Volume Share (%), by Production Analysis 2025 & 2033
- Figure 31: South America Cashew Industry Revenue (Million), by Consumption Analysis 2025 & 2033
- Figure 32: South America Cashew Industry Volume (Metric Tons), by Consumption Analysis 2025 & 2033
- Figure 33: South America Cashew Industry Revenue Share (%), by Consumption Analysis 2025 & 2033
- Figure 34: South America Cashew Industry Volume Share (%), by Consumption Analysis 2025 & 2033
- Figure 35: South America Cashew Industry Revenue (Million), by Import Market Analysis (Value & Volume) 2025 & 2033
- Figure 36: South America Cashew Industry Volume (Metric Tons), by Import Market Analysis (Value & Volume) 2025 & 2033
- Figure 37: South America Cashew Industry Revenue Share (%), by Import Market Analysis (Value & Volume) 2025 & 2033
- Figure 38: South America Cashew Industry Volume Share (%), by Import Market Analysis (Value & Volume) 2025 & 2033
- Figure 39: South America Cashew Industry Revenue (Million), by Export Market Analysis (Value & Volume) 2025 & 2033
- Figure 40: South America Cashew Industry Volume (Metric Tons), by Export Market Analysis (Value & Volume) 2025 & 2033
- Figure 41: South America Cashew Industry Revenue Share (%), by Export Market Analysis (Value & Volume) 2025 & 2033
- Figure 42: South America Cashew Industry Volume Share (%), by Export Market Analysis (Value & Volume) 2025 & 2033
- Figure 43: South America Cashew Industry Revenue (Million), by Price Trend Analysis 2025 & 2033
- Figure 44: South America Cashew Industry Volume (Metric Tons), by Price Trend Analysis 2025 & 2033
- Figure 45: South America Cashew Industry Revenue Share (%), by Price Trend Analysis 2025 & 2033
- Figure 46: South America Cashew Industry Volume Share (%), by Price Trend Analysis 2025 & 2033
- Figure 47: South America Cashew Industry Revenue (Million), by Country 2025 & 2033
- Figure 48: South America Cashew Industry Volume (Metric Tons), by Country 2025 & 2033
- Figure 49: South America Cashew Industry Revenue Share (%), by Country 2025 & 2033
- Figure 50: South America Cashew Industry Volume Share (%), by Country 2025 & 2033
- Figure 51: Europe Cashew Industry Revenue (Million), by Production Analysis 2025 & 2033
- Figure 52: Europe Cashew Industry Volume (Metric Tons), by Production Analysis 2025 & 2033
- Figure 53: Europe Cashew Industry Revenue Share (%), by Production Analysis 2025 & 2033
- Figure 54: Europe Cashew Industry Volume Share (%), by Production Analysis 2025 & 2033
- Figure 55: Europe Cashew Industry Revenue (Million), by Consumption Analysis 2025 & 2033
- Figure 56: Europe Cashew Industry Volume (Metric Tons), by Consumption Analysis 2025 & 2033
- Figure 57: Europe Cashew Industry Revenue Share (%), by Consumption Analysis 2025 & 2033
- Figure 58: Europe Cashew Industry Volume Share (%), by Consumption Analysis 2025 & 2033
- Figure 59: Europe Cashew Industry Revenue (Million), by Import Market Analysis (Value & Volume) 2025 & 2033
- Figure 60: Europe Cashew Industry Volume (Metric Tons), by Import Market Analysis (Value & Volume) 2025 & 2033
- Figure 61: Europe Cashew Industry Revenue Share (%), by Import Market Analysis (Value & Volume) 2025 & 2033
- Figure 62: Europe Cashew Industry Volume Share (%), by Import Market Analysis (Value & Volume) 2025 & 2033
- Figure 63: Europe Cashew Industry Revenue (Million), by Export Market Analysis (Value & Volume) 2025 & 2033
- Figure 64: Europe Cashew Industry Volume (Metric Tons), by Export Market Analysis (Value & Volume) 2025 & 2033
- Figure 65: Europe Cashew Industry Revenue Share (%), by Export Market Analysis (Value & Volume) 2025 & 2033
- Figure 66: Europe Cashew Industry Volume Share (%), by Export Market Analysis (Value & Volume) 2025 & 2033
- Figure 67: Europe Cashew Industry Revenue (Million), by Price Trend Analysis 2025 & 2033
- Figure 68: Europe Cashew Industry Volume (Metric Tons), by Price Trend Analysis 2025 & 2033
- Figure 69: Europe Cashew Industry Revenue Share (%), by Price Trend Analysis 2025 & 2033
- Figure 70: Europe Cashew Industry Volume Share (%), by Price Trend Analysis 2025 & 2033
- Figure 71: Europe Cashew Industry Revenue (Million), by Country 2025 & 2033
- Figure 72: Europe Cashew Industry Volume (Metric Tons), by Country 2025 & 2033
- Figure 73: Europe Cashew Industry Revenue Share (%), by Country 2025 & 2033
- Figure 74: Europe Cashew Industry Volume Share (%), by Country 2025 & 2033
- Figure 75: Middle East & Africa Cashew Industry Revenue (Million), by Production Analysis 2025 & 2033
- Figure 76: Middle East & Africa Cashew Industry Volume (Metric Tons), by Production Analysis 2025 & 2033
- Figure 77: Middle East & Africa Cashew Industry Revenue Share (%), by Production Analysis 2025 & 2033
- Figure 78: Middle East & Africa Cashew Industry Volume Share (%), by Production Analysis 2025 & 2033
- Figure 79: Middle East & Africa Cashew Industry Revenue (Million), by Consumption Analysis 2025 & 2033
- Figure 80: Middle East & Africa Cashew Industry Volume (Metric Tons), by Consumption Analysis 2025 & 2033
- Figure 81: Middle East & Africa Cashew Industry Revenue Share (%), by Consumption Analysis 2025 & 2033
- Figure 82: Middle East & Africa Cashew Industry Volume Share (%), by Consumption Analysis 2025 & 2033
- Figure 83: Middle East & Africa Cashew Industry Revenue (Million), by Import Market Analysis (Value & Volume) 2025 & 2033
- Figure 84: Middle East & Africa Cashew Industry Volume (Metric Tons), by Import Market Analysis (Value & Volume) 2025 & 2033
- Figure 85: Middle East & Africa Cashew Industry Revenue Share (%), by Import Market Analysis (Value & Volume) 2025 & 2033
- Figure 86: Middle East & Africa Cashew Industry Volume Share (%), by Import Market Analysis (Value & Volume) 2025 & 2033
- Figure 87: Middle East & Africa Cashew Industry Revenue (Million), by Export Market Analysis (Value & Volume) 2025 & 2033
- Figure 88: Middle East & Africa Cashew Industry Volume (Metric Tons), by Export Market Analysis (Value & Volume) 2025 & 2033
- Figure 89: Middle East & Africa Cashew Industry Revenue Share (%), by Export Market Analysis (Value & Volume) 2025 & 2033
- Figure 90: Middle East & Africa Cashew Industry Volume Share (%), by Export Market Analysis (Value & Volume) 2025 & 2033
- Figure 91: Middle East & Africa Cashew Industry Revenue (Million), by Price Trend Analysis 2025 & 2033
- Figure 92: Middle East & Africa Cashew Industry Volume (Metric Tons), by Price Trend Analysis 2025 & 2033
- Figure 93: Middle East & Africa Cashew Industry Revenue Share (%), by Price Trend Analysis 2025 & 2033
- Figure 94: Middle East & Africa Cashew Industry Volume Share (%), by Price Trend Analysis 2025 & 2033
- Figure 95: Middle East & Africa Cashew Industry Revenue (Million), by Country 2025 & 2033
- Figure 96: Middle East & Africa Cashew Industry Volume (Metric Tons), by Country 2025 & 2033
- Figure 97: Middle East & Africa Cashew Industry Revenue Share (%), by Country 2025 & 2033
- Figure 98: Middle East & Africa Cashew Industry Volume Share (%), by Country 2025 & 2033
- Figure 99: Asia Pacific Cashew Industry Revenue (Million), by Production Analysis 2025 & 2033
- Figure 100: Asia Pacific Cashew Industry Volume (Metric Tons), by Production Analysis 2025 & 2033
- Figure 101: Asia Pacific Cashew Industry Revenue Share (%), by Production Analysis 2025 & 2033
- Figure 102: Asia Pacific Cashew Industry Volume Share (%), by Production Analysis 2025 & 2033
- Figure 103: Asia Pacific Cashew Industry Revenue (Million), by Consumption Analysis 2025 & 2033
- Figure 104: Asia Pacific Cashew Industry Volume (Metric Tons), by Consumption Analysis 2025 & 2033
- Figure 105: Asia Pacific Cashew Industry Revenue Share (%), by Consumption Analysis 2025 & 2033
- Figure 106: Asia Pacific Cashew Industry Volume Share (%), by Consumption Analysis 2025 & 2033
- Figure 107: Asia Pacific Cashew Industry Revenue (Million), by Import Market Analysis (Value & Volume) 2025 & 2033
- Figure 108: Asia Pacific Cashew Industry Volume (Metric Tons), by Import Market Analysis (Value & Volume) 2025 & 2033
- Figure 109: Asia Pacific Cashew Industry Revenue Share (%), by Import Market Analysis (Value & Volume) 2025 & 2033
- Figure 110: Asia Pacific Cashew Industry Volume Share (%), by Import Market Analysis (Value & Volume) 2025 & 2033
- Figure 111: Asia Pacific Cashew Industry Revenue (Million), by Export Market Analysis (Value & Volume) 2025 & 2033
- Figure 112: Asia Pacific Cashew Industry Volume (Metric Tons), by Export Market Analysis (Value & Volume) 2025 & 2033
- Figure 113: Asia Pacific Cashew Industry Revenue Share (%), by Export Market Analysis (Value & Volume) 2025 & 2033
- Figure 114: Asia Pacific Cashew Industry Volume Share (%), by Export Market Analysis (Value & Volume) 2025 & 2033
- Figure 115: Asia Pacific Cashew Industry Revenue (Million), by Price Trend Analysis 2025 & 2033
- Figure 116: Asia Pacific Cashew Industry Volume (Metric Tons), by Price Trend Analysis 2025 & 2033
- Figure 117: Asia Pacific Cashew Industry Revenue Share (%), by Price Trend Analysis 2025 & 2033
- Figure 118: Asia Pacific Cashew Industry Volume Share (%), by Price Trend Analysis 2025 & 2033
- Figure 119: Asia Pacific Cashew Industry Revenue (Million), by Country 2025 & 2033
- Figure 120: Asia Pacific Cashew Industry Volume (Metric Tons), by Country 2025 & 2033
- Figure 121: Asia Pacific Cashew Industry Revenue Share (%), by Country 2025 & 2033
- Figure 122: Asia Pacific Cashew Industry Volume Share (%), by Country 2025 & 2033
List of Tables
- Table 1: Global Cashew Industry Revenue Million Forecast, by Production Analysis 2020 & 2033
- Table 2: Global Cashew Industry Volume Metric Tons Forecast, by Production Analysis 2020 & 2033
- Table 3: Global Cashew Industry Revenue Million Forecast, by Consumption Analysis 2020 & 2033
- Table 4: Global Cashew Industry Volume Metric Tons Forecast, by Consumption Analysis 2020 & 2033
- Table 5: Global Cashew Industry Revenue Million Forecast, by Import Market Analysis (Value & Volume) 2020 & 2033
- Table 6: Global Cashew Industry Volume Metric Tons Forecast, by Import Market Analysis (Value & Volume) 2020 & 2033
- Table 7: Global Cashew Industry Revenue Million Forecast, by Export Market Analysis (Value & Volume) 2020 & 2033
- Table 8: Global Cashew Industry Volume Metric Tons Forecast, by Export Market Analysis (Value & Volume) 2020 & 2033
- Table 9: Global Cashew Industry Revenue Million Forecast, by Price Trend Analysis 2020 & 2033
- Table 10: Global Cashew Industry Volume Metric Tons Forecast, by Price Trend Analysis 2020 & 2033
- Table 11: Global Cashew Industry Revenue Million Forecast, by Region 2020 & 2033
- Table 12: Global Cashew Industry Volume Metric Tons Forecast, by Region 2020 & 2033
- Table 13: Global Cashew Industry Revenue Million Forecast, by Production Analysis 2020 & 2033
- Table 14: Global Cashew Industry Volume Metric Tons Forecast, by Production Analysis 2020 & 2033
- Table 15: Global Cashew Industry Revenue Million Forecast, by Consumption Analysis 2020 & 2033
- Table 16: Global Cashew Industry Volume Metric Tons Forecast, by Consumption Analysis 2020 & 2033
- Table 17: Global Cashew Industry Revenue Million Forecast, by Import Market Analysis (Value & Volume) 2020 & 2033
- Table 18: Global Cashew Industry Volume Metric Tons Forecast, by Import Market Analysis (Value & Volume) 2020 & 2033
- Table 19: Global Cashew Industry Revenue Million Forecast, by Export Market Analysis (Value & Volume) 2020 & 2033
- Table 20: Global Cashew Industry Volume Metric Tons Forecast, by Export Market Analysis (Value & Volume) 2020 & 2033
- Table 21: Global Cashew Industry Revenue Million Forecast, by Price Trend Analysis 2020 & 2033
- Table 22: Global Cashew Industry Volume Metric Tons Forecast, by Price Trend Analysis 2020 & 2033
- Table 23: Global Cashew Industry Revenue Million Forecast, by Country 2020 & 2033
- Table 24: Global Cashew Industry Volume Metric Tons Forecast, by Country 2020 & 2033
- Table 25: United States Cashew Industry Revenue (Million) Forecast, by Application 2020 & 2033
- Table 26: United States Cashew Industry Volume (Metric Tons) Forecast, by Application 2020 & 2033
- Table 27: Canada Cashew Industry Revenue (Million) Forecast, by Application 2020 & 2033
- Table 28: Canada Cashew Industry Volume (Metric Tons) Forecast, by Application 2020 & 2033
- Table 29: Mexico Cashew Industry Revenue (Million) Forecast, by Application 2020 & 2033
- Table 30: Mexico Cashew Industry Volume (Metric Tons) Forecast, by Application 2020 & 2033
- Table 31: Global Cashew Industry Revenue Million Forecast, by Production Analysis 2020 & 2033
- Table 32: Global Cashew Industry Volume Metric Tons Forecast, by Production Analysis 2020 & 2033
- Table 33: Global Cashew Industry Revenue Million Forecast, by Consumption Analysis 2020 & 2033
- Table 34: Global Cashew Industry Volume Metric Tons Forecast, by Consumption Analysis 2020 & 2033
- Table 35: Global Cashew Industry Revenue Million Forecast, by Import Market Analysis (Value & Volume) 2020 & 2033
- Table 36: Global Cashew Industry Volume Metric Tons Forecast, by Import Market Analysis (Value & Volume) 2020 & 2033
- Table 37: Global Cashew Industry Revenue Million Forecast, by Export Market Analysis (Value & Volume) 2020 & 2033
- Table 38: Global Cashew Industry Volume Metric Tons Forecast, by Export Market Analysis (Value & Volume) 2020 & 2033
- Table 39: Global Cashew Industry Revenue Million Forecast, by Price Trend Analysis 2020 & 2033
- Table 40: Global Cashew Industry Volume Metric Tons Forecast, by Price Trend Analysis 2020 & 2033
- Table 41: Global Cashew Industry Revenue Million Forecast, by Country 2020 & 2033
- Table 42: Global Cashew Industry Volume Metric Tons Forecast, by Country 2020 & 2033
- Table 43: Brazil Cashew Industry Revenue (Million) Forecast, by Application 2020 & 2033
- Table 44: Brazil Cashew Industry Volume (Metric Tons) Forecast, by Application 2020 & 2033
- Table 45: Argentina Cashew Industry Revenue (Million) Forecast, by Application 2020 & 2033
- Table 46: Argentina Cashew Industry Volume (Metric Tons) Forecast, by Application 2020 & 2033
- Table 47: Rest of South America Cashew Industry Revenue (Million) Forecast, by Application 2020 & 2033
- Table 48: Rest of South America Cashew Industry Volume (Metric Tons) Forecast, by Application 2020 & 2033
- Table 49: Global Cashew Industry Revenue Million Forecast, by Production Analysis 2020 & 2033
- Table 50: Global Cashew Industry Volume Metric Tons Forecast, by Production Analysis 2020 & 2033
- Table 51: Global Cashew Industry Revenue Million Forecast, by Consumption Analysis 2020 & 2033
- Table 52: Global Cashew Industry Volume Metric Tons Forecast, by Consumption Analysis 2020 & 2033
- Table 53: Global Cashew Industry Revenue Million Forecast, by Import Market Analysis (Value & Volume) 2020 & 2033
- Table 54: Global Cashew Industry Volume Metric Tons Forecast, by Import Market Analysis (Value & Volume) 2020 & 2033
- Table 55: Global Cashew Industry Revenue Million Forecast, by Export Market Analysis (Value & Volume) 2020 & 2033
- Table 56: Global Cashew Industry Volume Metric Tons Forecast, by Export Market Analysis (Value & Volume) 2020 & 2033
- Table 57: Global Cashew Industry Revenue Million Forecast, by Price Trend Analysis 2020 & 2033
- Table 58: Global Cashew Industry Volume Metric Tons Forecast, by Price Trend Analysis 2020 & 2033
- Table 59: Global Cashew Industry Revenue Million Forecast, by Country 2020 & 2033
- Table 60: Global Cashew Industry Volume Metric Tons Forecast, by Country 2020 & 2033
- Table 61: United Kingdom Cashew Industry Revenue (Million) Forecast, by Application 2020 & 2033
- Table 62: United Kingdom Cashew Industry Volume (Metric Tons) Forecast, by Application 2020 & 2033
- Table 63: Germany Cashew Industry Revenue (Million) Forecast, by Application 2020 & 2033
- Table 64: Germany Cashew Industry Volume (Metric Tons) Forecast, by Application 2020 & 2033
- Table 65: France Cashew Industry Revenue (Million) Forecast, by Application 2020 & 2033
- Table 66: France Cashew Industry Volume (Metric Tons) Forecast, by Application 2020 & 2033
- Table 67: Italy Cashew Industry Revenue (Million) Forecast, by Application 2020 & 2033
- Table 68: Italy Cashew Industry Volume (Metric Tons) Forecast, by Application 2020 & 2033
- Table 69: Spain Cashew Industry Revenue (Million) Forecast, by Application 2020 & 2033
- Table 70: Spain Cashew Industry Volume (Metric Tons) Forecast, by Application 2020 & 2033
- Table 71: Russia Cashew Industry Revenue (Million) Forecast, by Application 2020 & 2033
- Table 72: Russia Cashew Industry Volume (Metric Tons) Forecast, by Application 2020 & 2033
- Table 73: Benelux Cashew Industry Revenue (Million) Forecast, by Application 2020 & 2033
- Table 74: Benelux Cashew Industry Volume (Metric Tons) Forecast, by Application 2020 & 2033
- Table 75: Nordics Cashew Industry Revenue (Million) Forecast, by Application 2020 & 2033
- Table 76: Nordics Cashew Industry Volume (Metric Tons) Forecast, by Application 2020 & 2033
- Table 77: Rest of Europe Cashew Industry Revenue (Million) Forecast, by Application 2020 & 2033
- Table 78: Rest of Europe Cashew Industry Volume (Metric Tons) Forecast, by Application 2020 & 2033
- Table 79: Global Cashew Industry Revenue Million Forecast, by Production Analysis 2020 & 2033
- Table 80: Global Cashew Industry Volume Metric Tons Forecast, by Production Analysis 2020 & 2033
- Table 81: Global Cashew Industry Revenue Million Forecast, by Consumption Analysis 2020 & 2033
- Table 82: Global Cashew Industry Volume Metric Tons Forecast, by Consumption Analysis 2020 & 2033
- Table 83: Global Cashew Industry Revenue Million Forecast, by Import Market Analysis (Value & Volume) 2020 & 2033
- Table 84: Global Cashew Industry Volume Metric Tons Forecast, by Import Market Analysis (Value & Volume) 2020 & 2033
- Table 85: Global Cashew Industry Revenue Million Forecast, by Export Market Analysis (Value & Volume) 2020 & 2033
- Table 86: Global Cashew Industry Volume Metric Tons Forecast, by Export Market Analysis (Value & Volume) 2020 & 2033
- Table 87: Global Cashew Industry Revenue Million Forecast, by Price Trend Analysis 2020 & 2033
- Table 88: Global Cashew Industry Volume Metric Tons Forecast, by Price Trend Analysis 2020 & 2033
- Table 89: Global Cashew Industry Revenue Million Forecast, by Country 2020 & 2033
- Table 90: Global Cashew Industry Volume Metric Tons Forecast, by Country 2020 & 2033
- Table 91: Turkey Cashew Industry Revenue (Million) Forecast, by Application 2020 & 2033
- Table 92: Turkey Cashew Industry Volume (Metric Tons) Forecast, by Application 2020 & 2033
- Table 93: Israel Cashew Industry Revenue (Million) Forecast, by Application 2020 & 2033
- Table 94: Israel Cashew Industry Volume (Metric Tons) Forecast, by Application 2020 & 2033
- Table 95: GCC Cashew Industry Revenue (Million) Forecast, by Application 2020 & 2033
- Table 96: GCC Cashew Industry Volume (Metric Tons) Forecast, by Application 2020 & 2033
- Table 97: North Africa Cashew Industry Revenue (Million) Forecast, by Application 2020 & 2033
- Table 98: North Africa Cashew Industry Volume (Metric Tons) Forecast, by Application 2020 & 2033
- Table 99: South Africa Cashew Industry Revenue (Million) Forecast, by Application 2020 & 2033
- Table 100: South Africa Cashew Industry Volume (Metric Tons) Forecast, by Application 2020 & 2033
- Table 101: Rest of Middle East & Africa Cashew Industry Revenue (Million) Forecast, by Application 2020 & 2033
- Table 102: Rest of Middle East & Africa Cashew Industry Volume (Metric Tons) Forecast, by Application 2020 & 2033
- Table 103: Global Cashew Industry Revenue Million Forecast, by Production Analysis 2020 & 2033
- Table 104: Global Cashew Industry Volume Metric Tons Forecast, by Production Analysis 2020 & 2033
- Table 105: Global Cashew Industry Revenue Million Forecast, by Consumption Analysis 2020 & 2033
- Table 106: Global Cashew Industry Volume Metric Tons Forecast, by Consumption Analysis 2020 & 2033
- Table 107: Global Cashew Industry Revenue Million Forecast, by Import Market Analysis (Value & Volume) 2020 & 2033
- Table 108: Global Cashew Industry Volume Metric Tons Forecast, by Import Market Analysis (Value & Volume) 2020 & 2033
- Table 109: Global Cashew Industry Revenue Million Forecast, by Export Market Analysis (Value & Volume) 2020 & 2033
- Table 110: Global Cashew Industry Volume Metric Tons Forecast, by Export Market Analysis (Value & Volume) 2020 & 2033
- Table 111: Global Cashew Industry Revenue Million Forecast, by Price Trend Analysis 2020 & 2033
- Table 112: Global Cashew Industry Volume Metric Tons Forecast, by Price Trend Analysis 2020 & 2033
- Table 113: Global Cashew Industry Revenue Million Forecast, by Country 2020 & 2033
- Table 114: Global Cashew Industry Volume Metric Tons Forecast, by Country 2020 & 2033
- Table 115: China Cashew Industry Revenue (Million) Forecast, by Application 2020 & 2033
- Table 116: China Cashew Industry Volume (Metric Tons) Forecast, by Application 2020 & 2033
- Table 117: India Cashew Industry Revenue (Million) Forecast, by Application 2020 & 2033
- Table 118: India Cashew Industry Volume (Metric Tons) Forecast, by Application 2020 & 2033
- Table 119: Japan Cashew Industry Revenue (Million) Forecast, by Application 2020 & 2033
- Table 120: Japan Cashew Industry Volume (Metric Tons) Forecast, by Application 2020 & 2033
- Table 121: South Korea Cashew Industry Revenue (Million) Forecast, by Application 2020 & 2033
- Table 122: South Korea Cashew Industry Volume (Metric Tons) Forecast, by Application 2020 & 2033
- Table 123: ASEAN Cashew Industry Revenue (Million) Forecast, by Application 2020 & 2033
- Table 124: ASEAN Cashew Industry Volume (Metric Tons) Forecast, by Application 2020 & 2033
- Table 125: Oceania Cashew Industry Revenue (Million) Forecast, by Application 2020 & 2033
- Table 126: Oceania Cashew Industry Volume (Metric Tons) Forecast, by Application 2020 & 2033
- Table 127: Rest of Asia Pacific Cashew Industry Revenue (Million) Forecast, by Application 2020 & 2033
- Table 128: Rest of Asia Pacific Cashew Industry Volume (Metric Tons) Forecast, by Application 2020 & 2033
Frequently Asked Questions
1. What is the projected Compound Annual Growth Rate (CAGR) of the Cashew Industry?
The projected CAGR is approximately 4.60%.
2. Which companies are prominent players in the Cashew Industry?
Key companies in the market include The Hershey Company, Olam International, Vietnam Cashew Association , Indian Cashew Exporters Association.
3. What are the main segments of the Cashew Industry?
The market segments include Production Analysis, Consumption Analysis, Import Market Analysis (Value & Volume), Export Market Analysis (Value & Volume), Price Trend Analysis.
4. Can you provide details about the market size?
The market size is estimated to be USD 8.78 Million as of 2022.
5. What are some drivers contributing to market growth?
Rising Consumption of Cashew Nuts as a Healthy Snack; Increasing Government initiatives; Growing Cashew Nut Imports in The United States.
6. What are the notable trends driving market growth?
Increasing Government Initiatives to Boost Cashew Production.
7. Are there any restraints impacting market growth?
Hazardous Climatic Condition Hinders Cashew Production; Stringent Regulations Related To Food Quality Standards.
8. Can you provide examples of recent developments in the market?
N/A
9. What pricing options are available for accessing the report?
Pricing options include single-user, multi-user, and enterprise licenses priced at USD 3800, USD 4500, and USD 5800 respectively.
10. Is the market size provided in terms of value or volume?
The market size is provided in terms of value, measured in Million and volume, measured in Metric Tons.
11. Are there any specific market keywords associated with the report?
Yes, the market keyword associated with the report is "Cashew Industry," which aids in identifying and referencing the specific market segment covered.
12. How do I determine which pricing option suits my needs best?
The pricing options vary based on user requirements and access needs. Individual users may opt for single-user licenses, while businesses requiring broader access may choose multi-user or enterprise licenses for cost-effective access to the report.
13. Are there any additional resources or data provided in the Cashew Industry report?
While the report offers comprehensive insights, it's advisable to review the specific contents or supplementary materials provided to ascertain if additional resources or data are available.
14. How can I stay updated on further developments or reports in the Cashew Industry?
To stay informed about further developments, trends, and reports in the Cashew Industry, consider subscribing to industry newsletters, following relevant companies and organizations, or regularly checking reputable industry news sources and publications.
Methodology
Step 1 - Identification of Relevant Samples Size from Population Database


Step 2 - Approaches for Defining Global Market Size (Value, Volume* & Price*)

Note*: In applicable scenarios
Step 3 - Data Sources
Primary Research
- Web Analytics
- Survey Reports
- Research Institute
- Latest Research Reports
- Opinion Leaders
Secondary Research
- Annual Reports
- White Paper
- Latest Press Release
- Industry Association
- Paid Database
- Investor Presentations

Step 4 - Data Triangulation
Involves using different sources of information in order to increase the validity of a study
These sources are likely to be stakeholders in a program - participants, other researchers, program staff, other community members, and so on.
Then we put all data in single framework & apply various statistical tools to find out the dynamic on the market.
During the analysis stage, feedback from the stakeholder groups would be compared to determine areas of agreement as well as areas of divergence