

Key Insights
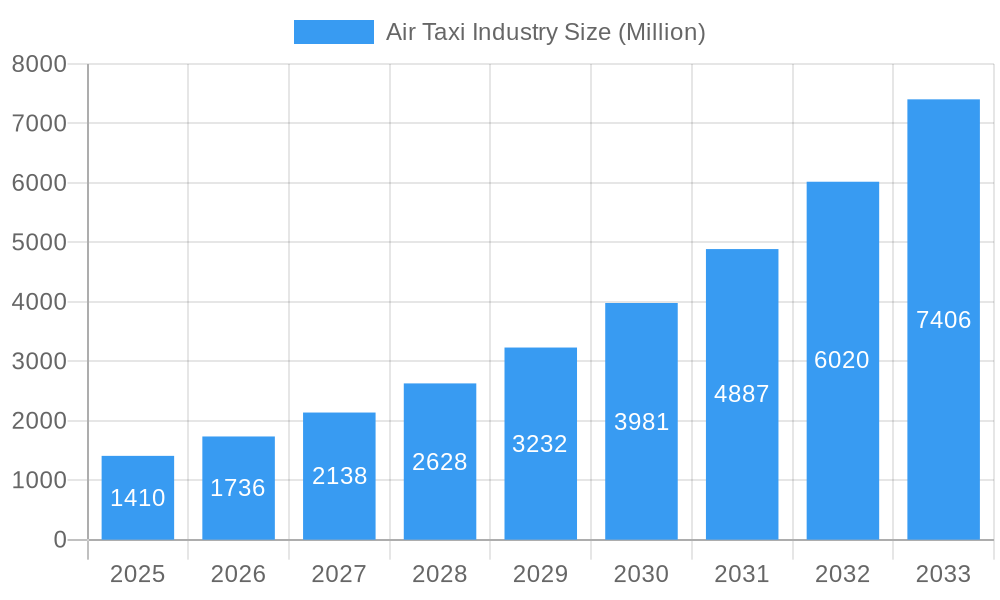
The air taxi industry is poised for explosive growth, projected to reach a market size of $1.41 billion in 2025 and exhibiting a remarkable Compound Annual Growth Rate (CAGR) of 23.32% from 2025 to 2033. This rapid expansion is driven by several key factors. Increasing urbanization and congestion in major metropolitan areas are fueling the demand for faster, more efficient, and less polluting alternatives to traditional ground transportation. Technological advancements in electric vertical takeoff and landing (eVTOL) aircraft, coupled with ongoing developments in autonomous flight systems, are making air taxis a more viable and commercially attractive proposition. Furthermore, supportive government regulations and initiatives aimed at promoting sustainable transportation are further accelerating market adoption. Strong investor interest and significant funding injected into the sector are also playing a crucial role in fostering innovation and scaling operations.
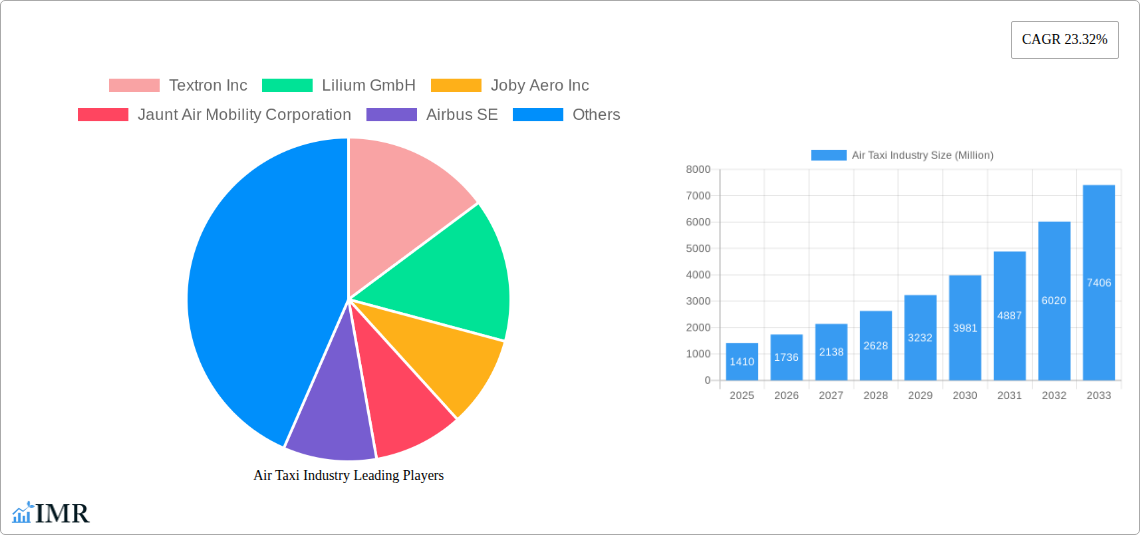
Air Taxi Industry Market Size (In Billion)
However, the industry also faces considerable challenges. The high initial investment costs associated with developing and manufacturing eVTOL aircraft, establishing necessary infrastructure for air taxi operations (vertiports), and ensuring rigorous safety standards present significant hurdles for market entry and expansion. Public acceptance and overcoming concerns about safety and noise pollution remain crucial aspects of successful market penetration. Competition among established aerospace giants and emerging startups will also intensify as the market matures. Regulatory complexities and varying standards across different regions also pose challenges for companies seeking global expansion. Nevertheless, the long-term outlook for the air taxi industry remains exceptionally positive, driven by technological breakthroughs, increasing demand, and a growing recognition of its potential to revolutionize urban mobility.
Air Taxi Industry Company Market Share
Air Taxi Industry Market Report: 2019-2033
This comprehensive report provides an in-depth analysis of the air taxi industry, encompassing market dynamics, growth trends, key players, and future outlook. The study period covers 2019-2033, with a base year of 2025 and a forecast period of 2025-2033. The report utilizes data from the historical period (2019-2024) and leverages advanced analytical techniques to provide accurate and insightful projections. This report is ideal for industry professionals, investors, and strategic decision-makers seeking a detailed understanding of this rapidly evolving market. The total market size is projected to reach xx Million by 2033.
Air Taxi Industry Market Dynamics & Structure
The air taxi market is a dynamic landscape characterized by a blend of established aerospace powerhouses and agile, innovative startups. Currently, market concentration is relatively low, with a diverse array of key players actively competing for a significant share. The relentless pace of technological advancement, particularly in areas such as electric propulsion, advanced battery systems, and sophisticated autonomous flight technologies, serves as a primary catalyst for market evolution. Concurrently, the regulatory environment is undergoing a period of development, presenting both promising opportunities and notable challenges that shape the industry's trajectory. Electric Vertical Take-Off and Landing (eVTOL) aircraft are emerging as transformative forces, poised to significantly disrupt the existing markets for traditional helicopters and private jets, effectively functioning as potent competitive substitutes. The demographic profile of end-users is steadily shifting, with a growing emphasis on affluent individuals and forward-thinking businesses that prioritize swift, exceptionally convenient, and highly efficient transportation solutions for both intra-city and intercity travel. The anticipation of increased merger and acquisition (M&A) activity is high, signaling a likely period of consolidation that will further drive technological progress and market maturation.
- Market Concentration: Low and fragmented, with a dynamic competitive environment featuring numerous emerging and established players.
- Technological Innovation: Pioneering advancements in electric propulsion, next-generation battery technology, sophisticated autonomous flight systems, and the broader integration of Advanced Air Mobility (AAM) concepts are the cornerstones of market progress.
- Regulatory Frameworks: The evolving and often complex regulatory landscape presents a dual-edged sword, offering potential pathways for innovation while simultaneously posing significant hurdles for market entry and widespread adoption.
- Competitive Substitutes: Key competitors include conventional helicopters, private jets, and increasingly, high-speed rail networks, all vying for a share of the premium and time-sensitive transportation market.
- End-User Demographics: The primary user base is expanding to include affluent individuals, businesses seeking operational efficiency, and potentially, integrated urban transit systems aiming to alleviate congestion.
- M&A Trends: A notable uptick in M&A activity is projected, suggesting a trend towards industry consolidation, which is expected to accelerate innovation and market development. The number of deals in 2024 was XX, representing a total value of XX Million.
Air Taxi Industry Growth Trends & Insights
The air taxi sector is currently experiencing a phase of exponential growth, driven by an escalating demand for more rapid and exceptionally efficient urban transportation solutions. The market size is forecast to expand significantly, projected to grow at a robust Compound Annual Growth Rate (CAGR) of XX% between 2025 and 2033. The rate at which air taxis are adopted is expected to surge as technological capabilities mature and critical regulatory obstacles are systematically addressed. Disruptive technological advancements, such as the development and eventual deployment of fully autonomous eVTOLs, are acting as powerful accelerators for market expansion and are actively shaping evolving consumer expectations. Consumer behavior is increasingly leaning towards a strong preference for on-demand, highly convenient, and environmentally conscious transportation alternatives. Factors such as rising disposable incomes in key global markets and a growing societal awareness of sustainability initiatives are significantly fueling this transformative shift.
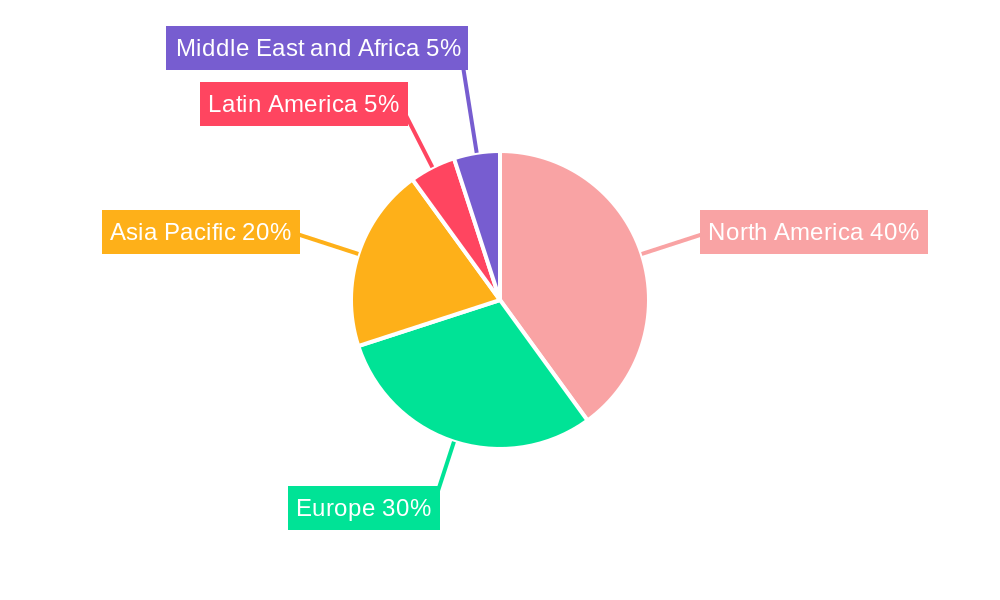
Dominant Regions, Countries, or Segments in Air Taxi Industry
The North American market currently holds a significant share in the global air taxi industry, driven by early technological advancements and supportive regulatory environments. This is followed by Europe and Asia-Pacific regions. Within the Mode of Operation segment, the Piloted segment currently dominates due to higher safety and certification standards. However, the Autonomous segment is expected to experience faster growth, reaching xx Million by 2033, driven by technological advancements and decreasing operational costs.
- Key Drivers (North America): Strong investment in R&D, supportive government policies, and a well-developed infrastructure.
- Key Drivers (Europe): Government initiatives focused on promoting sustainable urban mobility, and strong technological capabilities within the aerospace sector.
- Key Drivers (Asia-Pacific): Rapid urbanization, growing disposable incomes, and the potential to address significant congestion challenges in major cities.
- Piloted Segment: High initial adoption due to established safety regulations and existing pilot training infrastructure.
- Autonomous Segment: Rapid growth potential owing to continuous technological advancements and projected reduction in operational cost.
Air Taxi Industry Product Landscape
The air taxi industry is characterized by a diverse range of eVTOL aircraft designs, each with unique features and capabilities. Key innovations focus on enhanced safety, increased efficiency, and improved passenger comfort. Electric propulsion systems, advanced flight control algorithms, and integrated sensor technologies are transforming the performance of air taxis. These advancements enable quieter operation, greater speed, and increased range compared to traditional helicopters, with significant improvements in fuel efficiency and reducing environmental impact.
Key Drivers, Barriers & Challenges in Air Taxi Industry
Key Drivers:
- Pioneering advancements in battery technology, offering extended range and faster charging capabilities, alongside sophisticated autonomous flight systems that enhance safety and efficiency.
- A rapidly increasing demand for faster, more efficient, and environmentally friendly urban transportation solutions to combat congestion and save valuable time.
- Robust government support, including favorable policies, grants, and incentives specifically earmarked for the research, development, and deployment of Advanced Air Mobility (AAM) systems.
Key Challenges:
- The substantial financial outlay required for research, development, and the lengthy, rigorous certification processes mandated by aviation authorities.
- Lingering regulatory uncertainties and persistent safety concerns associated with the operation of autonomous flight systems, necessitating comprehensive validation and public trust-building.
- Critical infrastructure limitations, including the availability of suitable vertiports, efficient charging station networks, and advanced air traffic management systems capable of integrating a new class of air vehicles. The estimated infrastructure investment needed is XX Million by 2030.
Emerging Opportunities in Air Taxi Industry
- Expansion into underserved regional markets, providing air connectivity to remote areas.
- Integration of air taxis into existing urban transportation networks.
- Development of specialized air taxi applications for medical emergencies, cargo delivery, and tourism.
Growth Accelerators in the Air Taxi Industry Industry
The air taxi industry is poised for significant growth, propelled by technological advancements in battery technology, autonomous flight capabilities and broader integration within AAM ecosystems. Strategic partnerships between established aerospace manufacturers and technology companies are fostering innovation and accelerating market development. Expanding the charging infrastructure and enhancing air traffic management systems are essential for accommodating the projected growth in air taxi operations.
Key Players Shaping the Air Taxi Industry Market
- Textron Inc
- Lilium GmbH
- Joby Aero Inc
- Jaunt Air Mobility Corporation
- Airbus SE
- Hyundai Motor Company
- Volocopter GmbH
- Wisk Aero LLC
- Guangzhou EHang Intelligent Technology Co Ltd
- The Boeing Company
Notable Milestones in Air Taxi Industry Sector
- 2021: Joby Aero successfully completed its first public flight of a prototype eVTOL.
- 2022: Lilium announced partnerships for infrastructure development and commercialization.
- 2023: Airbus unveiled a new generation of eVTOL with improved performance and safety features.
- 2024: Several companies received type certification for pilot programs.
In-Depth Air Taxi Industry Market Outlook
The air taxi market is projected to experience substantial growth over the next decade. Continued technological innovation, supportive regulatory frameworks, and increasing consumer adoption will drive market expansion. Strategic partnerships and mergers and acquisitions will shape the competitive landscape. Emerging applications, such as medical transport and cargo delivery, will further diversify the market and unlock significant growth opportunities. The air taxi industry is poised to become an integral part of the future urban transportation ecosystem.
Air Taxi Industry Segmentation
-
1. Mode of Operation
- 1.1. Piloted
- 1.2. Autonomous
Air Taxi Industry Segmentation By Geography
-
1. North America
- 1.1. United States
- 1.2. Canada
-
2. Europe
- 2.1. Germany
- 2.2. United Kingdom
- 2.3. France
- 2.4. Russia
- 2.5. Rest of Europe
-
3. Asia Pacific
- 3.1. India
- 3.2. China
- 3.3. Japan
- 3.4. South Korea
- 3.5. Australia
- 3.6. Rest of Asia Pacific
-
4. Latin America
- 4.1. Brazil
- 4.2. Mexico
- 4.3. Rest of Latin America
-
5. Middle East and Africa
- 5.1. Saudi Arabia
- 5.2. Egypt
- 5.3. Israel
- 5.4. Rest of Middle East and Africa
Air Taxi Industry Regional Market Share
Geographic Coverage of Air Taxi Industry
Air Taxi Industry REPORT HIGHLIGHTS
| Aspects | Details |
|---|---|
| Study Period | 2020-2034 |
| Base Year | 2025 |
| Estimated Year | 2026 |
| Forecast Period | 2026-2034 |
| Historical Period | 2020-2025 |
| Growth Rate | CAGR of 23.32% from 2020-2034 |
| Segmentation |
|
Table of Contents
- 1. Introduction
- 1.1. Research Scope
- 1.2. Market Segmentation
- 1.3. Research Objective
- 1.4. Definitions and Assumptions
- 2. Executive Summary
- 2.1. Market Snapshot
- 3. Market Dynamics
- 3.1. Market Drivers
- 3.2. Market Restrains
- 3.3. Market Trends
- 3.4. Market Opportunities
- 4. Market Factor Analysis
- 4.1. Porters Five Forces
- 4.1.1. Bargaining Power of Suppliers
- 4.1.2. Bargaining Power of Buyers
- 4.1.3. Threat of New Entrants
- 4.1.4. Threat of Substitutes
- 4.1.5. Competitive Rivalry
- 4.2. PESTEL analysis
- 4.3. BCG Analysis
- 4.3.1. Stars (High Growth, High Market Share)
- 4.3.2. Cash Cows (Low Growth, High Market Share)
- 4.3.3. Question Mark (High Growth, Low Market Share)
- 4.3.4. Dogs (Low Growth, Low Market Share)
- 4.4. Ansoff Matrix Analysis
- 4.5. Supply Chain Analysis
- 4.6. Regulatory Landscape
- 4.7. Current Market Potential and Opportunity Assessment (TAM–SAM–SOM Framework)
- 4.8. IMR Analyst Note
- 4.1. Porters Five Forces
- 5. Market Analysis, Insights and Forecast 2021-2033
- 5.1. Market Analysis, Insights and Forecast - by Mode of Operation
- 5.1.1. Piloted
- 5.1.2. Autonomous
- 5.2. Market Analysis, Insights and Forecast - by Region
- 5.2.1. North America
- 5.2.2. Europe
- 5.2.3. Asia Pacific
- 5.2.4. Latin America
- 5.2.5. Middle East and Africa
- 5.1. Market Analysis, Insights and Forecast - by Mode of Operation
- 6. Global Air Taxi Industry Analysis, Insights and Forecast, 2021-2033
- 6.1. Market Analysis, Insights and Forecast - by Mode of Operation
- 6.1.1. Piloted
- 6.1.2. Autonomous
- 6.1. Market Analysis, Insights and Forecast - by Mode of Operation
- 7. North America Air Taxi Industry Analysis, Insights and Forecast, 2020-2032
- 7.1. Market Analysis, Insights and Forecast - by Mode of Operation
- 7.1.1. Piloted
- 7.1.2. Autonomous
- 7.1. Market Analysis, Insights and Forecast - by Mode of Operation
- 8. Europe Air Taxi Industry Analysis, Insights and Forecast, 2020-2032
- 8.1. Market Analysis, Insights and Forecast - by Mode of Operation
- 8.1.1. Piloted
- 8.1.2. Autonomous
- 8.1. Market Analysis, Insights and Forecast - by Mode of Operation
- 9. Asia Pacific Air Taxi Industry Analysis, Insights and Forecast, 2020-2032
- 9.1. Market Analysis, Insights and Forecast - by Mode of Operation
- 9.1.1. Piloted
- 9.1.2. Autonomous
- 9.1. Market Analysis, Insights and Forecast - by Mode of Operation
- 10. Latin America Air Taxi Industry Analysis, Insights and Forecast, 2020-2032
- 10.1. Market Analysis, Insights and Forecast - by Mode of Operation
- 10.1.1. Piloted
- 10.1.2. Autonomous
- 10.1. Market Analysis, Insights and Forecast - by Mode of Operation
- 11. Middle East and Africa Air Taxi Industry Analysis, Insights and Forecast, 2020-2032
- 11.1. Market Analysis, Insights and Forecast - by Mode of Operation
- 11.1.1. Piloted
- 11.1.2. Autonomous
- 11.1. Market Analysis, Insights and Forecast - by Mode of Operation
- 12. Competitive Analysis
- 12.1. Company Profiles
- 12.1.1 Textron Inc
- 12.1.1.1. Company Overview
- 12.1.1.2. Products
- 12.1.1.3. Company Financials
- 12.1.1.4. SWOT Analysis
- 12.1.2 Lilium GmbH
- 12.1.2.1. Company Overview
- 12.1.2.2. Products
- 12.1.2.3. Company Financials
- 12.1.2.4. SWOT Analysis
- 12.1.3 Joby Aero Inc
- 12.1.3.1. Company Overview
- 12.1.3.2. Products
- 12.1.3.3. Company Financials
- 12.1.3.4. SWOT Analysis
- 12.1.4 Jaunt Air Mobility Corporation
- 12.1.4.1. Company Overview
- 12.1.4.2. Products
- 12.1.4.3. Company Financials
- 12.1.4.4. SWOT Analysis
- 12.1.5 Airbus SE
- 12.1.5.1. Company Overview
- 12.1.5.2. Products
- 12.1.5.3. Company Financials
- 12.1.5.4. SWOT Analysis
- 12.1.6 Hyundai Motor Company
- 12.1.6.1. Company Overview
- 12.1.6.2. Products
- 12.1.6.3. Company Financials
- 12.1.6.4. SWOT Analysis
- 12.1.7 Volocopter GmbH
- 12.1.7.1. Company Overview
- 12.1.7.2. Products
- 12.1.7.3. Company Financials
- 12.1.7.4. SWOT Analysis
- 12.1.8 Wisk Aero LL
- 12.1.8.1. Company Overview
- 12.1.8.2. Products
- 12.1.8.3. Company Financials
- 12.1.8.4. SWOT Analysis
- 12.1.9 Guangzhou EHang Intelligent Technology Co Ltd
- 12.1.9.1. Company Overview
- 12.1.9.2. Products
- 12.1.9.3. Company Financials
- 12.1.9.4. SWOT Analysis
- 12.1.10 The Boeing Company
- 12.1.10.1. Company Overview
- 12.1.10.2. Products
- 12.1.10.3. Company Financials
- 12.1.10.4. SWOT Analysis
- 12.1.1 Textron Inc
- 12.2. Market Entropy
- 12.2.1 Company's Key Areas Served
- 12.2.2 Recent Developments
- 12.3. Company Market Share Analysis 2025
- 12.3.1 Top 5 Companies Market Share Analysis
- 12.3.2 Top 3 Companies Market Share Analysis
- 12.4. List of Potential Customers
- 13. Research Methodology
List of Figures
- Figure 1: Global Air Taxi Industry Revenue Breakdown (Million, %) by Region 2025 & 2033
- Figure 2: North America Air Taxi Industry Revenue (Million), by Mode of Operation 2025 & 2033
- Figure 3: North America Air Taxi Industry Revenue Share (%), by Mode of Operation 2025 & 2033
- Figure 4: North America Air Taxi Industry Revenue (Million), by Country 2025 & 2033
- Figure 5: North America Air Taxi Industry Revenue Share (%), by Country 2025 & 2033
- Figure 6: Europe Air Taxi Industry Revenue (Million), by Mode of Operation 2025 & 2033
- Figure 7: Europe Air Taxi Industry Revenue Share (%), by Mode of Operation 2025 & 2033
- Figure 8: Europe Air Taxi Industry Revenue (Million), by Country 2025 & 2033
- Figure 9: Europe Air Taxi Industry Revenue Share (%), by Country 2025 & 2033
- Figure 10: Asia Pacific Air Taxi Industry Revenue (Million), by Mode of Operation 2025 & 2033
- Figure 11: Asia Pacific Air Taxi Industry Revenue Share (%), by Mode of Operation 2025 & 2033
- Figure 12: Asia Pacific Air Taxi Industry Revenue (Million), by Country 2025 & 2033
- Figure 13: Asia Pacific Air Taxi Industry Revenue Share (%), by Country 2025 & 2033
- Figure 14: Latin America Air Taxi Industry Revenue (Million), by Mode of Operation 2025 & 2033
- Figure 15: Latin America Air Taxi Industry Revenue Share (%), by Mode of Operation 2025 & 2033
- Figure 16: Latin America Air Taxi Industry Revenue (Million), by Country 2025 & 2033
- Figure 17: Latin America Air Taxi Industry Revenue Share (%), by Country 2025 & 2033
- Figure 18: Middle East and Africa Air Taxi Industry Revenue (Million), by Mode of Operation 2025 & 2033
- Figure 19: Middle East and Africa Air Taxi Industry Revenue Share (%), by Mode of Operation 2025 & 2033
- Figure 20: Middle East and Africa Air Taxi Industry Revenue (Million), by Country 2025 & 2033
- Figure 21: Middle East and Africa Air Taxi Industry Revenue Share (%), by Country 2025 & 2033
List of Tables
- Table 1: Global Air Taxi Industry Revenue Million Forecast, by Mode of Operation 2020 & 2033
- Table 2: Global Air Taxi Industry Revenue Million Forecast, by Region 2020 & 2033
- Table 3: Global Air Taxi Industry Revenue Million Forecast, by Mode of Operation 2020 & 2033
- Table 4: Global Air Taxi Industry Revenue Million Forecast, by Country 2020 & 2033
- Table 5: United States Air Taxi Industry Revenue (Million) Forecast, by Application 2020 & 2033
- Table 6: Canada Air Taxi Industry Revenue (Million) Forecast, by Application 2020 & 2033
- Table 7: Global Air Taxi Industry Revenue Million Forecast, by Mode of Operation 2020 & 2033
- Table 8: Global Air Taxi Industry Revenue Million Forecast, by Country 2020 & 2033
- Table 9: Germany Air Taxi Industry Revenue (Million) Forecast, by Application 2020 & 2033
- Table 10: United Kingdom Air Taxi Industry Revenue (Million) Forecast, by Application 2020 & 2033
- Table 11: France Air Taxi Industry Revenue (Million) Forecast, by Application 2020 & 2033
- Table 12: Russia Air Taxi Industry Revenue (Million) Forecast, by Application 2020 & 2033
- Table 13: Rest of Europe Air Taxi Industry Revenue (Million) Forecast, by Application 2020 & 2033
- Table 14: Global Air Taxi Industry Revenue Million Forecast, by Mode of Operation 2020 & 2033
- Table 15: Global Air Taxi Industry Revenue Million Forecast, by Country 2020 & 2033
- Table 16: India Air Taxi Industry Revenue (Million) Forecast, by Application 2020 & 2033
- Table 17: China Air Taxi Industry Revenue (Million) Forecast, by Application 2020 & 2033
- Table 18: Japan Air Taxi Industry Revenue (Million) Forecast, by Application 2020 & 2033
- Table 19: South Korea Air Taxi Industry Revenue (Million) Forecast, by Application 2020 & 2033
- Table 20: Australia Air Taxi Industry Revenue (Million) Forecast, by Application 2020 & 2033
- Table 21: Rest of Asia Pacific Air Taxi Industry Revenue (Million) Forecast, by Application 2020 & 2033
- Table 22: Global Air Taxi Industry Revenue Million Forecast, by Mode of Operation 2020 & 2033
- Table 23: Global Air Taxi Industry Revenue Million Forecast, by Country 2020 & 2033
- Table 24: Brazil Air Taxi Industry Revenue (Million) Forecast, by Application 2020 & 2033
- Table 25: Mexico Air Taxi Industry Revenue (Million) Forecast, by Application 2020 & 2033
- Table 26: Rest of Latin America Air Taxi Industry Revenue (Million) Forecast, by Application 2020 & 2033
- Table 27: Global Air Taxi Industry Revenue Million Forecast, by Mode of Operation 2020 & 2033
- Table 28: Global Air Taxi Industry Revenue Million Forecast, by Country 2020 & 2033
- Table 29: Saudi Arabia Air Taxi Industry Revenue (Million) Forecast, by Application 2020 & 2033
- Table 30: Egypt Air Taxi Industry Revenue (Million) Forecast, by Application 2020 & 2033
- Table 31: Israel Air Taxi Industry Revenue (Million) Forecast, by Application 2020 & 2033
- Table 32: Rest of Middle East and Africa Air Taxi Industry Revenue (Million) Forecast, by Application 2020 & 2033
Frequently Asked Questions
1. What is the projected Compound Annual Growth Rate (CAGR) of the Air Taxi Industry?
The projected CAGR is approximately 23.32%.
2. Which companies are prominent players in the Air Taxi Industry?
Key companies in the market include Textron Inc, Lilium GmbH, Joby Aero Inc, Jaunt Air Mobility Corporation, Airbus SE, Hyundai Motor Company, Volocopter GmbH, Wisk Aero LL, Guangzhou EHang Intelligent Technology Co Ltd, The Boeing Company.
3. What are the main segments of the Air Taxi Industry?
The market segments include Mode of Operation.
4. Can you provide details about the market size?
The market size is estimated to be USD 1.41 Million as of 2022.
5. What are some drivers contributing to market growth?
N/A
6. What are the notable trends driving market growth?
Piloted Segment to Dominate Market Share During the Forecast Period.
7. Are there any restraints impacting market growth?
N/A
8. Can you provide examples of recent developments in the market?
N/A
9. What pricing options are available for accessing the report?
Pricing options include single-user, multi-user, and enterprise licenses priced at USD 4750, USD 5250, and USD 8750 respectively.
10. Is the market size provided in terms of value or volume?
The market size is provided in terms of value, measured in Million.
11. Are there any specific market keywords associated with the report?
Yes, the market keyword associated with the report is "Air Taxi Industry," which aids in identifying and referencing the specific market segment covered.
12. How do I determine which pricing option suits my needs best?
The pricing options vary based on user requirements and access needs. Individual users may opt for single-user licenses, while businesses requiring broader access may choose multi-user or enterprise licenses for cost-effective access to the report.
13. Are there any additional resources or data provided in the Air Taxi Industry report?
While the report offers comprehensive insights, it's advisable to review the specific contents or supplementary materials provided to ascertain if additional resources or data are available.
14. How can I stay updated on further developments or reports in the Air Taxi Industry?
To stay informed about further developments, trends, and reports in the Air Taxi Industry, consider subscribing to industry newsletters, following relevant companies and organizations, or regularly checking reputable industry news sources and publications.
Methodology
Step 1 - Identification of Relevant Samples Size from Population Database


Step 2 - Approaches for Defining Global Market Size (Value, Volume* & Price*)

Note*: In applicable scenarios
Step 3 - Data Sources
Primary Research
- Web Analytics
- Survey Reports
- Research Institute
- Latest Research Reports
- Opinion Leaders
Secondary Research
- Annual Reports
- White Paper
- Latest Press Release
- Industry Association
- Paid Database
- Investor Presentations

Step 4 - Data Triangulation
Involves using different sources of information in order to increase the validity of a study
These sources are likely to be stakeholders in a program - participants, other researchers, program staff, other community members, and so on.
Then we put all data in single framework & apply various statistical tools to find out the dynamic on the market.
During the analysis stage, feedback from the stakeholder groups would be compared to determine areas of agreement as well as areas of divergence