

Key Insights
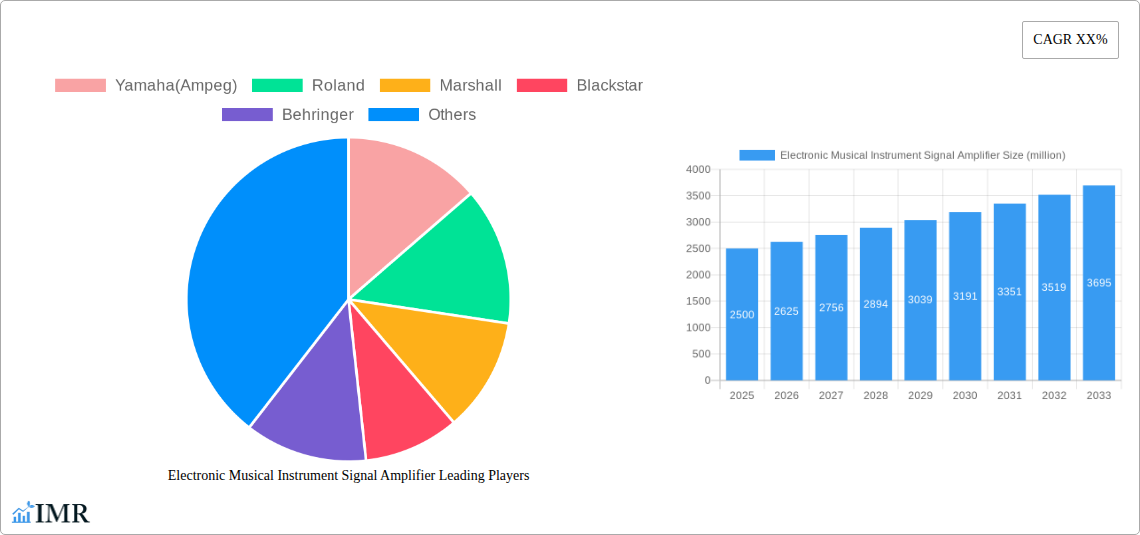
The global market for electronic musical instrument signal amplifiers is a dynamic sector experiencing steady growth, driven by the increasing popularity of live music performances, home recording studios, and the expanding use of electronic instruments in diverse musical genres. The market's value is estimated to be around $2.5 billion in 2025, exhibiting a Compound Annual Growth Rate (CAGR) of approximately 5% over the forecast period (2025-2033). This growth is fueled by several key factors. Technological advancements, such as the integration of digital effects and modeling capabilities within amplifiers, are enhancing their versatility and appeal to musicians. The rising demand for high-quality audio reproduction and customizable sound profiles further contributes to market expansion. The market is segmented by amplifier type (e.g., tube, solid-state, modeling), instrument type (guitar, bass, keyboard), and price range, offering diverse options to cater to various musician needs and budgets. Established brands like Fender, Marshall, and Yamaha (Ampeg) dominate the market, but competition is intensifying from emerging brands offering innovative products at competitive prices. However, factors like the high initial investment cost for professional-grade amplifiers and the growing popularity of digital audio workstations (DAWs) and software-based amp modeling pose some restraints to market growth.
Looking ahead, the market is expected to witness continued innovation in amplifier technology, with a focus on lightweight designs, improved portability, and enhanced digital connectivity. The growing adoption of online music platforms and streaming services is also expected to boost demand for high-quality amplifiers. Furthermore, the integration of smart features and mobile app control offers new opportunities for manufacturers to engage with musicians. Regional variations in market growth are anticipated, with North America and Europe likely remaining significant markets due to established musical infrastructure and high consumer spending on musical equipment. However, emerging economies in Asia and Latin America present significant growth potential, driven by increasing disposable income and rising interest in music. The competitive landscape is expected to remain dynamic, characterized by product innovation, strategic partnerships, and acquisitions.
Electronic Musical Instrument Signal Amplifier Market Report: 2019-2033
This comprehensive report provides an in-depth analysis of the Electronic Musical Instrument Signal Amplifier market, encompassing market dynamics, growth trends, regional analysis, product landscape, key players, and future outlook. The study period covers 2019-2033, with 2025 as the base and estimated year. The report segments the market by type and application, offering granular insights into the parent market (Musical Instrument Accessories) and the child market (Amplifiers). The global market size is projected at xx million units in 2025, showcasing significant growth potential.
Electronic Musical Instrument Signal Amplifier Market Dynamics & Structure
The Electronic Musical Instrument Signal Amplifier market exhibits a moderately concentrated structure, with key players like Yamaha (Ampeg), Roland, Marshall, and Fender holding significant market share. Technological innovation, particularly in digital modeling and effects processing, is a major driver. Regulatory frameworks concerning product safety and emissions play a supporting role. Competitive substitutes include software-based amplifiers and modeling units, while end-user demographics primarily comprise professional and amateur musicians across various genres. Mergers and acquisitions (M&A) activity has been relatively moderate in recent years, with xx deals recorded between 2019 and 2024.
- Market Concentration: Moderately concentrated, with top 5 players holding approximately xx% market share in 2025.
- Technological Innovation: Focus on digital modeling, improved power efficiency, and integrated effects processing.
- Regulatory Landscape: Compliance with safety and electromagnetic compatibility (EMC) standards.
- Competitive Substitutes: Software-based amplifiers, modeling software, and multi-effects processors.
- End-User Demographics: Professional musicians, hobbyists, and educational institutions.
- M&A Activity: xx deals between 2019 and 2024, with a focus on expanding product portfolios and geographical reach. xx% of deals were cross-border.
Electronic Musical Instrument Signal Amplifier Growth Trends & Insights
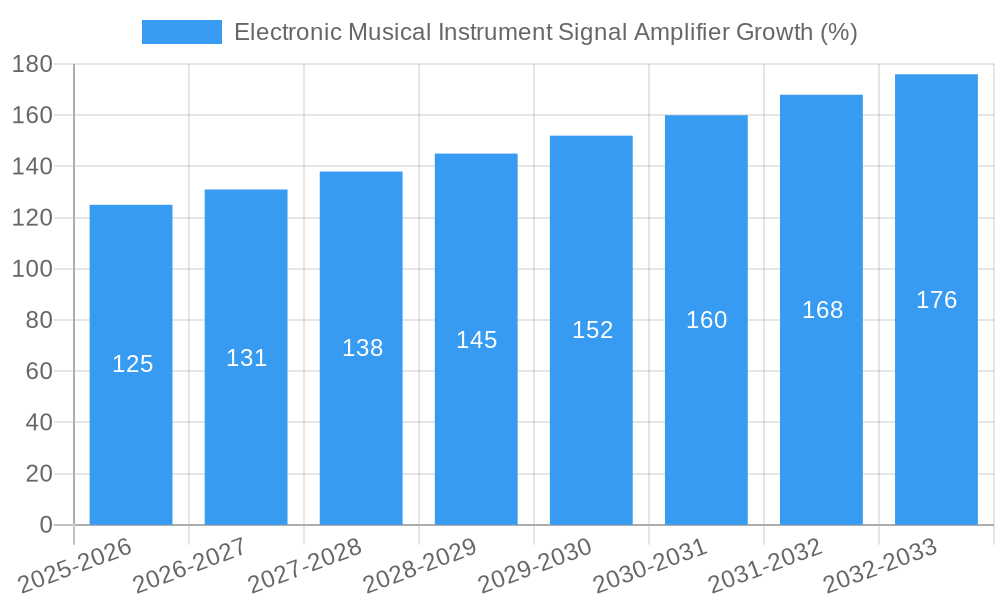
The Electronic Musical Instrument Signal Amplifier market experienced steady growth during the historical period (2019-2024), with a CAGR of xx%. This growth is attributed to rising disposable incomes, increased music participation rates, and technological advancements. The market size is estimated at xx million units in 2025, projected to reach xx million units by 2033, achieving a CAGR of xx% during the forecast period (2025-2033). Market penetration remains relatively high in developed regions, with substantial growth potential in emerging markets driven by rising music consumption. Technological disruptions, such as the rise of wireless amplifiers and software-based solutions, are influencing consumer behavior and shaping market trends. The adoption rate of digital modeling amplifiers is increasing significantly, while traditional tube amplifiers maintain a loyal customer base.
Dominant Regions, Countries, or Segments in Electronic Musical Instrument Signal Amplifier
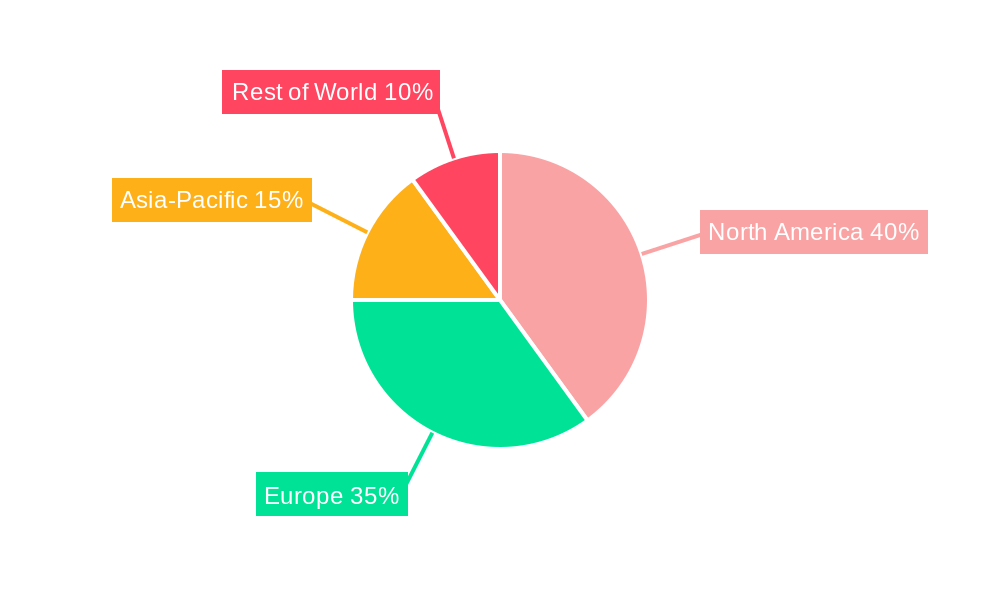
North America currently dominates the Electronic Musical Instrument Signal Amplifier market, accounting for approximately xx% of the global market share in 2025. This dominance is attributed to a strong music culture, high disposable incomes, and a well-established distribution network. Europe holds the second-largest market share, followed by Asia-Pacific, which is expected to witness significant growth in the forecast period.
- North America: High music consumption, established distribution channels, and a mature market.
- Europe: Strong presence of established brands and a diverse music scene.
- Asia-Pacific: Rapid market growth driven by rising disposable incomes and expanding music education.
- Rest of the World: Market characterized by varied growth rates, dependent on local economic conditions and music culture.
Electronic Musical Instrument Signal Amplifier Product Landscape
The Electronic Musical Instrument Signal Amplifier market offers a diverse range of products, including tube amplifiers, solid-state amplifiers, modeling amplifiers, and hybrid amplifiers. Innovations focus on improved sound quality, increased portability, and integrated effects processing. Unique selling propositions (USPs) often revolve around specific tonal characteristics, ease of use, and technological features like Bluetooth connectivity and digital modeling capabilities. Technological advancements are continuously pushing the boundaries of sound reproduction and effects simulation.
Key Drivers, Barriers & Challenges in Electronic Musical Instrument Signal Amplifier
Key Drivers: Growing popularity of music genres requiring amplification, technological advancements leading to improved sound quality and portability, increasing disposable incomes, and expanding music education infrastructure.
Challenges: Fluctuations in raw material prices, increasing competition from software-based solutions, and evolving consumer preferences towards digital and hybrid instruments. Supply chain disruptions can lead to production delays and increased costs, affecting market growth. Regulatory compliance and international trade policies also present significant challenges.
Emerging Opportunities in Electronic Musical Instrument Signal Amplifier
Untapped markets in developing economies, the rise of home studios and digital audio workstations (DAWs), and the increasing demand for wireless and portable amplifiers present significant opportunities. Innovation in areas such as AI-powered sound processing and personalized amplifier settings is also expected to create new market segments and drive growth.
Growth Accelerators in the Electronic Musical Instrument Signal Amplifier Industry
Technological breakthroughs in digital modeling and effects processing, strategic partnerships between amplifier manufacturers and software developers, and expansion into emerging markets through targeted marketing campaigns are key growth accelerators. The development of environmentally friendly amplifiers is also a potential driver of market growth, appealing to environmentally conscious musicians and consumers.
Key Players Shaping the Electronic Musical Instrument Signal Amplifier Market
- Yamaha (Ampeg)
- Roland
- Marshall
- Blackstar
- Behringer
- Fender
- Korg
- Hughes & Kettner
- Orange
- Laney
- Fishman
- Rivera
- MESA/Boogie
- Acoustic
- Randall
- Henriksen
Notable Milestones in Electronic Musical Instrument Signal Amplifier Sector
- 2020: Launch of several new digital modeling amplifiers with advanced features.
- 2021: Increased adoption of wireless technology in amplifier designs.
- 2022: Strategic partnership between a major amplifier manufacturer and a software developer.
- 2023: Introduction of environmentally friendly amplifier designs.
- 2024: Acquisition of a smaller amplifier company by a larger industry player.
In-Depth Electronic Musical Instrument Signal Amplifier Market Outlook
The Electronic Musical Instrument Signal Amplifier market is poised for continued growth, driven by technological innovation, expanding consumer base, and increasing market penetration in emerging economies. Strategic partnerships, product diversification, and targeted marketing efforts will be crucial for manufacturers to capitalize on future opportunities. The market is expected to witness a steady rise in demand for both traditional and digital amplifiers, catering to the diverse needs of musicians across various genres and skill levels.
Electronic Musical Instrument Signal Amplifier Segmentation
-
1. Application
- 1.1. Online Sales
- 1.2. Offline Sales
-
2. Types
- 2.1. Guitar Amplifiers
- 2.2. Keyboard Amplifiers
- 2.3. Bass Amplifiers
- 2.4. Others
Electronic Musical Instrument Signal Amplifier Segmentation By Geography
-
1. North America
- 1.1. United States
- 1.2. Canada
- 1.3. Mexico
-
2. South America
- 2.1. Brazil
- 2.2. Argentina
- 2.3. Rest of South America
-
3. Europe
- 3.1. United Kingdom
- 3.2. Germany
- 3.3. France
- 3.4. Italy
- 3.5. Spain
- 3.6. Russia
- 3.7. Benelux
- 3.8. Nordics
- 3.9. Rest of Europe
-
4. Middle East & Africa
- 4.1. Turkey
- 4.2. Israel
- 4.3. GCC
- 4.4. North Africa
- 4.5. South Africa
- 4.6. Rest of Middle East & Africa
-
5. Asia Pacific
- 5.1. China
- 5.2. India
- 5.3. Japan
- 5.4. South Korea
- 5.5. ASEAN
- 5.6. Oceania
- 5.7. Rest of Asia Pacific
Electronic Musical Instrument Signal Amplifier REPORT HIGHLIGHTS
| Aspects | Details |
|---|---|
| Study Period | 2019-2033 |
| Base Year | 2024 |
| Estimated Year | 2025 |
| Forecast Period | 2025-2033 |
| Historical Period | 2019-2024 |
| Growth Rate | CAGR of XX% from 2019-2033 |
| Segmentation |
|
Table of Contents
- 1. Introduction
- 1.1. Research Scope
- 1.2. Market Segmentation
- 1.3. Research Methodology
- 1.4. Definitions and Assumptions
- 2. Executive Summary
- 2.1. Introduction
- 3. Market Dynamics
- 3.1. Introduction
- 3.2. Market Drivers
- 3.3. Market Restrains
- 3.4. Market Trends
- 4. Market Factor Analysis
- 4.1. Porters Five Forces
- 4.2. Supply/Value Chain
- 4.3. PESTEL analysis
- 4.4. Market Entropy
- 4.5. Patent/Trademark Analysis
- 5. Global Electronic Musical Instrument Signal Amplifier Analysis, Insights and Forecast, 2019-2031
- 5.1. Market Analysis, Insights and Forecast - by Application
- 5.1.1. Online Sales
- 5.1.2. Offline Sales
- 5.2. Market Analysis, Insights and Forecast - by Types
- 5.2.1. Guitar Amplifiers
- 5.2.2. Keyboard Amplifiers
- 5.2.3. Bass Amplifiers
- 5.2.4. Others
- 5.3. Market Analysis, Insights and Forecast - by Region
- 5.3.1. North America
- 5.3.2. South America
- 5.3.3. Europe
- 5.3.4. Middle East & Africa
- 5.3.5. Asia Pacific
- 5.1. Market Analysis, Insights and Forecast - by Application
- 6. North America Electronic Musical Instrument Signal Amplifier Analysis, Insights and Forecast, 2019-2031
- 6.1. Market Analysis, Insights and Forecast - by Application
- 6.1.1. Online Sales
- 6.1.2. Offline Sales
- 6.2. Market Analysis, Insights and Forecast - by Types
- 6.2.1. Guitar Amplifiers
- 6.2.2. Keyboard Amplifiers
- 6.2.3. Bass Amplifiers
- 6.2.4. Others
- 6.1. Market Analysis, Insights and Forecast - by Application
- 7. South America Electronic Musical Instrument Signal Amplifier Analysis, Insights and Forecast, 2019-2031
- 7.1. Market Analysis, Insights and Forecast - by Application
- 7.1.1. Online Sales
- 7.1.2. Offline Sales
- 7.2. Market Analysis, Insights and Forecast - by Types
- 7.2.1. Guitar Amplifiers
- 7.2.2. Keyboard Amplifiers
- 7.2.3. Bass Amplifiers
- 7.2.4. Others
- 7.1. Market Analysis, Insights and Forecast - by Application
- 8. Europe Electronic Musical Instrument Signal Amplifier Analysis, Insights and Forecast, 2019-2031
- 8.1. Market Analysis, Insights and Forecast - by Application
- 8.1.1. Online Sales
- 8.1.2. Offline Sales
- 8.2. Market Analysis, Insights and Forecast - by Types
- 8.2.1. Guitar Amplifiers
- 8.2.2. Keyboard Amplifiers
- 8.2.3. Bass Amplifiers
- 8.2.4. Others
- 8.1. Market Analysis, Insights and Forecast - by Application
- 9. Middle East & Africa Electronic Musical Instrument Signal Amplifier Analysis, Insights and Forecast, 2019-2031
- 9.1. Market Analysis, Insights and Forecast - by Application
- 9.1.1. Online Sales
- 9.1.2. Offline Sales
- 9.2. Market Analysis, Insights and Forecast - by Types
- 9.2.1. Guitar Amplifiers
- 9.2.2. Keyboard Amplifiers
- 9.2.3. Bass Amplifiers
- 9.2.4. Others
- 9.1. Market Analysis, Insights and Forecast - by Application
- 10. Asia Pacific Electronic Musical Instrument Signal Amplifier Analysis, Insights and Forecast, 2019-2031
- 10.1. Market Analysis, Insights and Forecast - by Application
- 10.1.1. Online Sales
- 10.1.2. Offline Sales
- 10.2. Market Analysis, Insights and Forecast - by Types
- 10.2.1. Guitar Amplifiers
- 10.2.2. Keyboard Amplifiers
- 10.2.3. Bass Amplifiers
- 10.2.4. Others
- 10.1. Market Analysis, Insights and Forecast - by Application
- 11. Competitive Analysis
- 11.1. Global Market Share Analysis 2024
- 11.2. Company Profiles
- 11.2.1 Yamaha(Ampeg)
- 11.2.1.1. Overview
- 11.2.1.2. Products
- 11.2.1.3. SWOT Analysis
- 11.2.1.4. Recent Developments
- 11.2.1.5. Financials (Based on Availability)
- 11.2.2 Roland
- 11.2.2.1. Overview
- 11.2.2.2. Products
- 11.2.2.3. SWOT Analysis
- 11.2.2.4. Recent Developments
- 11.2.2.5. Financials (Based on Availability)
- 11.2.3 Marshall
- 11.2.3.1. Overview
- 11.2.3.2. Products
- 11.2.3.3. SWOT Analysis
- 11.2.3.4. Recent Developments
- 11.2.3.5. Financials (Based on Availability)
- 11.2.4 Blackstar
- 11.2.4.1. Overview
- 11.2.4.2. Products
- 11.2.4.3. SWOT Analysis
- 11.2.4.4. Recent Developments
- 11.2.4.5. Financials (Based on Availability)
- 11.2.5 Behringer
- 11.2.5.1. Overview
- 11.2.5.2. Products
- 11.2.5.3. SWOT Analysis
- 11.2.5.4. Recent Developments
- 11.2.5.5. Financials (Based on Availability)
- 11.2.6 Fender
- 11.2.6.1. Overview
- 11.2.6.2. Products
- 11.2.6.3. SWOT Analysis
- 11.2.6.4. Recent Developments
- 11.2.6.5. Financials (Based on Availability)
- 11.2.7 Korg
- 11.2.7.1. Overview
- 11.2.7.2. Products
- 11.2.7.3. SWOT Analysis
- 11.2.7.4. Recent Developments
- 11.2.7.5. Financials (Based on Availability)
- 11.2.8 Hughes & Kettner
- 11.2.8.1. Overview
- 11.2.8.2. Products
- 11.2.8.3. SWOT Analysis
- 11.2.8.4. Recent Developments
- 11.2.8.5. Financials (Based on Availability)
- 11.2.9 Orange
- 11.2.9.1. Overview
- 11.2.9.2. Products
- 11.2.9.3. SWOT Analysis
- 11.2.9.4. Recent Developments
- 11.2.9.5. Financials (Based on Availability)
- 11.2.10 Laney
- 11.2.10.1. Overview
- 11.2.10.2. Products
- 11.2.10.3. SWOT Analysis
- 11.2.10.4. Recent Developments
- 11.2.10.5. Financials (Based on Availability)
- 11.2.11 Fishman
- 11.2.11.1. Overview
- 11.2.11.2. Products
- 11.2.11.3. SWOT Analysis
- 11.2.11.4. Recent Developments
- 11.2.11.5. Financials (Based on Availability)
- 11.2.12 Rivera
- 11.2.12.1. Overview
- 11.2.12.2. Products
- 11.2.12.3. SWOT Analysis
- 11.2.12.4. Recent Developments
- 11.2.12.5. Financials (Based on Availability)
- 11.2.13 MESA/Boogie
- 11.2.13.1. Overview
- 11.2.13.2. Products
- 11.2.13.3. SWOT Analysis
- 11.2.13.4. Recent Developments
- 11.2.13.5. Financials (Based on Availability)
- 11.2.14 Acoustic
- 11.2.14.1. Overview
- 11.2.14.2. Products
- 11.2.14.3. SWOT Analysis
- 11.2.14.4. Recent Developments
- 11.2.14.5. Financials (Based on Availability)
- 11.2.15 Randall
- 11.2.15.1. Overview
- 11.2.15.2. Products
- 11.2.15.3. SWOT Analysis
- 11.2.15.4. Recent Developments
- 11.2.15.5. Financials (Based on Availability)
- 11.2.16 Henriksen
- 11.2.16.1. Overview
- 11.2.16.2. Products
- 11.2.16.3. SWOT Analysis
- 11.2.16.4. Recent Developments
- 11.2.16.5. Financials (Based on Availability)
- 11.2.1 Yamaha(Ampeg)
List of Figures
- Figure 1: Global Electronic Musical Instrument Signal Amplifier Revenue Breakdown (million, %) by Region 2024 & 2032
- Figure 2: Global Electronic Musical Instrument Signal Amplifier Volume Breakdown (K, %) by Region 2024 & 2032
- Figure 3: North America Electronic Musical Instrument Signal Amplifier Revenue (million), by Application 2024 & 2032
- Figure 4: North America Electronic Musical Instrument Signal Amplifier Volume (K), by Application 2024 & 2032
- Figure 5: North America Electronic Musical Instrument Signal Amplifier Revenue Share (%), by Application 2024 & 2032
- Figure 6: North America Electronic Musical Instrument Signal Amplifier Volume Share (%), by Application 2024 & 2032
- Figure 7: North America Electronic Musical Instrument Signal Amplifier Revenue (million), by Types 2024 & 2032
- Figure 8: North America Electronic Musical Instrument Signal Amplifier Volume (K), by Types 2024 & 2032
- Figure 9: North America Electronic Musical Instrument Signal Amplifier Revenue Share (%), by Types 2024 & 2032
- Figure 10: North America Electronic Musical Instrument Signal Amplifier Volume Share (%), by Types 2024 & 2032
- Figure 11: North America Electronic Musical Instrument Signal Amplifier Revenue (million), by Country 2024 & 2032
- Figure 12: North America Electronic Musical Instrument Signal Amplifier Volume (K), by Country 2024 & 2032
- Figure 13: North America Electronic Musical Instrument Signal Amplifier Revenue Share (%), by Country 2024 & 2032
- Figure 14: North America Electronic Musical Instrument Signal Amplifier Volume Share (%), by Country 2024 & 2032
- Figure 15: South America Electronic Musical Instrument Signal Amplifier Revenue (million), by Application 2024 & 2032
- Figure 16: South America Electronic Musical Instrument Signal Amplifier Volume (K), by Application 2024 & 2032
- Figure 17: South America Electronic Musical Instrument Signal Amplifier Revenue Share (%), by Application 2024 & 2032
- Figure 18: South America Electronic Musical Instrument Signal Amplifier Volume Share (%), by Application 2024 & 2032
- Figure 19: South America Electronic Musical Instrument Signal Amplifier Revenue (million), by Types 2024 & 2032
- Figure 20: South America Electronic Musical Instrument Signal Amplifier Volume (K), by Types 2024 & 2032
- Figure 21: South America Electronic Musical Instrument Signal Amplifier Revenue Share (%), by Types 2024 & 2032
- Figure 22: South America Electronic Musical Instrument Signal Amplifier Volume Share (%), by Types 2024 & 2032
- Figure 23: South America Electronic Musical Instrument Signal Amplifier Revenue (million), by Country 2024 & 2032
- Figure 24: South America Electronic Musical Instrument Signal Amplifier Volume (K), by Country 2024 & 2032
- Figure 25: South America Electronic Musical Instrument Signal Amplifier Revenue Share (%), by Country 2024 & 2032
- Figure 26: South America Electronic Musical Instrument Signal Amplifier Volume Share (%), by Country 2024 & 2032
- Figure 27: Europe Electronic Musical Instrument Signal Amplifier Revenue (million), by Application 2024 & 2032
- Figure 28: Europe Electronic Musical Instrument Signal Amplifier Volume (K), by Application 2024 & 2032
- Figure 29: Europe Electronic Musical Instrument Signal Amplifier Revenue Share (%), by Application 2024 & 2032
- Figure 30: Europe Electronic Musical Instrument Signal Amplifier Volume Share (%), by Application 2024 & 2032
- Figure 31: Europe Electronic Musical Instrument Signal Amplifier Revenue (million), by Types 2024 & 2032
- Figure 32: Europe Electronic Musical Instrument Signal Amplifier Volume (K), by Types 2024 & 2032
- Figure 33: Europe Electronic Musical Instrument Signal Amplifier Revenue Share (%), by Types 2024 & 2032
- Figure 34: Europe Electronic Musical Instrument Signal Amplifier Volume Share (%), by Types 2024 & 2032
- Figure 35: Europe Electronic Musical Instrument Signal Amplifier Revenue (million), by Country 2024 & 2032
- Figure 36: Europe Electronic Musical Instrument Signal Amplifier Volume (K), by Country 2024 & 2032
- Figure 37: Europe Electronic Musical Instrument Signal Amplifier Revenue Share (%), by Country 2024 & 2032
- Figure 38: Europe Electronic Musical Instrument Signal Amplifier Volume Share (%), by Country 2024 & 2032
- Figure 39: Middle East & Africa Electronic Musical Instrument Signal Amplifier Revenue (million), by Application 2024 & 2032
- Figure 40: Middle East & Africa Electronic Musical Instrument Signal Amplifier Volume (K), by Application 2024 & 2032
- Figure 41: Middle East & Africa Electronic Musical Instrument Signal Amplifier Revenue Share (%), by Application 2024 & 2032
- Figure 42: Middle East & Africa Electronic Musical Instrument Signal Amplifier Volume Share (%), by Application 2024 & 2032
- Figure 43: Middle East & Africa Electronic Musical Instrument Signal Amplifier Revenue (million), by Types 2024 & 2032
- Figure 44: Middle East & Africa Electronic Musical Instrument Signal Amplifier Volume (K), by Types 2024 & 2032
- Figure 45: Middle East & Africa Electronic Musical Instrument Signal Amplifier Revenue Share (%), by Types 2024 & 2032
- Figure 46: Middle East & Africa Electronic Musical Instrument Signal Amplifier Volume Share (%), by Types 2024 & 2032
- Figure 47: Middle East & Africa Electronic Musical Instrument Signal Amplifier Revenue (million), by Country 2024 & 2032
- Figure 48: Middle East & Africa Electronic Musical Instrument Signal Amplifier Volume (K), by Country 2024 & 2032
- Figure 49: Middle East & Africa Electronic Musical Instrument Signal Amplifier Revenue Share (%), by Country 2024 & 2032
- Figure 50: Middle East & Africa Electronic Musical Instrument Signal Amplifier Volume Share (%), by Country 2024 & 2032
- Figure 51: Asia Pacific Electronic Musical Instrument Signal Amplifier Revenue (million), by Application 2024 & 2032
- Figure 52: Asia Pacific Electronic Musical Instrument Signal Amplifier Volume (K), by Application 2024 & 2032
- Figure 53: Asia Pacific Electronic Musical Instrument Signal Amplifier Revenue Share (%), by Application 2024 & 2032
- Figure 54: Asia Pacific Electronic Musical Instrument Signal Amplifier Volume Share (%), by Application 2024 & 2032
- Figure 55: Asia Pacific Electronic Musical Instrument Signal Amplifier Revenue (million), by Types 2024 & 2032
- Figure 56: Asia Pacific Electronic Musical Instrument Signal Amplifier Volume (K), by Types 2024 & 2032
- Figure 57: Asia Pacific Electronic Musical Instrument Signal Amplifier Revenue Share (%), by Types 2024 & 2032
- Figure 58: Asia Pacific Electronic Musical Instrument Signal Amplifier Volume Share (%), by Types 2024 & 2032
- Figure 59: Asia Pacific Electronic Musical Instrument Signal Amplifier Revenue (million), by Country 2024 & 2032
- Figure 60: Asia Pacific Electronic Musical Instrument Signal Amplifier Volume (K), by Country 2024 & 2032
- Figure 61: Asia Pacific Electronic Musical Instrument Signal Amplifier Revenue Share (%), by Country 2024 & 2032
- Figure 62: Asia Pacific Electronic Musical Instrument Signal Amplifier Volume Share (%), by Country 2024 & 2032
List of Tables
- Table 1: Global Electronic Musical Instrument Signal Amplifier Revenue million Forecast, by Region 2019 & 2032
- Table 2: Global Electronic Musical Instrument Signal Amplifier Volume K Forecast, by Region 2019 & 2032
- Table 3: Global Electronic Musical Instrument Signal Amplifier Revenue million Forecast, by Application 2019 & 2032
- Table 4: Global Electronic Musical Instrument Signal Amplifier Volume K Forecast, by Application 2019 & 2032
- Table 5: Global Electronic Musical Instrument Signal Amplifier Revenue million Forecast, by Types 2019 & 2032
- Table 6: Global Electronic Musical Instrument Signal Amplifier Volume K Forecast, by Types 2019 & 2032
- Table 7: Global Electronic Musical Instrument Signal Amplifier Revenue million Forecast, by Region 2019 & 2032
- Table 8: Global Electronic Musical Instrument Signal Amplifier Volume K Forecast, by Region 2019 & 2032
- Table 9: Global Electronic Musical Instrument Signal Amplifier Revenue million Forecast, by Application 2019 & 2032
- Table 10: Global Electronic Musical Instrument Signal Amplifier Volume K Forecast, by Application 2019 & 2032
- Table 11: Global Electronic Musical Instrument Signal Amplifier Revenue million Forecast, by Types 2019 & 2032
- Table 12: Global Electronic Musical Instrument Signal Amplifier Volume K Forecast, by Types 2019 & 2032
- Table 13: Global Electronic Musical Instrument Signal Amplifier Revenue million Forecast, by Country 2019 & 2032
- Table 14: Global Electronic Musical Instrument Signal Amplifier Volume K Forecast, by Country 2019 & 2032
- Table 15: United States Electronic Musical Instrument Signal Amplifier Revenue (million) Forecast, by Application 2019 & 2032
- Table 16: United States Electronic Musical Instrument Signal Amplifier Volume (K) Forecast, by Application 2019 & 2032
- Table 17: Canada Electronic Musical Instrument Signal Amplifier Revenue (million) Forecast, by Application 2019 & 2032
- Table 18: Canada Electronic Musical Instrument Signal Amplifier Volume (K) Forecast, by Application 2019 & 2032
- Table 19: Mexico Electronic Musical Instrument Signal Amplifier Revenue (million) Forecast, by Application 2019 & 2032
- Table 20: Mexico Electronic Musical Instrument Signal Amplifier Volume (K) Forecast, by Application 2019 & 2032
- Table 21: Global Electronic Musical Instrument Signal Amplifier Revenue million Forecast, by Application 2019 & 2032
- Table 22: Global Electronic Musical Instrument Signal Amplifier Volume K Forecast, by Application 2019 & 2032
- Table 23: Global Electronic Musical Instrument Signal Amplifier Revenue million Forecast, by Types 2019 & 2032
- Table 24: Global Electronic Musical Instrument Signal Amplifier Volume K Forecast, by Types 2019 & 2032
- Table 25: Global Electronic Musical Instrument Signal Amplifier Revenue million Forecast, by Country 2019 & 2032
- Table 26: Global Electronic Musical Instrument Signal Amplifier Volume K Forecast, by Country 2019 & 2032
- Table 27: Brazil Electronic Musical Instrument Signal Amplifier Revenue (million) Forecast, by Application 2019 & 2032
- Table 28: Brazil Electronic Musical Instrument Signal Amplifier Volume (K) Forecast, by Application 2019 & 2032
- Table 29: Argentina Electronic Musical Instrument Signal Amplifier Revenue (million) Forecast, by Application 2019 & 2032
- Table 30: Argentina Electronic Musical Instrument Signal Amplifier Volume (K) Forecast, by Application 2019 & 2032
- Table 31: Rest of South America Electronic Musical Instrument Signal Amplifier Revenue (million) Forecast, by Application 2019 & 2032
- Table 32: Rest of South America Electronic Musical Instrument Signal Amplifier Volume (K) Forecast, by Application 2019 & 2032
- Table 33: Global Electronic Musical Instrument Signal Amplifier Revenue million Forecast, by Application 2019 & 2032
- Table 34: Global Electronic Musical Instrument Signal Amplifier Volume K Forecast, by Application 2019 & 2032
- Table 35: Global Electronic Musical Instrument Signal Amplifier Revenue million Forecast, by Types 2019 & 2032
- Table 36: Global Electronic Musical Instrument Signal Amplifier Volume K Forecast, by Types 2019 & 2032
- Table 37: Global Electronic Musical Instrument Signal Amplifier Revenue million Forecast, by Country 2019 & 2032
- Table 38: Global Electronic Musical Instrument Signal Amplifier Volume K Forecast, by Country 2019 & 2032
- Table 39: United Kingdom Electronic Musical Instrument Signal Amplifier Revenue (million) Forecast, by Application 2019 & 2032
- Table 40: United Kingdom Electronic Musical Instrument Signal Amplifier Volume (K) Forecast, by Application 2019 & 2032
- Table 41: Germany Electronic Musical Instrument Signal Amplifier Revenue (million) Forecast, by Application 2019 & 2032
- Table 42: Germany Electronic Musical Instrument Signal Amplifier Volume (K) Forecast, by Application 2019 & 2032
- Table 43: France Electronic Musical Instrument Signal Amplifier Revenue (million) Forecast, by Application 2019 & 2032
- Table 44: France Electronic Musical Instrument Signal Amplifier Volume (K) Forecast, by Application 2019 & 2032
- Table 45: Italy Electronic Musical Instrument Signal Amplifier Revenue (million) Forecast, by Application 2019 & 2032
- Table 46: Italy Electronic Musical Instrument Signal Amplifier Volume (K) Forecast, by Application 2019 & 2032
- Table 47: Spain Electronic Musical Instrument Signal Amplifier Revenue (million) Forecast, by Application 2019 & 2032
- Table 48: Spain Electronic Musical Instrument Signal Amplifier Volume (K) Forecast, by Application 2019 & 2032
- Table 49: Russia Electronic Musical Instrument Signal Amplifier Revenue (million) Forecast, by Application 2019 & 2032
- Table 50: Russia Electronic Musical Instrument Signal Amplifier Volume (K) Forecast, by Application 2019 & 2032
- Table 51: Benelux Electronic Musical Instrument Signal Amplifier Revenue (million) Forecast, by Application 2019 & 2032
- Table 52: Benelux Electronic Musical Instrument Signal Amplifier Volume (K) Forecast, by Application 2019 & 2032
- Table 53: Nordics Electronic Musical Instrument Signal Amplifier Revenue (million) Forecast, by Application 2019 & 2032
- Table 54: Nordics Electronic Musical Instrument Signal Amplifier Volume (K) Forecast, by Application 2019 & 2032
- Table 55: Rest of Europe Electronic Musical Instrument Signal Amplifier Revenue (million) Forecast, by Application 2019 & 2032
- Table 56: Rest of Europe Electronic Musical Instrument Signal Amplifier Volume (K) Forecast, by Application 2019 & 2032
- Table 57: Global Electronic Musical Instrument Signal Amplifier Revenue million Forecast, by Application 2019 & 2032
- Table 58: Global Electronic Musical Instrument Signal Amplifier Volume K Forecast, by Application 2019 & 2032
- Table 59: Global Electronic Musical Instrument Signal Amplifier Revenue million Forecast, by Types 2019 & 2032
- Table 60: Global Electronic Musical Instrument Signal Amplifier Volume K Forecast, by Types 2019 & 2032
- Table 61: Global Electronic Musical Instrument Signal Amplifier Revenue million Forecast, by Country 2019 & 2032
- Table 62: Global Electronic Musical Instrument Signal Amplifier Volume K Forecast, by Country 2019 & 2032
- Table 63: Turkey Electronic Musical Instrument Signal Amplifier Revenue (million) Forecast, by Application 2019 & 2032
- Table 64: Turkey Electronic Musical Instrument Signal Amplifier Volume (K) Forecast, by Application 2019 & 2032
- Table 65: Israel Electronic Musical Instrument Signal Amplifier Revenue (million) Forecast, by Application 2019 & 2032
- Table 66: Israel Electronic Musical Instrument Signal Amplifier Volume (K) Forecast, by Application 2019 & 2032
- Table 67: GCC Electronic Musical Instrument Signal Amplifier Revenue (million) Forecast, by Application 2019 & 2032
- Table 68: GCC Electronic Musical Instrument Signal Amplifier Volume (K) Forecast, by Application 2019 & 2032
- Table 69: North Africa Electronic Musical Instrument Signal Amplifier Revenue (million) Forecast, by Application 2019 & 2032
- Table 70: North Africa Electronic Musical Instrument Signal Amplifier Volume (K) Forecast, by Application 2019 & 2032
- Table 71: South Africa Electronic Musical Instrument Signal Amplifier Revenue (million) Forecast, by Application 2019 & 2032
- Table 72: South Africa Electronic Musical Instrument Signal Amplifier Volume (K) Forecast, by Application 2019 & 2032
- Table 73: Rest of Middle East & Africa Electronic Musical Instrument Signal Amplifier Revenue (million) Forecast, by Application 2019 & 2032
- Table 74: Rest of Middle East & Africa Electronic Musical Instrument Signal Amplifier Volume (K) Forecast, by Application 2019 & 2032
- Table 75: Global Electronic Musical Instrument Signal Amplifier Revenue million Forecast, by Application 2019 & 2032
- Table 76: Global Electronic Musical Instrument Signal Amplifier Volume K Forecast, by Application 2019 & 2032
- Table 77: Global Electronic Musical Instrument Signal Amplifier Revenue million Forecast, by Types 2019 & 2032
- Table 78: Global Electronic Musical Instrument Signal Amplifier Volume K Forecast, by Types 2019 & 2032
- Table 79: Global Electronic Musical Instrument Signal Amplifier Revenue million Forecast, by Country 2019 & 2032
- Table 80: Global Electronic Musical Instrument Signal Amplifier Volume K Forecast, by Country 2019 & 2032
- Table 81: China Electronic Musical Instrument Signal Amplifier Revenue (million) Forecast, by Application 2019 & 2032
- Table 82: China Electronic Musical Instrument Signal Amplifier Volume (K) Forecast, by Application 2019 & 2032
- Table 83: India Electronic Musical Instrument Signal Amplifier Revenue (million) Forecast, by Application 2019 & 2032
- Table 84: India Electronic Musical Instrument Signal Amplifier Volume (K) Forecast, by Application 2019 & 2032
- Table 85: Japan Electronic Musical Instrument Signal Amplifier Revenue (million) Forecast, by Application 2019 & 2032
- Table 86: Japan Electronic Musical Instrument Signal Amplifier Volume (K) Forecast, by Application 2019 & 2032
- Table 87: South Korea Electronic Musical Instrument Signal Amplifier Revenue (million) Forecast, by Application 2019 & 2032
- Table 88: South Korea Electronic Musical Instrument Signal Amplifier Volume (K) Forecast, by Application 2019 & 2032
- Table 89: ASEAN Electronic Musical Instrument Signal Amplifier Revenue (million) Forecast, by Application 2019 & 2032
- Table 90: ASEAN Electronic Musical Instrument Signal Amplifier Volume (K) Forecast, by Application 2019 & 2032
- Table 91: Oceania Electronic Musical Instrument Signal Amplifier Revenue (million) Forecast, by Application 2019 & 2032
- Table 92: Oceania Electronic Musical Instrument Signal Amplifier Volume (K) Forecast, by Application 2019 & 2032
- Table 93: Rest of Asia Pacific Electronic Musical Instrument Signal Amplifier Revenue (million) Forecast, by Application 2019 & 2032
- Table 94: Rest of Asia Pacific Electronic Musical Instrument Signal Amplifier Volume (K) Forecast, by Application 2019 & 2032
Frequently Asked Questions
1. What is the projected Compound Annual Growth Rate (CAGR) of the Electronic Musical Instrument Signal Amplifier?
The projected CAGR is approximately XX%.
2. Which companies are prominent players in the Electronic Musical Instrument Signal Amplifier?
Key companies in the market include Yamaha(Ampeg), Roland, Marshall, Blackstar, Behringer, Fender, Korg, Hughes & Kettner, Orange, Laney, Fishman, Rivera, MESA/Boogie, Acoustic, Randall, Henriksen.
3. What are the main segments of the Electronic Musical Instrument Signal Amplifier?
The market segments include Application, Types.
4. Can you provide details about the market size?
The market size is estimated to be USD XXX million as of 2022.
5. What are some drivers contributing to market growth?
N/A
6. What are the notable trends driving market growth?
N/A
7. Are there any restraints impacting market growth?
N/A
8. Can you provide examples of recent developments in the market?
N/A
9. What pricing options are available for accessing the report?
Pricing options include single-user, multi-user, and enterprise licenses priced at USD 3950.00, USD 5925.00, and USD 7900.00 respectively.
10. Is the market size provided in terms of value or volume?
The market size is provided in terms of value, measured in million and volume, measured in K.
11. Are there any specific market keywords associated with the report?
Yes, the market keyword associated with the report is "Electronic Musical Instrument Signal Amplifier," which aids in identifying and referencing the specific market segment covered.
12. How do I determine which pricing option suits my needs best?
The pricing options vary based on user requirements and access needs. Individual users may opt for single-user licenses, while businesses requiring broader access may choose multi-user or enterprise licenses for cost-effective access to the report.
13. Are there any additional resources or data provided in the Electronic Musical Instrument Signal Amplifier report?
While the report offers comprehensive insights, it's advisable to review the specific contents or supplementary materials provided to ascertain if additional resources or data are available.
14. How can I stay updated on further developments or reports in the Electronic Musical Instrument Signal Amplifier?
To stay informed about further developments, trends, and reports in the Electronic Musical Instrument Signal Amplifier, consider subscribing to industry newsletters, following relevant companies and organizations, or regularly checking reputable industry news sources and publications.
Methodology
Step 1 - Identification of Relevant Samples Size from Population Database


Step 2 - Approaches for Defining Global Market Size (Value, Volume* & Price*)

Note*: In applicable scenarios
Step 3 - Data Sources
Primary Research
- Web Analytics
- Survey Reports
- Research Institute
- Latest Research Reports
- Opinion Leaders
Secondary Research
- Annual Reports
- White Paper
- Latest Press Release
- Industry Association
- Paid Database
- Investor Presentations

Step 4 - Data Triangulation
Involves using different sources of information in order to increase the validity of a study
These sources are likely to be stakeholders in a program - participants, other researchers, program staff, other community members, and so on.
Then we put all data in single framework & apply various statistical tools to find out the dynamic on the market.
During the analysis stage, feedback from the stakeholder groups would be compared to determine areas of agreement as well as areas of divergence
