

Key Insights
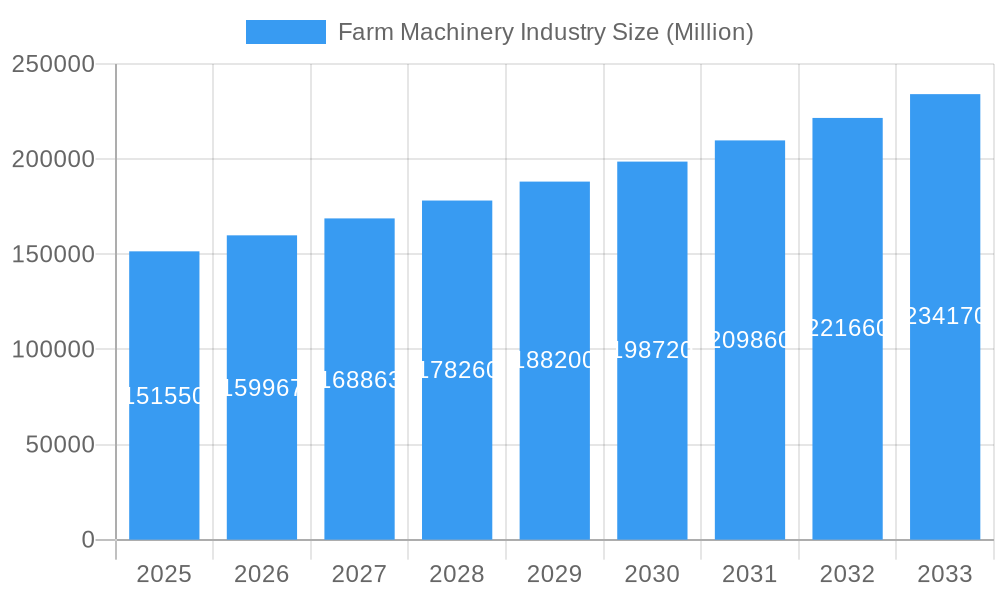
The global farm machinery market, valued at $151.55 billion in 2025, is projected to experience robust growth, exhibiting a Compound Annual Growth Rate (CAGR) of 5.40% from 2025 to 2033. This expansion is driven by several key factors. Increasing global population necessitates higher agricultural output, fueling demand for efficient and technologically advanced farm machinery. Precision farming techniques, incorporating GPS, sensors, and data analytics, are gaining traction, leading to improved yields and resource management, thus boosting investment in sophisticated equipment. Furthermore, government initiatives promoting agricultural modernization and mechanization in developing economies are significantly contributing to market growth. The market is segmented by machinery type (tractors – including compact utility, utility, and row crop – and plowing/cultivating machinery) and horsepower (less than 40 HP, 40-99 HP, and greater than 100 HP), allowing for a granular understanding of specific market segments and their growth trajectories. Key players like Deere & Company, Mahindra & Mahindra Limited, Kubota Corporation, and CNH Industrial NV are driving innovation and competition, constantly upgrading their product offerings to cater to evolving farmer needs and technological advancements.
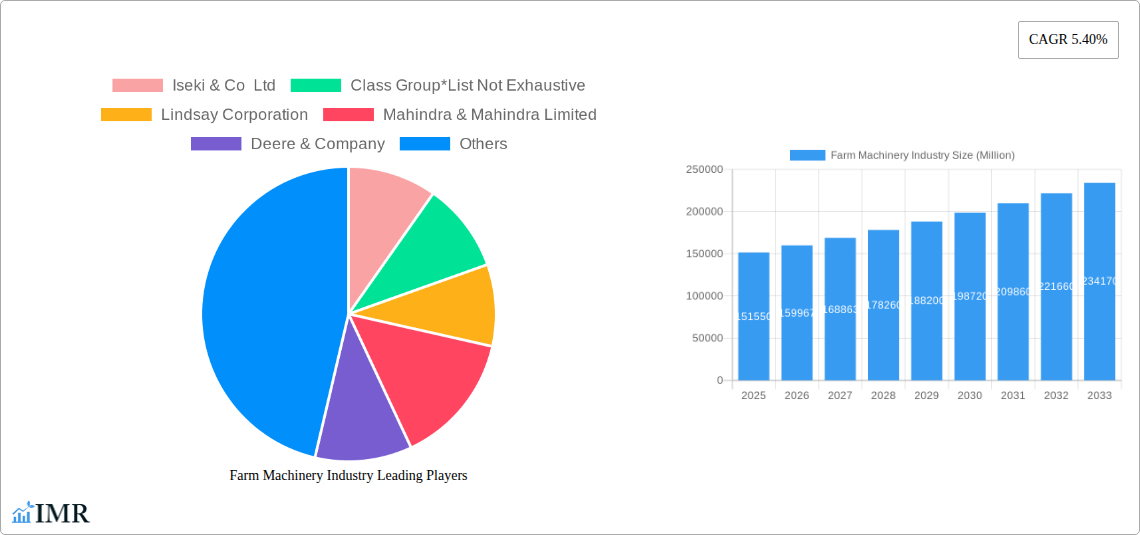
Farm Machinery Industry Market Size (In Billion)
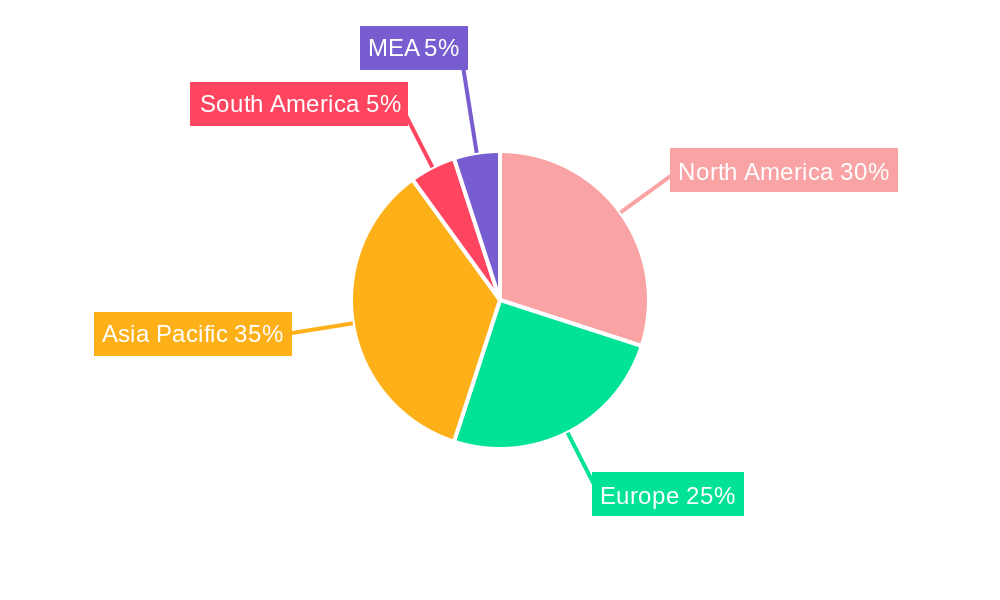
Regional variations in market growth are expected, with North America and Europe maintaining strong positions due to high agricultural productivity and established mechanization practices. However, the Asia-Pacific region, particularly India and China, is anticipated to demonstrate significant growth potential due to increasing agricultural land under cultivation and rising farmer incomes leading to increased investment in farm equipment. South America and the Middle East and Africa are also expected to contribute to market growth, albeit at a slower pace, as mechanization adoption continues to increase in these regions. Challenges such as fluctuating commodity prices, high initial investment costs for advanced machinery, and dependence on fuel prices could potentially moderate market growth, but these are expected to be offset by the long-term positive trends driving the sector. The market's future hinges on continued technological innovation, supportive government policies, and the evolving needs of a global population that demands greater food security.
Farm Machinery Industry Company Market Share
Farm Machinery Industry Market Report: 2019-2033
This comprehensive report provides an in-depth analysis of the global farm machinery industry, covering market dynamics, growth trends, regional performance, product landscape, and key players. With a study period spanning 2019-2033 (base year 2025, forecast period 2025-2033), this report is an essential resource for industry professionals, investors, and stakeholders seeking to understand and capitalize on opportunities within this dynamic sector. The report analyzes parent markets (Agricultural Machinery) and child markets (Tractors, Harvesting Equipment, etc.) to provide a complete overview. Market values are presented in million units.
Farm Machinery Industry Market Dynamics & Structure
The global farm machinery market is characterized by moderate concentration, with several multinational corporations holding significant market share. Technological innovation, driven by the need for increased efficiency and sustainability, is a key driver. Stringent regulatory frameworks regarding emissions and safety standards influence product development and market access. Competitive product substitutes, including digital farming technologies, present both challenges and opportunities. End-user demographics, particularly the increasing adoption of precision agriculture techniques by larger farms, shape market demand. The historical period (2019-2024) witnessed xx M&A deals, indicating a trend of consolidation within the industry.
- Market Concentration: Moderately concentrated, with top 5 players holding xx% market share (2024).
- Technological Innovation: Precision agriculture, automation, and electrification are major drivers.
- Regulatory Landscape: Stringent emission and safety standards impact product development.
- Competitive Substitutes: Digital farming technologies and alternative cultivation methods pose challenges.
- End-User Demographics: Large-scale farms drive demand for high-horsepower machinery.
- M&A Activity: xx M&A deals observed during 2019-2024, indicating industry consolidation.
Farm Machinery Industry Growth Trends & Insights
The global farm machinery market exhibited a CAGR of xx% during the historical period (2019-2024), reaching a market size of xx million units in 2024. This growth is attributed to several factors, including rising global food demand, increasing farm sizes, and government initiatives promoting agricultural modernization. Adoption rates for advanced technologies like GPS-guided machinery and automated systems are steadily increasing, though penetration remains relatively low in developing regions. Consumer behavior is shifting towards precision agriculture practices, leading to a higher demand for sophisticated, data-driven equipment. The forecast period (2025-2033) projects a CAGR of xx%, driven by technological advancements and expanding agricultural operations globally.
Dominant Regions, Countries, or Segments in Farm Machinery Industry
North America and Europe currently dominate the farm machinery market, accounting for xx% and xx% of global sales respectively in 2024. However, the Asia-Pacific region is poised for significant growth, driven by increasing agricultural activity and government support for modernizing the agricultural sector. Within the product segments, tractors (xx million units in 2024) represent the largest market share, followed by plowing and cultivating machinery (xx million units in 2024). High-horsepower tractors (>100 HP) are experiencing robust growth, reflecting the trend towards large-scale farming operations.
- Key Drivers:
- North America: High farm incomes, advanced agricultural practices.
- Europe: Government subsidies for agricultural modernization, high mechanization levels.
- Asia-Pacific: Rising food demand, government investments in agricultural infrastructure.
- Dominant Segments: Tractors (all types) and plowing & cultivating machinery. High-horsepower tractors showing strongest growth.
Farm Machinery Industry Product Landscape
The farm machinery market is witnessing continuous innovation, with manufacturers focusing on enhancing machine efficiency, precision, and automation. Products are increasingly incorporating advanced technologies such as GPS, sensors, and data analytics to optimize operations and reduce input costs. Unique selling propositions often center on improved fuel efficiency, enhanced operator comfort, and integrated precision farming capabilities. Recent innovations include electric and autonomous machinery designed to improve sustainability and reduce labor costs.
Key Drivers, Barriers & Challenges in Farm Machinery Industry
Key Drivers:
- Increasing global food demand
- Growing farm sizes and consolidation
- Government initiatives supporting agricultural modernization
- Technological advancements (automation, precision agriculture)
Key Challenges:
- High initial investment costs for advanced machinery
- Volatility in commodity prices affecting farmer investment decisions
- Supply chain disruptions impacting production and delivery timelines
- Stringent environmental regulations imposing higher manufacturing costs. Estimated xx% increase in production costs due to new emission regulations by 2030.
Emerging Opportunities in Farm Machinery Industry
- Growing demand for sustainable and environmentally friendly farm equipment
- Expansion into emerging markets with high agricultural potential
- Development of precision farming solutions for specific crops and farming practices
- Integration of data analytics and AI to improve farm management decisions.
Growth Accelerators in the Farm Machinery Industry
Technological advancements such as AI-powered decision support systems, autonomous machinery, and the increasing adoption of electric and alternative fuel technologies are key catalysts for long-term growth. Strategic partnerships between farm machinery manufacturers and technology companies are also creating new opportunities. Expanding into underserved markets and providing tailored solutions for specific agricultural needs are further growth drivers.
Key Players Shaping the Farm Machinery Industry Market
Notable Milestones in Farm Machinery Industry Sector
- February 2024: John Deere and GUSS Automation unveiled the Electric GUSS, the world's first fully electric autonomous herbicide orchard sprayer.
- February 2024: John Deere launched a wide range of autonomy-ready agriculture equipment at the Commodity Classic trade show.
- February 2024: Mahindra introduced 2 new sub-compact and compact tractor models at the National Farm Machinery Show.
In-Depth Farm Machinery Industry Market Outlook
The farm machinery market is poised for sustained growth, driven by technological innovation, expanding agricultural operations, and a global focus on enhancing agricultural efficiency and sustainability. Strategic partnerships, investments in research and development, and the expansion into emerging markets present significant opportunities for market players. The continued adoption of precision agriculture technologies and the development of autonomous and electric machinery will shape the future of the industry, fostering both growth and increased efficiency in farming practices.
Farm Machinery Industry Segmentation
- 1. Production Analysis
- 2. Consumption Analysis
- 3. Import Market Analysis (Value & Volume)
- 4. Export Market Analysis (Value & Volume)
- 5. Price Trend Analysis
Farm Machinery Industry Segmentation By Geography
-
1. North America
- 1.1. United States
- 1.2. Canada
- 1.3. Mexico
-
2. South America
- 2.1. Brazil
- 2.2. Argentina
- 2.3. Rest of South America
-
3. Europe
- 3.1. United Kingdom
- 3.2. Germany
- 3.3. France
- 3.4. Italy
- 3.5. Spain
- 3.6. Russia
- 3.7. Benelux
- 3.8. Nordics
- 3.9. Rest of Europe
-
4. Middle East & Africa
- 4.1. Turkey
- 4.2. Israel
- 4.3. GCC
- 4.4. North Africa
- 4.5. South Africa
- 4.6. Rest of Middle East & Africa
-
5. Asia Pacific
- 5.1. China
- 5.2. India
- 5.3. Japan
- 5.4. South Korea
- 5.5. ASEAN
- 5.6. Oceania
- 5.7. Rest of Asia Pacific
Farm Machinery Industry Regional Market Share
Geographic Coverage of Farm Machinery Industry
Farm Machinery Industry REPORT HIGHLIGHTS
| Aspects | Details |
|---|---|
| Study Period | 2020-2034 |
| Base Year | 2025 |
| Estimated Year | 2026 |
| Forecast Period | 2026-2034 |
| Historical Period | 2020-2025 |
| Growth Rate | CAGR of 5.40% from 2020-2034 |
| Segmentation |
|
Table of Contents
- 1. Introduction
- 1.1. Research Scope
- 1.2. Market Segmentation
- 1.3. Research Objective
- 1.4. Definitions and Assumptions
- 2. Executive Summary
- 2.1. Market Snapshot
- 3. Market Dynamics
- 3.1. Market Drivers
- 3.2. Market Restrains
- 3.3. Market Trends
- 3.4. Market Opportunities
- 4. Market Factor Analysis
- 4.1. Porters Five Forces
- 4.1.1. Bargaining Power of Suppliers
- 4.1.2. Bargaining Power of Buyers
- 4.1.3. Threat of New Entrants
- 4.1.4. Threat of Substitutes
- 4.1.5. Competitive Rivalry
- 4.2. PESTEL analysis
- 4.3. BCG Analysis
- 4.3.1. Stars (High Growth, High Market Share)
- 4.3.2. Cash Cows (Low Growth, High Market Share)
- 4.3.3. Question Mark (High Growth, Low Market Share)
- 4.3.4. Dogs (Low Growth, Low Market Share)
- 4.4. Ansoff Matrix Analysis
- 4.5. Supply Chain Analysis
- 4.6. Regulatory Landscape
- 4.7. Current Market Potential and Opportunity Assessment (TAM–SAM–SOM Framework)
- 4.8. IMR Analyst Note
- 4.1. Porters Five Forces
- 5. Market Analysis, Insights and Forecast 2021-2033
- 5.1. Market Analysis, Insights and Forecast - by Production Analysis
- 5.2. Market Analysis, Insights and Forecast - by Consumption Analysis
- 5.3. Market Analysis, Insights and Forecast - by Import Market Analysis (Value & Volume)
- 5.4. Market Analysis, Insights and Forecast - by Export Market Analysis (Value & Volume)
- 5.5. Market Analysis, Insights and Forecast - by Price Trend Analysis
- 5.6. Market Analysis, Insights and Forecast - by Region
- 5.6.1. North America
- 5.6.2. South America
- 5.6.3. Europe
- 5.6.4. Middle East & Africa
- 5.6.5. Asia Pacific
- 6. Global Farm Machinery Industry Analysis, Insights and Forecast, 2021-2033
- 6.1. Market Analysis, Insights and Forecast - by Production Analysis
- 6.2. Market Analysis, Insights and Forecast - by Consumption Analysis
- 6.3. Market Analysis, Insights and Forecast - by Import Market Analysis (Value & Volume)
- 6.4. Market Analysis, Insights and Forecast - by Export Market Analysis (Value & Volume)
- 6.5. Market Analysis, Insights and Forecast - by Price Trend Analysis
- 7. North America Farm Machinery Industry Analysis, Insights and Forecast, 2020-2032
- 7.1. Market Analysis, Insights and Forecast - by Production Analysis
- 7.2. Market Analysis, Insights and Forecast - by Consumption Analysis
- 7.3. Market Analysis, Insights and Forecast - by Import Market Analysis (Value & Volume)
- 7.4. Market Analysis, Insights and Forecast - by Export Market Analysis (Value & Volume)
- 7.5. Market Analysis, Insights and Forecast - by Price Trend Analysis
- 8. South America Farm Machinery Industry Analysis, Insights and Forecast, 2020-2032
- 8.1. Market Analysis, Insights and Forecast - by Production Analysis
- 8.2. Market Analysis, Insights and Forecast - by Consumption Analysis
- 8.3. Market Analysis, Insights and Forecast - by Import Market Analysis (Value & Volume)
- 8.4. Market Analysis, Insights and Forecast - by Export Market Analysis (Value & Volume)
- 8.5. Market Analysis, Insights and Forecast - by Price Trend Analysis
- 9. Europe Farm Machinery Industry Analysis, Insights and Forecast, 2020-2032
- 9.1. Market Analysis, Insights and Forecast - by Production Analysis
- 9.2. Market Analysis, Insights and Forecast - by Consumption Analysis
- 9.3. Market Analysis, Insights and Forecast - by Import Market Analysis (Value & Volume)
- 9.4. Market Analysis, Insights and Forecast - by Export Market Analysis (Value & Volume)
- 9.5. Market Analysis, Insights and Forecast - by Price Trend Analysis
- 10. Middle East & Africa Farm Machinery Industry Analysis, Insights and Forecast, 2020-2032
- 10.1. Market Analysis, Insights and Forecast - by Production Analysis
- 10.2. Market Analysis, Insights and Forecast - by Consumption Analysis
- 10.3. Market Analysis, Insights and Forecast - by Import Market Analysis (Value & Volume)
- 10.4. Market Analysis, Insights and Forecast - by Export Market Analysis (Value & Volume)
- 10.5. Market Analysis, Insights and Forecast - by Price Trend Analysis
- 11. Asia Pacific Farm Machinery Industry Analysis, Insights and Forecast, 2020-2032
- 11.1. Market Analysis, Insights and Forecast - by Production Analysis
- 11.2. Market Analysis, Insights and Forecast - by Consumption Analysis
- 11.3. Market Analysis, Insights and Forecast - by Import Market Analysis (Value & Volume)
- 11.4. Market Analysis, Insights and Forecast - by Export Market Analysis (Value & Volume)
- 11.5. Market Analysis, Insights and Forecast - by Price Trend Analysis
- 12. Competitive Analysis
- 12.1. Company Profiles
- 12.1.1 Iseki & Co Ltd
- 12.1.1.1. Company Overview
- 12.1.1.2. Products
- 12.1.1.3. Company Financials
- 12.1.1.4. SWOT Analysis
- 12.1.2 Class Group*List Not Exhaustive
- 12.1.2.1. Company Overview
- 12.1.2.2. Products
- 12.1.2.3. Company Financials
- 12.1.2.4. SWOT Analysis
- 12.1.3 Lindsay Corporation
- 12.1.3.1. Company Overview
- 12.1.3.2. Products
- 12.1.3.3. Company Financials
- 12.1.3.4. SWOT Analysis
- 12.1.4 Mahindra & Mahindra Limited
- 12.1.4.1. Company Overview
- 12.1.4.2. Products
- 12.1.4.3. Company Financials
- 12.1.4.4. SWOT Analysis
- 12.1.5 Deere & Company
- 12.1.5.1. Company Overview
- 12.1.5.2. Products
- 12.1.5.3. Company Financials
- 12.1.5.4. SWOT Analysis
- 12.1.6 Daedong Industrial Co Ltd
- 12.1.6.1. Company Overview
- 12.1.6.2. Products
- 12.1.6.3. Company Financials
- 12.1.6.4. SWOT Analysis
- 12.1.7 CNH Industrial NV
- 12.1.7.1. Company Overview
- 12.1.7.2. Products
- 12.1.7.3. Company Financials
- 12.1.7.4. SWOT Analysis
- 12.1.8 Kubota Corporation
- 12.1.8.1. Company Overview
- 12.1.8.2. Products
- 12.1.8.3. Company Financials
- 12.1.8.4. SWOT Analysis
- 12.1.9 JC Bamford Excavators Limited
- 12.1.9.1. Company Overview
- 12.1.9.2. Products
- 12.1.9.3. Company Financials
- 12.1.9.4. SWOT Analysis
- 12.1.10 AGCO Corporation
- 12.1.10.1. Company Overview
- 12.1.10.2. Products
- 12.1.10.3. Company Financials
- 12.1.10.4. SWOT Analysis
- 12.1.1 Iseki & Co Ltd
- 12.2. Market Entropy
- 12.2.1 Company's Key Areas Served
- 12.2.2 Recent Developments
- 12.3. Company Market Share Analysis 2025
- 12.3.1 Top 5 Companies Market Share Analysis
- 12.3.2 Top 3 Companies Market Share Analysis
- 12.4. List of Potential Customers
- 13. Research Methodology
List of Figures
- Figure 1: Global Farm Machinery Industry Revenue Breakdown (Million, %) by Region 2025 & 2033
- Figure 2: North America Farm Machinery Industry Revenue (Million), by Production Analysis 2025 & 2033
- Figure 3: North America Farm Machinery Industry Revenue Share (%), by Production Analysis 2025 & 2033
- Figure 4: North America Farm Machinery Industry Revenue (Million), by Consumption Analysis 2025 & 2033
- Figure 5: North America Farm Machinery Industry Revenue Share (%), by Consumption Analysis 2025 & 2033
- Figure 6: North America Farm Machinery Industry Revenue (Million), by Import Market Analysis (Value & Volume) 2025 & 2033
- Figure 7: North America Farm Machinery Industry Revenue Share (%), by Import Market Analysis (Value & Volume) 2025 & 2033
- Figure 8: North America Farm Machinery Industry Revenue (Million), by Export Market Analysis (Value & Volume) 2025 & 2033
- Figure 9: North America Farm Machinery Industry Revenue Share (%), by Export Market Analysis (Value & Volume) 2025 & 2033
- Figure 10: North America Farm Machinery Industry Revenue (Million), by Price Trend Analysis 2025 & 2033
- Figure 11: North America Farm Machinery Industry Revenue Share (%), by Price Trend Analysis 2025 & 2033
- Figure 12: North America Farm Machinery Industry Revenue (Million), by Country 2025 & 2033
- Figure 13: North America Farm Machinery Industry Revenue Share (%), by Country 2025 & 2033
- Figure 14: South America Farm Machinery Industry Revenue (Million), by Production Analysis 2025 & 2033
- Figure 15: South America Farm Machinery Industry Revenue Share (%), by Production Analysis 2025 & 2033
- Figure 16: South America Farm Machinery Industry Revenue (Million), by Consumption Analysis 2025 & 2033
- Figure 17: South America Farm Machinery Industry Revenue Share (%), by Consumption Analysis 2025 & 2033
- Figure 18: South America Farm Machinery Industry Revenue (Million), by Import Market Analysis (Value & Volume) 2025 & 2033
- Figure 19: South America Farm Machinery Industry Revenue Share (%), by Import Market Analysis (Value & Volume) 2025 & 2033
- Figure 20: South America Farm Machinery Industry Revenue (Million), by Export Market Analysis (Value & Volume) 2025 & 2033
- Figure 21: South America Farm Machinery Industry Revenue Share (%), by Export Market Analysis (Value & Volume) 2025 & 2033
- Figure 22: South America Farm Machinery Industry Revenue (Million), by Price Trend Analysis 2025 & 2033
- Figure 23: South America Farm Machinery Industry Revenue Share (%), by Price Trend Analysis 2025 & 2033
- Figure 24: South America Farm Machinery Industry Revenue (Million), by Country 2025 & 2033
- Figure 25: South America Farm Machinery Industry Revenue Share (%), by Country 2025 & 2033
- Figure 26: Europe Farm Machinery Industry Revenue (Million), by Production Analysis 2025 & 2033
- Figure 27: Europe Farm Machinery Industry Revenue Share (%), by Production Analysis 2025 & 2033
- Figure 28: Europe Farm Machinery Industry Revenue (Million), by Consumption Analysis 2025 & 2033
- Figure 29: Europe Farm Machinery Industry Revenue Share (%), by Consumption Analysis 2025 & 2033
- Figure 30: Europe Farm Machinery Industry Revenue (Million), by Import Market Analysis (Value & Volume) 2025 & 2033
- Figure 31: Europe Farm Machinery Industry Revenue Share (%), by Import Market Analysis (Value & Volume) 2025 & 2033
- Figure 32: Europe Farm Machinery Industry Revenue (Million), by Export Market Analysis (Value & Volume) 2025 & 2033
- Figure 33: Europe Farm Machinery Industry Revenue Share (%), by Export Market Analysis (Value & Volume) 2025 & 2033
- Figure 34: Europe Farm Machinery Industry Revenue (Million), by Price Trend Analysis 2025 & 2033
- Figure 35: Europe Farm Machinery Industry Revenue Share (%), by Price Trend Analysis 2025 & 2033
- Figure 36: Europe Farm Machinery Industry Revenue (Million), by Country 2025 & 2033
- Figure 37: Europe Farm Machinery Industry Revenue Share (%), by Country 2025 & 2033
- Figure 38: Middle East & Africa Farm Machinery Industry Revenue (Million), by Production Analysis 2025 & 2033
- Figure 39: Middle East & Africa Farm Machinery Industry Revenue Share (%), by Production Analysis 2025 & 2033
- Figure 40: Middle East & Africa Farm Machinery Industry Revenue (Million), by Consumption Analysis 2025 & 2033
- Figure 41: Middle East & Africa Farm Machinery Industry Revenue Share (%), by Consumption Analysis 2025 & 2033
- Figure 42: Middle East & Africa Farm Machinery Industry Revenue (Million), by Import Market Analysis (Value & Volume) 2025 & 2033
- Figure 43: Middle East & Africa Farm Machinery Industry Revenue Share (%), by Import Market Analysis (Value & Volume) 2025 & 2033
- Figure 44: Middle East & Africa Farm Machinery Industry Revenue (Million), by Export Market Analysis (Value & Volume) 2025 & 2033
- Figure 45: Middle East & Africa Farm Machinery Industry Revenue Share (%), by Export Market Analysis (Value & Volume) 2025 & 2033
- Figure 46: Middle East & Africa Farm Machinery Industry Revenue (Million), by Price Trend Analysis 2025 & 2033
- Figure 47: Middle East & Africa Farm Machinery Industry Revenue Share (%), by Price Trend Analysis 2025 & 2033
- Figure 48: Middle East & Africa Farm Machinery Industry Revenue (Million), by Country 2025 & 2033
- Figure 49: Middle East & Africa Farm Machinery Industry Revenue Share (%), by Country 2025 & 2033
- Figure 50: Asia Pacific Farm Machinery Industry Revenue (Million), by Production Analysis 2025 & 2033
- Figure 51: Asia Pacific Farm Machinery Industry Revenue Share (%), by Production Analysis 2025 & 2033
- Figure 52: Asia Pacific Farm Machinery Industry Revenue (Million), by Consumption Analysis 2025 & 2033
- Figure 53: Asia Pacific Farm Machinery Industry Revenue Share (%), by Consumption Analysis 2025 & 2033
- Figure 54: Asia Pacific Farm Machinery Industry Revenue (Million), by Import Market Analysis (Value & Volume) 2025 & 2033
- Figure 55: Asia Pacific Farm Machinery Industry Revenue Share (%), by Import Market Analysis (Value & Volume) 2025 & 2033
- Figure 56: Asia Pacific Farm Machinery Industry Revenue (Million), by Export Market Analysis (Value & Volume) 2025 & 2033
- Figure 57: Asia Pacific Farm Machinery Industry Revenue Share (%), by Export Market Analysis (Value & Volume) 2025 & 2033
- Figure 58: Asia Pacific Farm Machinery Industry Revenue (Million), by Price Trend Analysis 2025 & 2033
- Figure 59: Asia Pacific Farm Machinery Industry Revenue Share (%), by Price Trend Analysis 2025 & 2033
- Figure 60: Asia Pacific Farm Machinery Industry Revenue (Million), by Country 2025 & 2033
- Figure 61: Asia Pacific Farm Machinery Industry Revenue Share (%), by Country 2025 & 2033
List of Tables
- Table 1: Global Farm Machinery Industry Revenue Million Forecast, by Production Analysis 2020 & 2033
- Table 2: Global Farm Machinery Industry Revenue Million Forecast, by Consumption Analysis 2020 & 2033
- Table 3: Global Farm Machinery Industry Revenue Million Forecast, by Import Market Analysis (Value & Volume) 2020 & 2033
- Table 4: Global Farm Machinery Industry Revenue Million Forecast, by Export Market Analysis (Value & Volume) 2020 & 2033
- Table 5: Global Farm Machinery Industry Revenue Million Forecast, by Price Trend Analysis 2020 & 2033
- Table 6: Global Farm Machinery Industry Revenue Million Forecast, by Region 2020 & 2033
- Table 7: Global Farm Machinery Industry Revenue Million Forecast, by Production Analysis 2020 & 2033
- Table 8: Global Farm Machinery Industry Revenue Million Forecast, by Consumption Analysis 2020 & 2033
- Table 9: Global Farm Machinery Industry Revenue Million Forecast, by Import Market Analysis (Value & Volume) 2020 & 2033
- Table 10: Global Farm Machinery Industry Revenue Million Forecast, by Export Market Analysis (Value & Volume) 2020 & 2033
- Table 11: Global Farm Machinery Industry Revenue Million Forecast, by Price Trend Analysis 2020 & 2033
- Table 12: Global Farm Machinery Industry Revenue Million Forecast, by Country 2020 & 2033
- Table 13: United States Farm Machinery Industry Revenue (Million) Forecast, by Application 2020 & 2033
- Table 14: Canada Farm Machinery Industry Revenue (Million) Forecast, by Application 2020 & 2033
- Table 15: Mexico Farm Machinery Industry Revenue (Million) Forecast, by Application 2020 & 2033
- Table 16: Global Farm Machinery Industry Revenue Million Forecast, by Production Analysis 2020 & 2033
- Table 17: Global Farm Machinery Industry Revenue Million Forecast, by Consumption Analysis 2020 & 2033
- Table 18: Global Farm Machinery Industry Revenue Million Forecast, by Import Market Analysis (Value & Volume) 2020 & 2033
- Table 19: Global Farm Machinery Industry Revenue Million Forecast, by Export Market Analysis (Value & Volume) 2020 & 2033
- Table 20: Global Farm Machinery Industry Revenue Million Forecast, by Price Trend Analysis 2020 & 2033
- Table 21: Global Farm Machinery Industry Revenue Million Forecast, by Country 2020 & 2033
- Table 22: Brazil Farm Machinery Industry Revenue (Million) Forecast, by Application 2020 & 2033
- Table 23: Argentina Farm Machinery Industry Revenue (Million) Forecast, by Application 2020 & 2033
- Table 24: Rest of South America Farm Machinery Industry Revenue (Million) Forecast, by Application 2020 & 2033
- Table 25: Global Farm Machinery Industry Revenue Million Forecast, by Production Analysis 2020 & 2033
- Table 26: Global Farm Machinery Industry Revenue Million Forecast, by Consumption Analysis 2020 & 2033
- Table 27: Global Farm Machinery Industry Revenue Million Forecast, by Import Market Analysis (Value & Volume) 2020 & 2033
- Table 28: Global Farm Machinery Industry Revenue Million Forecast, by Export Market Analysis (Value & Volume) 2020 & 2033
- Table 29: Global Farm Machinery Industry Revenue Million Forecast, by Price Trend Analysis 2020 & 2033
- Table 30: Global Farm Machinery Industry Revenue Million Forecast, by Country 2020 & 2033
- Table 31: United Kingdom Farm Machinery Industry Revenue (Million) Forecast, by Application 2020 & 2033
- Table 32: Germany Farm Machinery Industry Revenue (Million) Forecast, by Application 2020 & 2033
- Table 33: France Farm Machinery Industry Revenue (Million) Forecast, by Application 2020 & 2033
- Table 34: Italy Farm Machinery Industry Revenue (Million) Forecast, by Application 2020 & 2033
- Table 35: Spain Farm Machinery Industry Revenue (Million) Forecast, by Application 2020 & 2033
- Table 36: Russia Farm Machinery Industry Revenue (Million) Forecast, by Application 2020 & 2033
- Table 37: Benelux Farm Machinery Industry Revenue (Million) Forecast, by Application 2020 & 2033
- Table 38: Nordics Farm Machinery Industry Revenue (Million) Forecast, by Application 2020 & 2033
- Table 39: Rest of Europe Farm Machinery Industry Revenue (Million) Forecast, by Application 2020 & 2033
- Table 40: Global Farm Machinery Industry Revenue Million Forecast, by Production Analysis 2020 & 2033
- Table 41: Global Farm Machinery Industry Revenue Million Forecast, by Consumption Analysis 2020 & 2033
- Table 42: Global Farm Machinery Industry Revenue Million Forecast, by Import Market Analysis (Value & Volume) 2020 & 2033
- Table 43: Global Farm Machinery Industry Revenue Million Forecast, by Export Market Analysis (Value & Volume) 2020 & 2033
- Table 44: Global Farm Machinery Industry Revenue Million Forecast, by Price Trend Analysis 2020 & 2033
- Table 45: Global Farm Machinery Industry Revenue Million Forecast, by Country 2020 & 2033
- Table 46: Turkey Farm Machinery Industry Revenue (Million) Forecast, by Application 2020 & 2033
- Table 47: Israel Farm Machinery Industry Revenue (Million) Forecast, by Application 2020 & 2033
- Table 48: GCC Farm Machinery Industry Revenue (Million) Forecast, by Application 2020 & 2033
- Table 49: North Africa Farm Machinery Industry Revenue (Million) Forecast, by Application 2020 & 2033
- Table 50: South Africa Farm Machinery Industry Revenue (Million) Forecast, by Application 2020 & 2033
- Table 51: Rest of Middle East & Africa Farm Machinery Industry Revenue (Million) Forecast, by Application 2020 & 2033
- Table 52: Global Farm Machinery Industry Revenue Million Forecast, by Production Analysis 2020 & 2033
- Table 53: Global Farm Machinery Industry Revenue Million Forecast, by Consumption Analysis 2020 & 2033
- Table 54: Global Farm Machinery Industry Revenue Million Forecast, by Import Market Analysis (Value & Volume) 2020 & 2033
- Table 55: Global Farm Machinery Industry Revenue Million Forecast, by Export Market Analysis (Value & Volume) 2020 & 2033
- Table 56: Global Farm Machinery Industry Revenue Million Forecast, by Price Trend Analysis 2020 & 2033
- Table 57: Global Farm Machinery Industry Revenue Million Forecast, by Country 2020 & 2033
- Table 58: China Farm Machinery Industry Revenue (Million) Forecast, by Application 2020 & 2033
- Table 59: India Farm Machinery Industry Revenue (Million) Forecast, by Application 2020 & 2033
- Table 60: Japan Farm Machinery Industry Revenue (Million) Forecast, by Application 2020 & 2033
- Table 61: South Korea Farm Machinery Industry Revenue (Million) Forecast, by Application 2020 & 2033
- Table 62: ASEAN Farm Machinery Industry Revenue (Million) Forecast, by Application 2020 & 2033
- Table 63: Oceania Farm Machinery Industry Revenue (Million) Forecast, by Application 2020 & 2033
- Table 64: Rest of Asia Pacific Farm Machinery Industry Revenue (Million) Forecast, by Application 2020 & 2033
Frequently Asked Questions
1. What is the projected Compound Annual Growth Rate (CAGR) of the Farm Machinery Industry?
The projected CAGR is approximately 5.40%.
2. Which companies are prominent players in the Farm Machinery Industry?
Key companies in the market include Iseki & Co Ltd, Class Group*List Not Exhaustive, Lindsay Corporation, Mahindra & Mahindra Limited, Deere & Company, Daedong Industrial Co Ltd, CNH Industrial NV, Kubota Corporation, JC Bamford Excavators Limited, AGCO Corporation.
3. What are the main segments of the Farm Machinery Industry?
The market segments include Production Analysis, Consumption Analysis, Import Market Analysis (Value & Volume), Export Market Analysis (Value & Volume), Price Trend Analysis.
4. Can you provide details about the market size?
The market size is estimated to be USD 151.55 Million as of 2022.
5. What are some drivers contributing to market growth?
Low Availability of Skilled Labor; Technological Advancements.
6. What are the notable trends driving market growth?
Low Availability of Skilled Labor.
7. Are there any restraints impacting market growth?
Increasing Farm Expenditure; Security Concerns in Modern Farming Machinery.
8. Can you provide examples of recent developments in the market?
February 2024: John Deere and GUSS Automation unveiled the Electric GUSS, the world's first fully electric autonomous herbicide orchard sprayer. This innovative machine allows growers to control multiple sprayers remotely and features a sport spraying weed detection system that reduces herbicide use and increases sustainability. Electric gas is a significant development in precision agriculture.
9. What pricing options are available for accessing the report?
Pricing options include single-user, multi-user, and enterprise licenses priced at USD 4750, USD 5250, and USD 8750 respectively.
10. Is the market size provided in terms of value or volume?
The market size is provided in terms of value, measured in Million.
11. Are there any specific market keywords associated with the report?
Yes, the market keyword associated with the report is "Farm Machinery Industry," which aids in identifying and referencing the specific market segment covered.
12. How do I determine which pricing option suits my needs best?
The pricing options vary based on user requirements and access needs. Individual users may opt for single-user licenses, while businesses requiring broader access may choose multi-user or enterprise licenses for cost-effective access to the report.
13. Are there any additional resources or data provided in the Farm Machinery Industry report?
While the report offers comprehensive insights, it's advisable to review the specific contents or supplementary materials provided to ascertain if additional resources or data are available.
14. How can I stay updated on further developments or reports in the Farm Machinery Industry?
To stay informed about further developments, trends, and reports in the Farm Machinery Industry, consider subscribing to industry newsletters, following relevant companies and organizations, or regularly checking reputable industry news sources and publications.
Methodology
Step 1 - Identification of Relevant Samples Size from Population Database


Step 2 - Approaches for Defining Global Market Size (Value, Volume* & Price*)

Note*: In applicable scenarios
Step 3 - Data Sources
Primary Research
- Web Analytics
- Survey Reports
- Research Institute
- Latest Research Reports
- Opinion Leaders
Secondary Research
- Annual Reports
- White Paper
- Latest Press Release
- Industry Association
- Paid Database
- Investor Presentations

Step 4 - Data Triangulation
Involves using different sources of information in order to increase the validity of a study
These sources are likely to be stakeholders in a program - participants, other researchers, program staff, other community members, and so on.
Then we put all data in single framework & apply various statistical tools to find out the dynamic on the market.
During the analysis stage, feedback from the stakeholder groups would be compared to determine areas of agreement as well as areas of divergence