

Key Insights
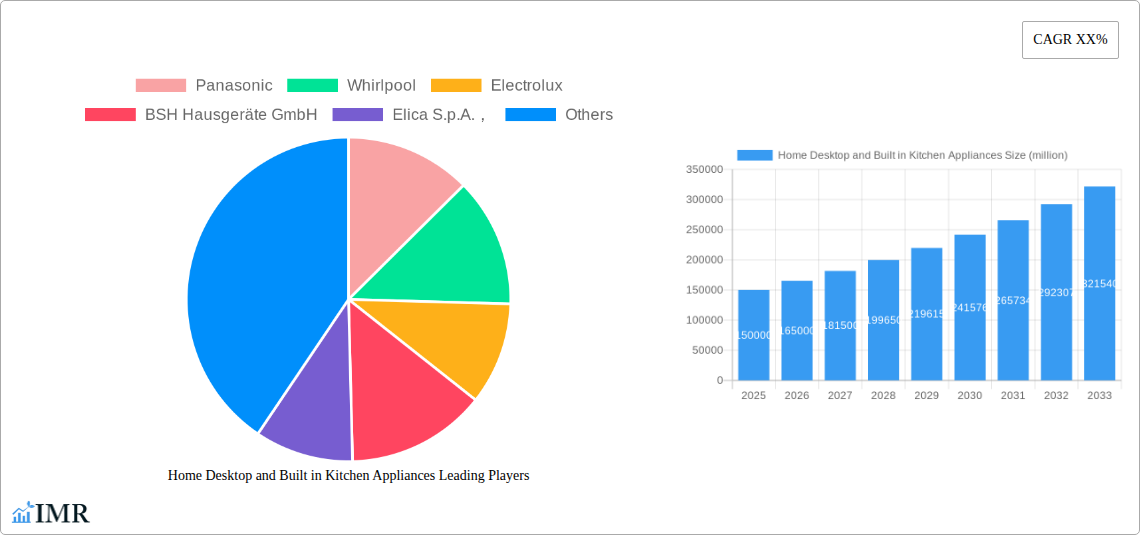
The global market for home desktop and built-in kitchen appliances is experiencing robust growth, driven by increasing urbanization, rising disposable incomes, and a growing preference for modern, convenient kitchens. The market is segmented by product type (refrigerators, ovens, cooktops, dishwashers, microwaves, etc.), technology (smart appliances, energy-efficient models), and distribution channels (online retailers, brick-and-mortar stores). Major players like Panasonic, Whirlpool, Electrolux, and Haier are driving innovation through smart features, improved energy efficiency, and stylish designs, catering to the evolving consumer demands for enhanced convenience and aesthetic appeal. The market is also witnessing a surge in demand for built-in appliances, particularly in developed regions, reflecting a trend toward integrated and space-saving kitchen designs. Competition is fierce, with both established global brands and emerging regional players vying for market share. The growth trajectory is expected to be influenced by factors such as fluctuating raw material prices, technological advancements, and evolving consumer preferences. While challenges exist in terms of supply chain disruptions and economic volatility, the overall market outlook remains positive, suggesting substantial growth potential over the next decade.
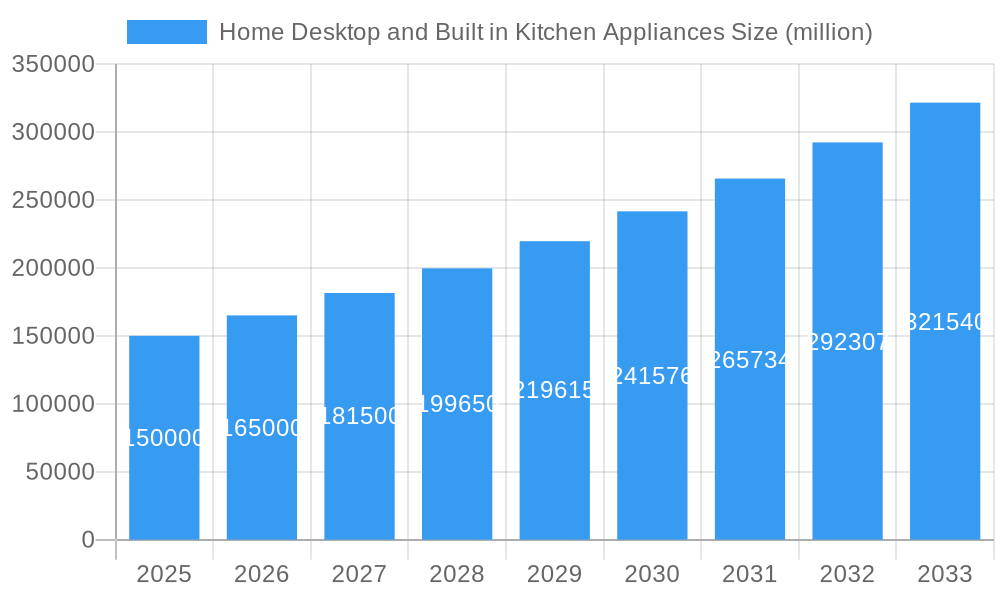
Home Desktop and Built in Kitchen Appliances Market Size (In Billion)
The forecast period of 2025-2033 anticipates continued expansion driven by technological innovations such as smart home integration, improved energy efficiency standards, and the emergence of new product categories. The ongoing focus on sustainability is also impacting design and manufacturing, leading to eco-friendly options that appeal to environmentally conscious consumers. Regional variations are expected, with developed markets demonstrating steady growth fueled by upgrades and replacements, while emerging economies witness more significant expansion due to increased appliance adoption. Understanding consumer preferences in each region and adapting product offerings accordingly will be critical for success in this competitive landscape. The industry will likely see further consolidation through mergers and acquisitions as companies strive to strengthen their market positions and expand their product portfolios.
Home Desktop and Built in Kitchen Appliances Company Market Share
Home Desktop and Built-in Kitchen Appliances Market Report: 2019-2033
This comprehensive report provides an in-depth analysis of the global home desktop and built-in kitchen appliances market, encompassing market dynamics, growth trends, regional dominance, product landscape, key players, and future outlook. The study period covers 2019-2033, with 2025 as the base and estimated year. The forecast period spans 2025-2033, while the historical period analyzed is 2019-2024. This report is invaluable for industry professionals, investors, and strategic decision-makers seeking to understand and capitalize on opportunities within this dynamic market. The market size is measured in million units.
Home Desktop and Built-in Kitchen Appliances Market Dynamics & Structure
This section analyzes the market concentration, technological innovation drivers, regulatory landscapes, competitive substitutes, end-user demographics, and mergers & acquisitions (M&A) trends within the home desktop and built-in kitchen appliance sector. The report provides a detailed assessment of the competitive landscape, highlighting market share percentages for key players and the volume of M&A deals over the study period. Qualitative factors such as innovation barriers and their impact on market growth are also thoroughly explored.
- Market Concentration: The market is moderately concentrated, with the top 5 players holding approximately xx% market share in 2024.
- Technological Innovation: Smart appliances, energy efficiency improvements, and connected home integration are key innovation drivers.
- Regulatory Framework: Regulations concerning energy consumption and safety standards significantly influence product development and market access.
- Competitive Substitutes: The market faces competition from alternative cooking methods and storage solutions.
- End-User Demographics: Growing urbanization and changing lifestyles are driving demand for convenient and efficient kitchen appliances.
- M&A Trends: The number of M&A deals in the sector has averaged xx per year during the historical period, indicating significant consolidation. Examples include (specific M&A examples with dates and involved companies, if available).
Home Desktop and Built-in Kitchen Appliances Growth Trends & Insights
This section provides a detailed analysis of the market size evolution, adoption rates, technological disruptions, and consumer behavior shifts within the home desktop and built-in kitchen appliance industry, leveraging advanced analytical methodologies. The report presents detailed metrics including CAGR and market penetration rates, providing a comprehensive view of the market's growth trajectory.
Dominant Regions, Countries, or Segments in Home Desktop and Built-in Kitchen Appliances
This section identifies the leading regions, countries, or segments driving market growth. Key drivers, such as economic policies, infrastructure development, and consumer preferences, are highlighted using bullet points. The analysis delves into the factors contributing to the dominance of specific regions or segments, including market share and growth potential.
- Dominant Region: North America/Asia (Specify region with justification and data).
- Key Growth Drivers: (Examples: Rising disposable incomes, increasing urbanization, government initiatives promoting energy efficiency).
- Market Share: (Provide regional market share data for key regions).
- Growth Potential: (Discuss future growth projections for each region).
Home Desktop and Built-in Kitchen Appliances Product Landscape
This section details product innovations, applications, and performance metrics. It highlights the unique selling propositions (USPs) of leading products and the technological advancements shaping the market.
Key Drivers, Barriers & Challenges in Home Desktop and Built-in Kitchen Appliances
This section identifies key drivers and challenges impacting market growth. Drivers include technological advancements, economic factors, and supportive policies. Challenges include supply chain disruptions, regulatory hurdles, and competitive pressures, with their quantifiable impacts analyzed.
Key Drivers:
- Technological advancements (e.g., smart home integration)
- Rising disposable incomes in developing economies
- Government initiatives promoting energy efficiency
Key Challenges:
- Supply chain disruptions impacting production and distribution (Quantify impact if data available)
- Increasing raw material costs (Quantify impact if data available)
- Stringent regulatory compliance requirements
Emerging Opportunities in Home Desktop and Built-in Kitchen Appliances
This section highlights emerging trends and opportunities, including untapped markets, innovative applications, and evolving consumer preferences.
Growth Accelerators in the Home Desktop and Built-in Kitchen Appliances Industry
This section discusses catalysts driving long-term growth, including technological breakthroughs, strategic partnerships, and market expansion strategies.
Key Players Shaping the Home Desktop and Built-in Kitchen Appliances Market
- Panasonic
- Whirlpool
- Electrolux
- BSH Hausgeräte GmbH
- Elica S.p.A.
- Arcelik A.S.
- Liebherr
- Zhejiang Meida Industrial Co., Ltd.
- Guangdong Galanz Group Co., Ltd.
- Zhejiang Entive Intelligent Kitchen Appliances Co., Ltd.
- Hisense
- Hangzhou Robam Electric Co., Ltd.
- VATTI CO., LTD.
- Guangdong Vanbo Electric Co., Ltd.
- GUANGDONG MACRO CO., LTD
- Haier
- Midea
- Zhejiang SANFER Electric Co., Ltd.
- Marssenger Kitchenware Co Ltd
- Fotile
Notable Milestones in Home Desktop and Built-in Kitchen Appliances Sector
- [Year/Month]: [Milestone description and its impact]
- [Year/Month]: [Milestone description and its impact]
- [Year/Month]: [Milestone description and its impact] (Include at least three milestones with details)
In-Depth Home Desktop and Built-in Kitchen Appliances Market Outlook
This section summarizes growth accelerators and focuses on future market potential and strategic opportunities. The report concludes with a forecast of continued growth driven by [mention key drivers and trends]. Significant opportunities exist for companies that can effectively leverage [mention key opportunities, e.g., technological advancements, emerging markets].
Home Desktop and Built in Kitchen Appliances Segmentation
-
1. Application
- 1.1. Online Sales
- 1.2. Offline Sales
-
2. Types
- 2.1. Desktop
- 2.2. Built-in
Home Desktop and Built in Kitchen Appliances Segmentation By Geography
-
1. North America
- 1.1. United States
- 1.2. Canada
- 1.3. Mexico
-
2. South America
- 2.1. Brazil
- 2.2. Argentina
- 2.3. Rest of South America
-
3. Europe
- 3.1. United Kingdom
- 3.2. Germany
- 3.3. France
- 3.4. Italy
- 3.5. Spain
- 3.6. Russia
- 3.7. Benelux
- 3.8. Nordics
- 3.9. Rest of Europe
-
4. Middle East & Africa
- 4.1. Turkey
- 4.2. Israel
- 4.3. GCC
- 4.4. North Africa
- 4.5. South Africa
- 4.6. Rest of Middle East & Africa
-
5. Asia Pacific
- 5.1. China
- 5.2. India
- 5.3. Japan
- 5.4. South Korea
- 5.5. ASEAN
- 5.6. Oceania
- 5.7. Rest of Asia Pacific
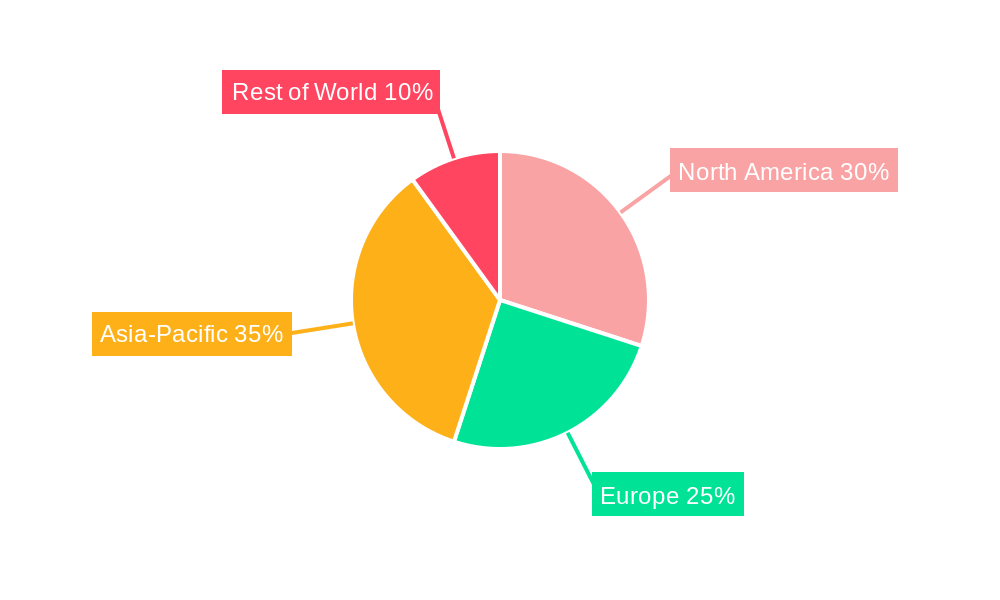
Home Desktop and Built in Kitchen Appliances Regional Market Share
Geographic Coverage of Home Desktop and Built in Kitchen Appliances
Home Desktop and Built in Kitchen Appliances REPORT HIGHLIGHTS
| Aspects | Details |
|---|---|
| Study Period | 2020-2034 |
| Base Year | 2025 |
| Estimated Year | 2026 |
| Forecast Period | 2026-2034 |
| Historical Period | 2020-2025 |
| Growth Rate | CAGR of XX% from 2020-2034 |
| Segmentation |
|
Table of Contents
- 1. Introduction
- 1.1. Research Scope
- 1.2. Market Segmentation
- 1.3. Research Objective
- 1.4. Definitions and Assumptions
- 2. Executive Summary
- 2.1. Market Snapshot
- 3. Market Dynamics
- 3.1. Market Drivers
- 3.2. Market Restrains
- 3.3. Market Trends
- 3.4. Market Opportunities
- 4. Market Factor Analysis
- 4.1. Porters Five Forces
- 4.1.1. Bargaining Power of Suppliers
- 4.1.2. Bargaining Power of Buyers
- 4.1.3. Threat of New Entrants
- 4.1.4. Threat of Substitutes
- 4.1.5. Competitive Rivalry
- 4.2. PESTEL analysis
- 4.3. BCG Analysis
- 4.3.1. Stars (High Growth, High Market Share)
- 4.3.2. Cash Cows (Low Growth, High Market Share)
- 4.3.3. Question Mark (High Growth, Low Market Share)
- 4.3.4. Dogs (Low Growth, Low Market Share)
- 4.4. Ansoff Matrix Analysis
- 4.5. Supply Chain Analysis
- 4.6. Regulatory Landscape
- 4.7. Current Market Potential and Opportunity Assessment (TAM–SAM–SOM Framework)
- 4.8. IMR Analyst Note
- 4.1. Porters Five Forces
- 5. Market Analysis, Insights and Forecast 2021-2033
- 5.1. Market Analysis, Insights and Forecast - by Application
- 5.1.1. Online Sales
- 5.1.2. Offline Sales
- 5.2. Market Analysis, Insights and Forecast - by Types
- 5.2.1. Desktop
- 5.2.2. Built-in
- 5.3. Market Analysis, Insights and Forecast - by Region
- 5.3.1. North America
- 5.3.2. South America
- 5.3.3. Europe
- 5.3.4. Middle East & Africa
- 5.3.5. Asia Pacific
- 5.1. Market Analysis, Insights and Forecast - by Application
- 6. Global Home Desktop and Built in Kitchen Appliances Analysis, Insights and Forecast, 2021-2033
- 6.1. Market Analysis, Insights and Forecast - by Application
- 6.1.1. Online Sales
- 6.1.2. Offline Sales
- 6.2. Market Analysis, Insights and Forecast - by Types
- 6.2.1. Desktop
- 6.2.2. Built-in
- 6.1. Market Analysis, Insights and Forecast - by Application
- 7. North America Home Desktop and Built in Kitchen Appliances Analysis, Insights and Forecast, 2020-2032
- 7.1. Market Analysis, Insights and Forecast - by Application
- 7.1.1. Online Sales
- 7.1.2. Offline Sales
- 7.2. Market Analysis, Insights and Forecast - by Types
- 7.2.1. Desktop
- 7.2.2. Built-in
- 7.1. Market Analysis, Insights and Forecast - by Application
- 8. South America Home Desktop and Built in Kitchen Appliances Analysis, Insights and Forecast, 2020-2032
- 8.1. Market Analysis, Insights and Forecast - by Application
- 8.1.1. Online Sales
- 8.1.2. Offline Sales
- 8.2. Market Analysis, Insights and Forecast - by Types
- 8.2.1. Desktop
- 8.2.2. Built-in
- 8.1. Market Analysis, Insights and Forecast - by Application
- 9. Europe Home Desktop and Built in Kitchen Appliances Analysis, Insights and Forecast, 2020-2032
- 9.1. Market Analysis, Insights and Forecast - by Application
- 9.1.1. Online Sales
- 9.1.2. Offline Sales
- 9.2. Market Analysis, Insights and Forecast - by Types
- 9.2.1. Desktop
- 9.2.2. Built-in
- 9.1. Market Analysis, Insights and Forecast - by Application
- 10. Middle East & Africa Home Desktop and Built in Kitchen Appliances Analysis, Insights and Forecast, 2020-2032
- 10.1. Market Analysis, Insights and Forecast - by Application
- 10.1.1. Online Sales
- 10.1.2. Offline Sales
- 10.2. Market Analysis, Insights and Forecast - by Types
- 10.2.1. Desktop
- 10.2.2. Built-in
- 10.1. Market Analysis, Insights and Forecast - by Application
- 11. Asia Pacific Home Desktop and Built in Kitchen Appliances Analysis, Insights and Forecast, 2020-2032
- 11.1. Market Analysis, Insights and Forecast - by Application
- 11.1.1. Online Sales
- 11.1.2. Offline Sales
- 11.2. Market Analysis, Insights and Forecast - by Types
- 11.2.1. Desktop
- 11.2.2. Built-in
- 11.1. Market Analysis, Insights and Forecast - by Application
- 12. Competitive Analysis
- 12.1. Company Profiles
- 12.1.1 Panasonic
- 12.1.1.1. Company Overview
- 12.1.1.2. Products
- 12.1.1.3. Company Financials
- 12.1.1.4. SWOT Analysis
- 12.1.2 Whirlpool
- 12.1.2.1. Company Overview
- 12.1.2.2. Products
- 12.1.2.3. Company Financials
- 12.1.2.4. SWOT Analysis
- 12.1.3 Electrolux
- 12.1.3.1. Company Overview
- 12.1.3.2. Products
- 12.1.3.3. Company Financials
- 12.1.3.4. SWOT Analysis
- 12.1.4 BSH Hausgeräte GmbH
- 12.1.4.1. Company Overview
- 12.1.4.2. Products
- 12.1.4.3. Company Financials
- 12.1.4.4. SWOT Analysis
- 12.1.5 Elica S.p.A.,
- 12.1.5.1. Company Overview
- 12.1.5.2. Products
- 12.1.5.3. Company Financials
- 12.1.5.4. SWOT Analysis
- 12.1.6 Arcelik A.S.,
- 12.1.6.1. Company Overview
- 12.1.6.2. Products
- 12.1.6.3. Company Financials
- 12.1.6.4. SWOT Analysis
- 12.1.7 Liebherr
- 12.1.7.1. Company Overview
- 12.1.7.2. Products
- 12.1.7.3. Company Financials
- 12.1.7.4. SWOT Analysis
- 12.1.8 Zhejiang Meida Industrial Co.
- 12.1.8.1. Company Overview
- 12.1.8.2. Products
- 12.1.8.3. Company Financials
- 12.1.8.4. SWOT Analysis
- 12.1.9 Ltd.
- 12.1.9.1. Company Overview
- 12.1.9.2. Products
- 12.1.9.3. Company Financials
- 12.1.9.4. SWOT Analysis
- 12.1.10 Guangdong Galanz Group Co.
- 12.1.10.1. Company Overview
- 12.1.10.2. Products
- 12.1.10.3. Company Financials
- 12.1.10.4. SWOT Analysis
- 12.1.11 Ltd.
- 12.1.11.1. Company Overview
- 12.1.11.2. Products
- 12.1.11.3. Company Financials
- 12.1.11.4. SWOT Analysis
- 12.1.12 Zhejiang Entive Intelligent Kitchen Appliances Co.
- 12.1.12.1. Company Overview
- 12.1.12.2. Products
- 12.1.12.3. Company Financials
- 12.1.12.4. SWOT Analysis
- 12.1.13 Ltd.
- 12.1.13.1. Company Overview
- 12.1.13.2. Products
- 12.1.13.3. Company Financials
- 12.1.13.4. SWOT Analysis
- 12.1.14 Hisense
- 12.1.14.1. Company Overview
- 12.1.14.2. Products
- 12.1.14.3. Company Financials
- 12.1.14.4. SWOT Analysis
- 12.1.15 Hangzhou Robam Electric Co.
- 12.1.15.1. Company Overview
- 12.1.15.2. Products
- 12.1.15.3. Company Financials
- 12.1.15.4. SWOT Analysis
- 12.1.16 Ltd.
- 12.1.16.1. Company Overview
- 12.1.16.2. Products
- 12.1.16.3. Company Financials
- 12.1.16.4. SWOT Analysis
- 12.1.17 VATTI CO.
- 12.1.17.1. Company Overview
- 12.1.17.2. Products
- 12.1.17.3. Company Financials
- 12.1.17.4. SWOT Analysis
- 12.1.18 LTD.
- 12.1.18.1. Company Overview
- 12.1.18.2. Products
- 12.1.18.3. Company Financials
- 12.1.18.4. SWOT Analysis
- 12.1.19 Guangdong Vanbo Electric Co.
- 12.1.19.1. Company Overview
- 12.1.19.2. Products
- 12.1.19.3. Company Financials
- 12.1.19.4. SWOT Analysis
- 12.1.20 Ltd.
- 12.1.20.1. Company Overview
- 12.1.20.2. Products
- 12.1.20.3. Company Financials
- 12.1.20.4. SWOT Analysis
- 12.1.21 GUANGDONG MACRO CO.
- 12.1.21.1. Company Overview
- 12.1.21.2. Products
- 12.1.21.3. Company Financials
- 12.1.21.4. SWOT Analysis
- 12.1.22 LTD
- 12.1.22.1. Company Overview
- 12.1.22.2. Products
- 12.1.22.3. Company Financials
- 12.1.22.4. SWOT Analysis
- 12.1.23 Haier
- 12.1.23.1. Company Overview
- 12.1.23.2. Products
- 12.1.23.3. Company Financials
- 12.1.23.4. SWOT Analysis
- 12.1.24 Midea
- 12.1.24.1. Company Overview
- 12.1.24.2. Products
- 12.1.24.3. Company Financials
- 12.1.24.4. SWOT Analysis
- 12.1.25 Zhejiang SANFER Electric Co.
- 12.1.25.1. Company Overview
- 12.1.25.2. Products
- 12.1.25.3. Company Financials
- 12.1.25.4. SWOT Analysis
- 12.1.26 Ltd.
- 12.1.26.1. Company Overview
- 12.1.26.2. Products
- 12.1.26.3. Company Financials
- 12.1.26.4. SWOT Analysis
- 12.1.27 Marssenger Kitchenware Co Ltd
- 12.1.27.1. Company Overview
- 12.1.27.2. Products
- 12.1.27.3. Company Financials
- 12.1.27.4. SWOT Analysis
- 12.1.28 Fotile
- 12.1.28.1. Company Overview
- 12.1.28.2. Products
- 12.1.28.3. Company Financials
- 12.1.28.4. SWOT Analysis
- 12.1.1 Panasonic
- 12.2. Market Entropy
- 12.2.1 Company's Key Areas Served
- 12.2.2 Recent Developments
- 12.3. Company Market Share Analysis 2025
- 12.3.1 Top 5 Companies Market Share Analysis
- 12.3.2 Top 3 Companies Market Share Analysis
- 12.4. List of Potential Customers
- 13. Research Methodology
List of Figures
- Figure 1: Global Home Desktop and Built in Kitchen Appliances Revenue Breakdown (million, %) by Region 2025 & 2033
- Figure 2: North America Home Desktop and Built in Kitchen Appliances Revenue (million), by Application 2025 & 2033
- Figure 3: North America Home Desktop and Built in Kitchen Appliances Revenue Share (%), by Application 2025 & 2033
- Figure 4: North America Home Desktop and Built in Kitchen Appliances Revenue (million), by Types 2025 & 2033
- Figure 5: North America Home Desktop and Built in Kitchen Appliances Revenue Share (%), by Types 2025 & 2033
- Figure 6: North America Home Desktop and Built in Kitchen Appliances Revenue (million), by Country 2025 & 2033
- Figure 7: North America Home Desktop and Built in Kitchen Appliances Revenue Share (%), by Country 2025 & 2033
- Figure 8: South America Home Desktop and Built in Kitchen Appliances Revenue (million), by Application 2025 & 2033
- Figure 9: South America Home Desktop and Built in Kitchen Appliances Revenue Share (%), by Application 2025 & 2033
- Figure 10: South America Home Desktop and Built in Kitchen Appliances Revenue (million), by Types 2025 & 2033
- Figure 11: South America Home Desktop and Built in Kitchen Appliances Revenue Share (%), by Types 2025 & 2033
- Figure 12: South America Home Desktop and Built in Kitchen Appliances Revenue (million), by Country 2025 & 2033
- Figure 13: South America Home Desktop and Built in Kitchen Appliances Revenue Share (%), by Country 2025 & 2033
- Figure 14: Europe Home Desktop and Built in Kitchen Appliances Revenue (million), by Application 2025 & 2033
- Figure 15: Europe Home Desktop and Built in Kitchen Appliances Revenue Share (%), by Application 2025 & 2033
- Figure 16: Europe Home Desktop and Built in Kitchen Appliances Revenue (million), by Types 2025 & 2033
- Figure 17: Europe Home Desktop and Built in Kitchen Appliances Revenue Share (%), by Types 2025 & 2033
- Figure 18: Europe Home Desktop and Built in Kitchen Appliances Revenue (million), by Country 2025 & 2033
- Figure 19: Europe Home Desktop and Built in Kitchen Appliances Revenue Share (%), by Country 2025 & 2033
- Figure 20: Middle East & Africa Home Desktop and Built in Kitchen Appliances Revenue (million), by Application 2025 & 2033
- Figure 21: Middle East & Africa Home Desktop and Built in Kitchen Appliances Revenue Share (%), by Application 2025 & 2033
- Figure 22: Middle East & Africa Home Desktop and Built in Kitchen Appliances Revenue (million), by Types 2025 & 2033
- Figure 23: Middle East & Africa Home Desktop and Built in Kitchen Appliances Revenue Share (%), by Types 2025 & 2033
- Figure 24: Middle East & Africa Home Desktop and Built in Kitchen Appliances Revenue (million), by Country 2025 & 2033
- Figure 25: Middle East & Africa Home Desktop and Built in Kitchen Appliances Revenue Share (%), by Country 2025 & 2033
- Figure 26: Asia Pacific Home Desktop and Built in Kitchen Appliances Revenue (million), by Application 2025 & 2033
- Figure 27: Asia Pacific Home Desktop and Built in Kitchen Appliances Revenue Share (%), by Application 2025 & 2033
- Figure 28: Asia Pacific Home Desktop and Built in Kitchen Appliances Revenue (million), by Types 2025 & 2033
- Figure 29: Asia Pacific Home Desktop and Built in Kitchen Appliances Revenue Share (%), by Types 2025 & 2033
- Figure 30: Asia Pacific Home Desktop and Built in Kitchen Appliances Revenue (million), by Country 2025 & 2033
- Figure 31: Asia Pacific Home Desktop and Built in Kitchen Appliances Revenue Share (%), by Country 2025 & 2033
List of Tables
- Table 1: Global Home Desktop and Built in Kitchen Appliances Revenue million Forecast, by Application 2020 & 2033
- Table 2: Global Home Desktop and Built in Kitchen Appliances Revenue million Forecast, by Types 2020 & 2033
- Table 3: Global Home Desktop and Built in Kitchen Appliances Revenue million Forecast, by Region 2020 & 2033
- Table 4: Global Home Desktop and Built in Kitchen Appliances Revenue million Forecast, by Application 2020 & 2033
- Table 5: Global Home Desktop and Built in Kitchen Appliances Revenue million Forecast, by Types 2020 & 2033
- Table 6: Global Home Desktop and Built in Kitchen Appliances Revenue million Forecast, by Country 2020 & 2033
- Table 7: United States Home Desktop and Built in Kitchen Appliances Revenue (million) Forecast, by Application 2020 & 2033
- Table 8: Canada Home Desktop and Built in Kitchen Appliances Revenue (million) Forecast, by Application 2020 & 2033
- Table 9: Mexico Home Desktop and Built in Kitchen Appliances Revenue (million) Forecast, by Application 2020 & 2033
- Table 10: Global Home Desktop and Built in Kitchen Appliances Revenue million Forecast, by Application 2020 & 2033
- Table 11: Global Home Desktop and Built in Kitchen Appliances Revenue million Forecast, by Types 2020 & 2033
- Table 12: Global Home Desktop and Built in Kitchen Appliances Revenue million Forecast, by Country 2020 & 2033
- Table 13: Brazil Home Desktop and Built in Kitchen Appliances Revenue (million) Forecast, by Application 2020 & 2033
- Table 14: Argentina Home Desktop and Built in Kitchen Appliances Revenue (million) Forecast, by Application 2020 & 2033
- Table 15: Rest of South America Home Desktop and Built in Kitchen Appliances Revenue (million) Forecast, by Application 2020 & 2033
- Table 16: Global Home Desktop and Built in Kitchen Appliances Revenue million Forecast, by Application 2020 & 2033
- Table 17: Global Home Desktop and Built in Kitchen Appliances Revenue million Forecast, by Types 2020 & 2033
- Table 18: Global Home Desktop and Built in Kitchen Appliances Revenue million Forecast, by Country 2020 & 2033
- Table 19: United Kingdom Home Desktop and Built in Kitchen Appliances Revenue (million) Forecast, by Application 2020 & 2033
- Table 20: Germany Home Desktop and Built in Kitchen Appliances Revenue (million) Forecast, by Application 2020 & 2033
- Table 21: France Home Desktop and Built in Kitchen Appliances Revenue (million) Forecast, by Application 2020 & 2033
- Table 22: Italy Home Desktop and Built in Kitchen Appliances Revenue (million) Forecast, by Application 2020 & 2033
- Table 23: Spain Home Desktop and Built in Kitchen Appliances Revenue (million) Forecast, by Application 2020 & 2033
- Table 24: Russia Home Desktop and Built in Kitchen Appliances Revenue (million) Forecast, by Application 2020 & 2033
- Table 25: Benelux Home Desktop and Built in Kitchen Appliances Revenue (million) Forecast, by Application 2020 & 2033
- Table 26: Nordics Home Desktop and Built in Kitchen Appliances Revenue (million) Forecast, by Application 2020 & 2033
- Table 27: Rest of Europe Home Desktop and Built in Kitchen Appliances Revenue (million) Forecast, by Application 2020 & 2033
- Table 28: Global Home Desktop and Built in Kitchen Appliances Revenue million Forecast, by Application 2020 & 2033
- Table 29: Global Home Desktop and Built in Kitchen Appliances Revenue million Forecast, by Types 2020 & 2033
- Table 30: Global Home Desktop and Built in Kitchen Appliances Revenue million Forecast, by Country 2020 & 2033
- Table 31: Turkey Home Desktop and Built in Kitchen Appliances Revenue (million) Forecast, by Application 2020 & 2033
- Table 32: Israel Home Desktop and Built in Kitchen Appliances Revenue (million) Forecast, by Application 2020 & 2033
- Table 33: GCC Home Desktop and Built in Kitchen Appliances Revenue (million) Forecast, by Application 2020 & 2033
- Table 34: North Africa Home Desktop and Built in Kitchen Appliances Revenue (million) Forecast, by Application 2020 & 2033
- Table 35: South Africa Home Desktop and Built in Kitchen Appliances Revenue (million) Forecast, by Application 2020 & 2033
- Table 36: Rest of Middle East & Africa Home Desktop and Built in Kitchen Appliances Revenue (million) Forecast, by Application 2020 & 2033
- Table 37: Global Home Desktop and Built in Kitchen Appliances Revenue million Forecast, by Application 2020 & 2033
- Table 38: Global Home Desktop and Built in Kitchen Appliances Revenue million Forecast, by Types 2020 & 2033
- Table 39: Global Home Desktop and Built in Kitchen Appliances Revenue million Forecast, by Country 2020 & 2033
- Table 40: China Home Desktop and Built in Kitchen Appliances Revenue (million) Forecast, by Application 2020 & 2033
- Table 41: India Home Desktop and Built in Kitchen Appliances Revenue (million) Forecast, by Application 2020 & 2033
- Table 42: Japan Home Desktop and Built in Kitchen Appliances Revenue (million) Forecast, by Application 2020 & 2033
- Table 43: South Korea Home Desktop and Built in Kitchen Appliances Revenue (million) Forecast, by Application 2020 & 2033
- Table 44: ASEAN Home Desktop and Built in Kitchen Appliances Revenue (million) Forecast, by Application 2020 & 2033
- Table 45: Oceania Home Desktop and Built in Kitchen Appliances Revenue (million) Forecast, by Application 2020 & 2033
- Table 46: Rest of Asia Pacific Home Desktop and Built in Kitchen Appliances Revenue (million) Forecast, by Application 2020 & 2033
Frequently Asked Questions
1. What is the projected Compound Annual Growth Rate (CAGR) of the Home Desktop and Built in Kitchen Appliances?
The projected CAGR is approximately XX%.
2. Which companies are prominent players in the Home Desktop and Built in Kitchen Appliances?
Key companies in the market include Panasonic, Whirlpool, Electrolux, BSH Hausgeräte GmbH, Elica S.p.A.,, Arcelik A.S.,, Liebherr, Zhejiang Meida Industrial Co., Ltd., Guangdong Galanz Group Co., Ltd., Zhejiang Entive Intelligent Kitchen Appliances Co., Ltd., Hisense, Hangzhou Robam Electric Co., Ltd., VATTI CO., LTD., Guangdong Vanbo Electric Co., Ltd., GUANGDONG MACRO CO., LTD, Haier, Midea, Zhejiang SANFER Electric Co., Ltd., Marssenger Kitchenware Co Ltd, Fotile.
3. What are the main segments of the Home Desktop and Built in Kitchen Appliances?
The market segments include Application, Types.
4. Can you provide details about the market size?
The market size is estimated to be USD XXX million as of 2022.
5. What are some drivers contributing to market growth?
N/A
6. What are the notable trends driving market growth?
N/A
7. Are there any restraints impacting market growth?
N/A
8. Can you provide examples of recent developments in the market?
N/A
9. What pricing options are available for accessing the report?
Pricing options include single-user, multi-user, and enterprise licenses priced at USD 3950.00, USD 5925.00, and USD 7900.00 respectively.
10. Is the market size provided in terms of value or volume?
The market size is provided in terms of value, measured in million.
11. Are there any specific market keywords associated with the report?
Yes, the market keyword associated with the report is "Home Desktop and Built in Kitchen Appliances," which aids in identifying and referencing the specific market segment covered.
12. How do I determine which pricing option suits my needs best?
The pricing options vary based on user requirements and access needs. Individual users may opt for single-user licenses, while businesses requiring broader access may choose multi-user or enterprise licenses for cost-effective access to the report.
13. Are there any additional resources or data provided in the Home Desktop and Built in Kitchen Appliances report?
While the report offers comprehensive insights, it's advisable to review the specific contents or supplementary materials provided to ascertain if additional resources or data are available.
14. How can I stay updated on further developments or reports in the Home Desktop and Built in Kitchen Appliances?
To stay informed about further developments, trends, and reports in the Home Desktop and Built in Kitchen Appliances, consider subscribing to industry newsletters, following relevant companies and organizations, or regularly checking reputable industry news sources and publications.
Methodology
Step 1 - Identification of Relevant Samples Size from Population Database


Step 2 - Approaches for Defining Global Market Size (Value, Volume* & Price*)

Note*: In applicable scenarios
Step 3 - Data Sources
Primary Research
- Web Analytics
- Survey Reports
- Research Institute
- Latest Research Reports
- Opinion Leaders
Secondary Research
- Annual Reports
- White Paper
- Latest Press Release
- Industry Association
- Paid Database
- Investor Presentations

Step 4 - Data Triangulation
Involves using different sources of information in order to increase the validity of a study
These sources are likely to be stakeholders in a program - participants, other researchers, program staff, other community members, and so on.
Then we put all data in single framework & apply various statistical tools to find out the dynamic on the market.
During the analysis stage, feedback from the stakeholder groups would be compared to determine areas of agreement as well as areas of divergence