

Key Insights
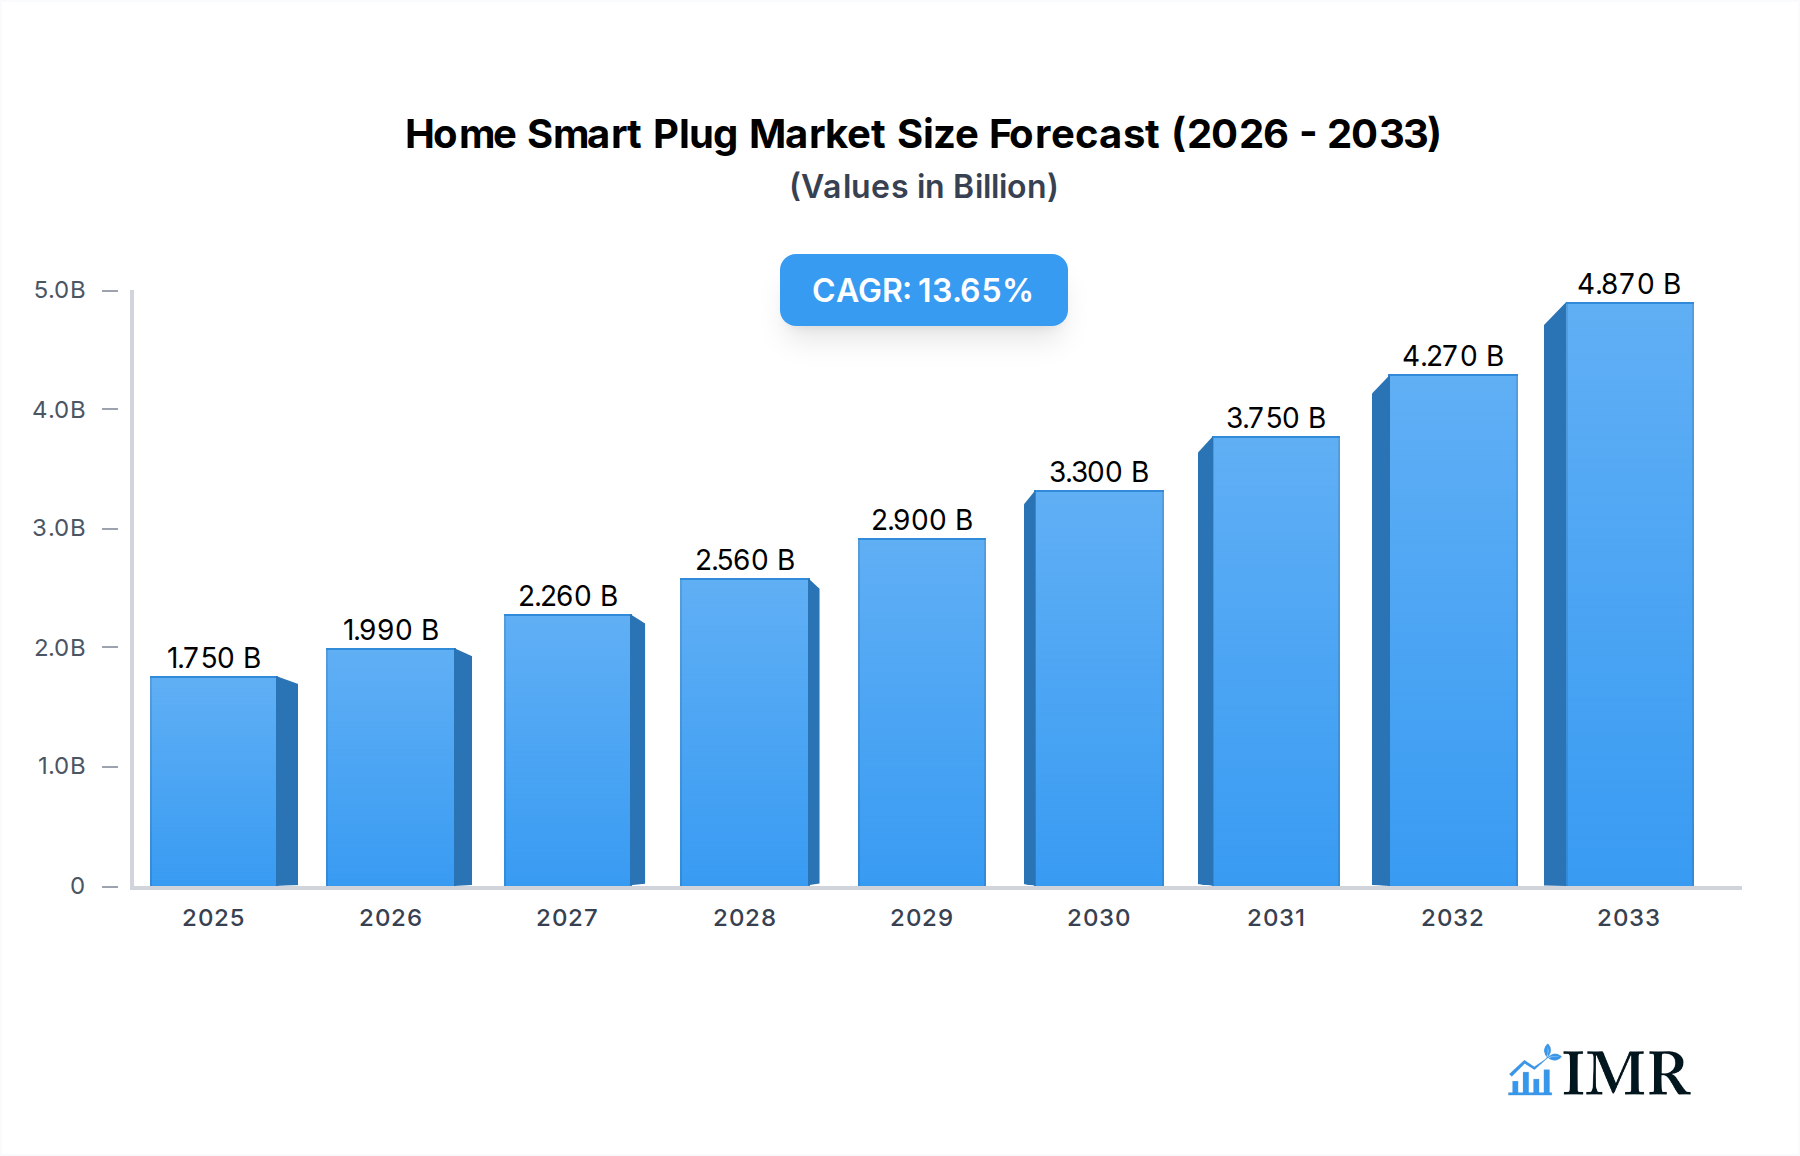
The global Home Smart Plug market is poised for significant expansion, with a current market size of approximately $1664 million and a projected compound annual growth rate (CAGR) of 13.8% through 2033. This robust growth is primarily fueled by the escalating adoption of smart home technologies and the increasing consumer demand for convenience and energy efficiency. The integration of smart plugs into broader smart home ecosystems, enabling seamless control of appliances through voice commands and mobile applications, is a key driver. Furthermore, rising disposable incomes and a growing awareness of the potential for energy savings through smart plug usage are contributing to market penetration. The market is segmented into Online Sales and Offline Sales, with online channels demonstrating a stronger growth trajectory due to the convenience and wider reach offered by e-commerce platforms. Within the product types, both Wired Plugs and Wireless Plugs are experiencing steady demand, catering to diverse user preferences and installation scenarios.

Home Smart Plug Market Size (In Billion)
The market's expansion is also supported by technological advancements, including the introduction of more sophisticated features such as remote monitoring, scheduling, and integration with virtual assistants like Amazon Alexa, Google Assistant, and Apple HomeKit. The competitive landscape features a diverse array of established players and emerging companies, all vying for market share through product innovation, strategic partnerships, and aggressive marketing strategies. While the market is experiencing strong tailwinds, potential restraints include concerns regarding data privacy and security, as well as the initial cost of smart home devices for some consumer segments. However, ongoing price reductions and the perceived long-term value proposition of energy savings and enhanced home automation are expected to mitigate these challenges, ensuring sustained growth and market penetration across all major regions, with Asia Pacific expected to be a significant growth engine.
Home Smart Plug Company Market Share
Report Description: Global Home Smart Plug Market Analysis 2019-2033
This comprehensive report offers an in-depth analysis of the global Home Smart Plug market, encompassing a detailed examination of market dynamics, growth trends, regional dominance, product landscape, key drivers, barriers, challenges, emerging opportunities, growth accelerators, and a thorough competitive analysis. Designed for industry professionals, investors, and market strategists, this report leverages high-traffic keywords to maximize search engine visibility, providing actionable insights into this rapidly expanding sector of the smart home ecosystem. The study period spans from 2019 to 2033, with a base year of 2025 and a forecast period from 2025 to 2033, building upon historical data from 2019 to 2024.
Home Smart Plug Market Dynamics & Structure
The global Home Smart Plug market exhibits a moderate to high concentration, with key players like TP-Link, Amazon, and Philips leading the charge. Technological innovation serves as a primary driver, with advancements in Wi-Fi, Bluetooth, and Matter protocols enabling enhanced connectivity, interoperability, and user experience. The regulatory landscape is evolving, with an increasing focus on data privacy and security standards impacting product development and market entry. Competitive product substitutes include traditional power strips and timers, though the convenience and automation offered by smart plugs are steadily eroding their market share. End-user demographics are shifting towards tech-savvy millennials and Gen Z consumers who prioritize convenience, energy efficiency, and home automation. Merger and acquisition (M&A) trends are observed as larger tech companies seek to consolidate their position in the smart home market, acquiring smaller innovators to expand their product portfolios and market reach. For instance, M&A deal volumes are projected to increase by xx% from 2025 to 2033, driven by strategic acquisitions in connectivity and IoT platforms. Innovation barriers include the high cost of research and development for advanced features and the need for robust cybersecurity measures to maintain consumer trust. The market share of wireless smart plugs is expected to reach approximately 85 million units by 2033, while wired plugs will account for around 30 million units.
Home Smart Plug Growth Trends & Insights
The global Home Smart Plug market is poised for substantial growth, driven by the accelerating adoption of smart home technologies and an increasing consumer demand for convenience and energy management. The market size is projected to expand at a Compound Annual Growth Rate (CAGR) of approximately 18.5% from 2025 to 2033, reaching an estimated value of over $7,500 million by the end of the forecast period. This robust growth is fueled by several interconnected trends. Firstly, the proliferation of affordable and feature-rich smart plugs from companies like Kasa Smart, Meross, and GE is making the technology accessible to a broader consumer base. Secondly, the rising awareness of energy conservation and the desire to reduce utility bills are compelling homeowners to adopt smart plugs for remote control and scheduling of appliances, thereby optimizing energy consumption. Market penetration of smart plugs in developed economies is expected to exceed 60% by 2033, indicating a mature yet still growing market.
Technological disruptions are playing a pivotal role. The widespread adoption of voice assistants from Amazon (Alexa) and Google Assistant has created a seamless integration pathway for smart plugs, enhancing their usability and appeal. Furthermore, the emergence of interoperability standards like Matter is breaking down existing ecosystem silos, allowing smart plugs from different manufacturers to work together harmoniously, thereby simplifying the smart home setup for consumers. This is a significant shift from previous years where proprietary ecosystems often limited consumer choice.
Consumer behavior is also undergoing a notable transformation. Consumers are increasingly seeking integrated smart home solutions rather than individual devices. This has led to a demand for smart plugs that not only offer basic on/off functionality but also provide advanced features such as energy monitoring, custom scheduling, scene creation, and compatibility with other smart home devices. The convenience of remotely controlling appliances from anywhere via a smartphone app is a major selling point, driving adoption across various age groups. The online sales segment is anticipated to continue its dominance, expected to capture approximately 70% of the total market share in 2025, valued at around $2,500 million. Offline sales, while growing, will represent the remaining 30%, projected at $1,000 million.
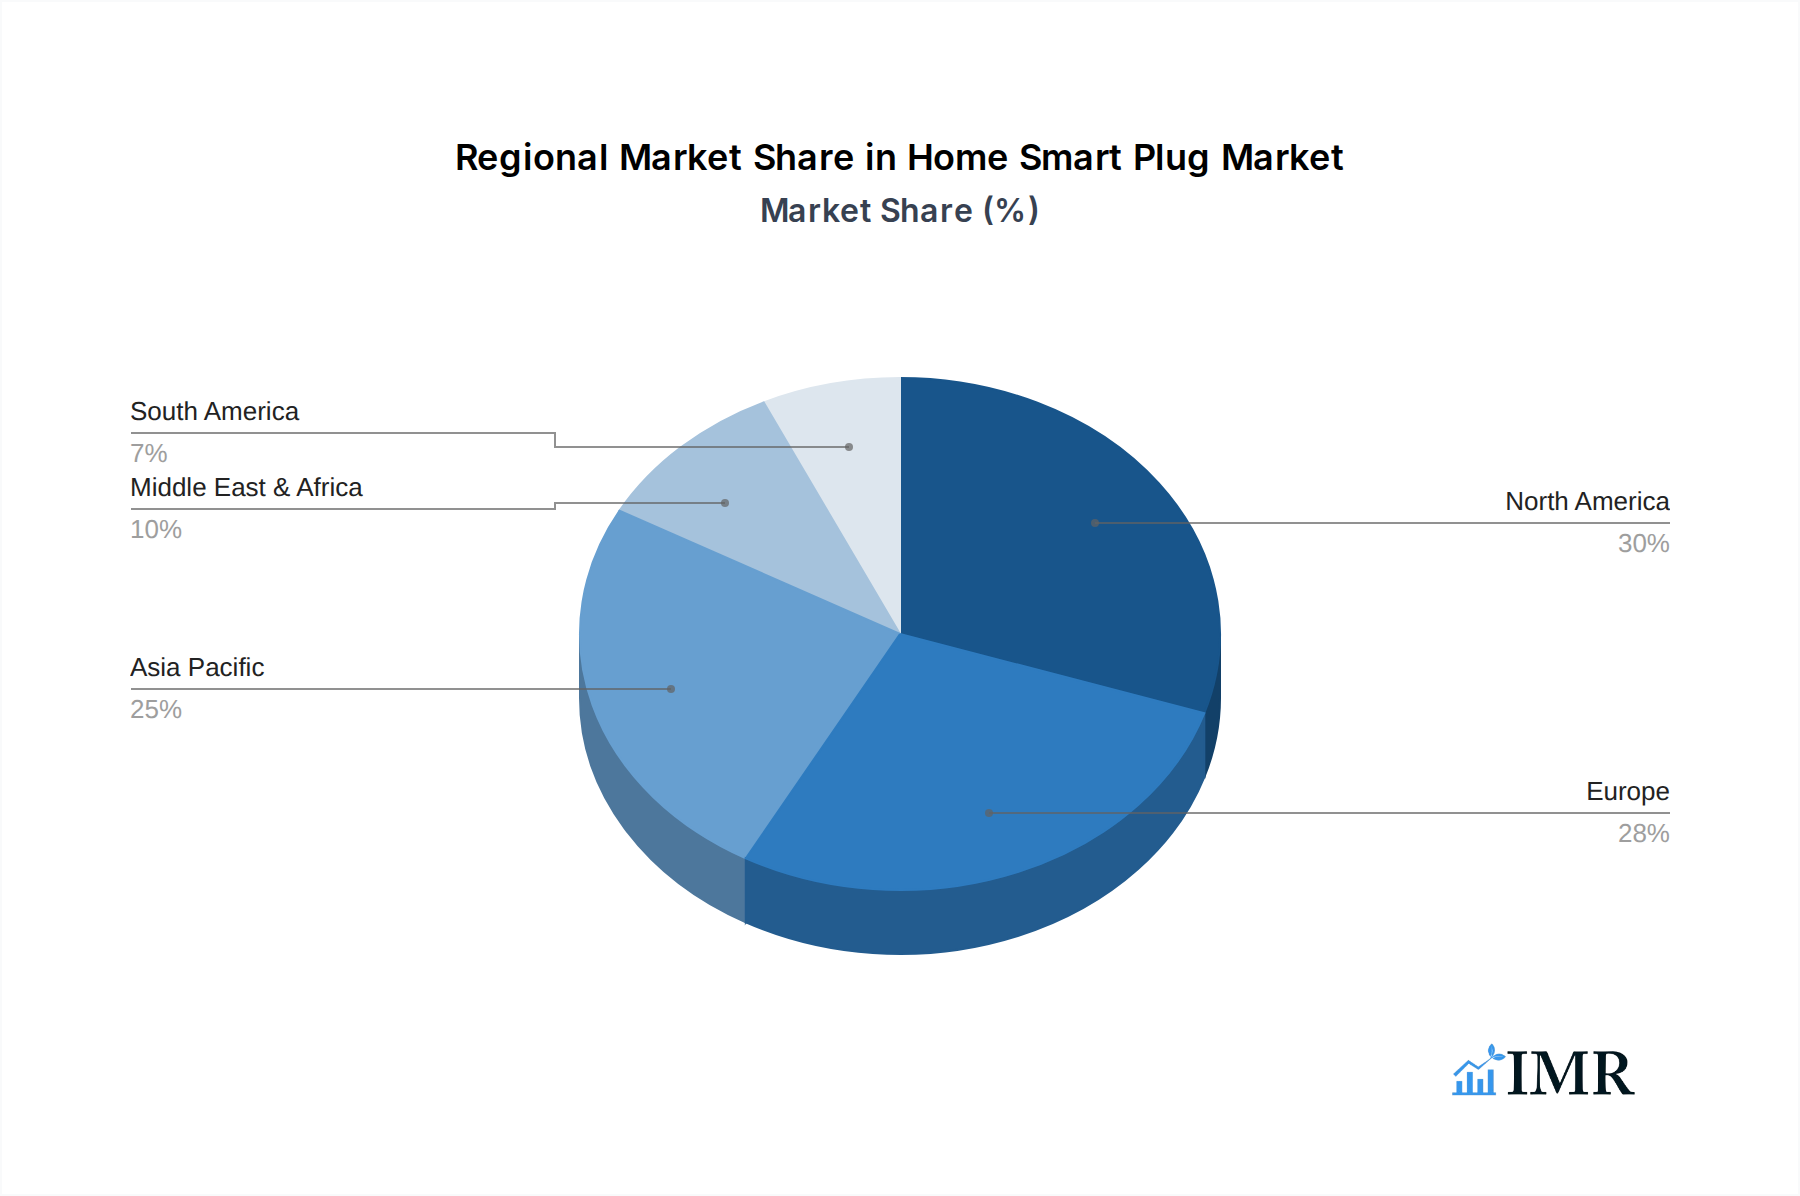
Dominant Regions, Countries, or Segments in Home Smart Plug
North America, particularly the United States, is currently the dominant region in the global Home Smart Plug market, driven by high disposable incomes, widespread adoption of smart home technologies, and robust technological infrastructure. The region's market share is estimated at 35% in 2025, valued at approximately $1,200 million. This dominance is further bolstered by a strong presence of leading manufacturers and a consumer base that readily embraces innovative solutions for home automation and energy efficiency. The US market is characterized by high consumer awareness of smart home benefits, advanced e-commerce platforms facilitating online sales, and a well-developed retail network for offline distribution.
Within the Application segment, Online Sales are the primary growth driver, expected to account for over 70% of the total market share by 2025, estimated at $2,500 million. This is attributed to the convenience of online shopping, wider product selection, competitive pricing, and the ease of comparing features and reviews. E-commerce giants like Amazon, along with specialized tech retailers, have significantly expanded the reach of home smart plugs. Offline Sales, while growing steadily, will represent approximately 30% of the market, valued at $1,000 million in 2025, primarily through big-box electronics stores and home improvement retailers.
In terms of Types, Wireless Plugs are overwhelmingly dominant, projected to capture around 80% of the market share in 2025, valued at approximately $2,800 million. Their ease of installation, flexibility in placement, and compatibility with wireless home networks and voice assistants make them the preferred choice for most consumers. Wired Smart Plugs, while offering a potentially more stable connection in some scenarios, represent a smaller segment of the market, estimated at 20% or $700 million in 2025. Their application is more niche, often found in industrial or specialized residential settings where direct wiring is preferred or required.
Key drivers for North America's dominance include government initiatives promoting energy efficiency, the presence of major smart home technology developers, and a cultural inclination towards early adoption of new technologies. The market penetration in the US is expected to reach over 55% of households by 2030. The growth potential in Asia-Pacific is also significant, with China emerging as a major contributor due to its large population, rapid urbanization, and increasing disposable incomes. The smart plug market in this region is projected to grow at a CAGR of 20% during the forecast period, reaching over $1,500 million by 2033.
Home Smart Plug Product Landscape
The Home Smart Plug product landscape is characterized by continuous innovation, with manufacturers focusing on enhancing functionality, connectivity, and user experience. Current offerings include basic on/off switching, scheduling, and remote control via mobile applications. Advanced features such as real-time energy monitoring, surge protection, and integration with environmental sensors are becoming increasingly common. Products from brands like Etekcity and Kasa Smart offer seamless integration with voice assistants, enabling hands-free operation. Many smart plugs are also designed with compact form factors to avoid blocking adjacent outlets. The technological advancements are largely centered around improved wireless connectivity (Wi-Fi 6, Thread) and enhanced security protocols to protect user data, ensuring the integrity of the smart home network.
Key Drivers, Barriers & Challenges in Home Smart Plug
Key Drivers:
- Growing Smart Home Adoption: Increasing consumer interest in convenience, automation, and energy management is a primary catalyst.
- Affordability and Accessibility: Declining prices and wider availability are making smart plugs more accessible to a mass market.
- Energy Efficiency Concerns: Rising energy costs and environmental consciousness are driving demand for smart devices that help monitor and reduce consumption.
- Technological Advancements: Improvements in connectivity protocols (Wi-Fi, Bluetooth, Matter) and voice assistant integration enhance user experience.
Key Barriers & Challenges:
- Cybersecurity and Privacy Concerns: Consumers are wary of potential data breaches and unauthorized access to their home networks.
- Interoperability Issues: While improving with Matter, compatibility between devices from different manufacturers can still be a challenge for some users.
- Complexity of Setup: For non-tech-savvy individuals, initial setup and network configuration can be daunting.
- Competition from Traditional Devices: Basic timers and power strips still represent a lower-cost alternative for some use cases.
- Supply Chain Disruptions: Global supply chain issues can impact product availability and pricing, affecting xx% of manufacturers.
Emerging Opportunities in Home Smart Plug
Emerging opportunities lie in developing smart plugs with advanced integrated features such as built-in environmental sensing (temperature, humidity), personalized energy usage insights tailored to individual appliance types, and enhanced integration with home security systems for automated responses. The growing trend of the "smart apartment" and multi-dwelling unit integration presents a significant untapped market, requiring bulk deployment solutions. Furthermore, exploring niche applications like smart gardening or pet care automation through intelligently controlled power outlets offers new avenues for product differentiation and market expansion. The development of energy harvesting smart plugs or those with integrated battery backup for critical devices could also address evolving consumer needs.
Growth Accelerators in the Home Smart Plug Industry
Long-term growth in the Home Smart Plug industry will be significantly accelerated by the continued rollout and widespread adoption of the Matter standard, fostering seamless interoperability across diverse smart home ecosystems. Strategic partnerships between smart plug manufacturers and providers of smart home hubs, security systems, and energy management platforms will create bundled offerings and enhance the value proposition for consumers. Furthermore, the increasing focus on sustainability and smart grid integration will drive demand for smart plugs capable of participating in demand-response programs, offering consumers potential financial incentives for optimizing energy usage during peak hours. The continuous evolution of AI and machine learning algorithms to provide predictive energy savings and personalized automation experiences will also act as a major growth catalyst.
Key Players Shaping the Home Smart Plug Market
- Etekcity
- Insteon
- iSmartAlarm
- SDI Technologies
- Belkin International
- Broadlink
- BULL
- Haier
- Leviton
- Panasonic
- EDIMAX Technology
- D-Link
- BN-LINK
- Aoycocr
- TP-Link
- Foxnovo
- GE
- Kasa Smart
- MelonBoy
- Meross
- Peteme
- POWRUI
- Refoss
- TECKIN
- TONBUX
- Amazon
- Lightwave
- Philips
- Humax
- Wemo
Notable Milestones in Home Smart Plug Sector
- 2019: Introduction of advanced energy monitoring features in smart plugs by several leading manufacturers.
- 2020: Significant increase in smart plug adoption driven by work-from-home trends and increased focus on home automation.
- 2021: Growing emphasis on cybersecurity features and data privacy protocols in smart plug development.
- 2022: Launch of Matter, a new smart home connectivity standard, promising greater interoperability.
- 2023: Expansion of smart plug product lines to include outdoor-rated and heavy-duty options.
- 2024: Increased integration of AI for predictive energy management and automated user experiences.
- 2025: Projected significant growth in sales of smart plugs supporting the Matter standard.
- 2026: Anticipated emergence of smart plugs with enhanced sustainability features and energy-harvesting capabilities.
- 2027: Expected consolidation within the market through strategic acquisitions by major tech players.
- 2028: Broad adoption of smart plugs as integral components of smart grid initiatives and demand-response programs.
- 2029: Further miniaturization and integration of smart plug technology into existing home appliances.
- 2030: Increased penetration of smart plugs in multi-dwelling units and commercial smart building applications.
- 2031: Development of advanced AI-driven personalized energy optimization features.
- 2032: Introduction of smart plugs with built-in local processing for enhanced privacy and responsiveness.
- 2033: Projected widespread availability of highly secure and interoperable smart plugs, a cornerstone of mature smart home ecosystems.
In-Depth Home Smart Plug Market Outlook
The future outlook for the Home Smart Plug market is exceptionally bright, fueled by sustained technological innovation, evolving consumer preferences for convenience and efficiency, and the expanding smart home ecosystem. Growth accelerators such as the universal adoption of Matter, strategic alliances between industry leaders, and the integration of smart plugs into smart grid programs will propel market expansion. The continuous development of AI-powered features will offer personalized energy management and automated home experiences, further enhancing user value. As cybersecurity concerns are addressed through robust protocols and enhanced data privacy measures, consumer trust will solidify, paving the way for deeper market penetration and the exploration of novel applications, ultimately cementing the smart plug as an indispensable component of the modern connected home. The market is poised to reach over $7,500 million by 2033, with consistent growth in both online and offline sales channels.
Home Smart Plug Segmentation
-
1. Application
- 1.1. Online Sales
- 1.2. Offline Sales
-
2. Types
- 2.1. Wired Plug
- 2.2. Wireless Plug
Home Smart Plug Segmentation By Geography
-
1. North America
- 1.1. United States
- 1.2. Canada
- 1.3. Mexico
-
2. South America
- 2.1. Brazil
- 2.2. Argentina
- 2.3. Rest of South America
-
3. Europe
- 3.1. United Kingdom
- 3.2. Germany
- 3.3. France
- 3.4. Italy
- 3.5. Spain
- 3.6. Russia
- 3.7. Benelux
- 3.8. Nordics
- 3.9. Rest of Europe
-
4. Middle East & Africa
- 4.1. Turkey
- 4.2. Israel
- 4.3. GCC
- 4.4. North Africa
- 4.5. South Africa
- 4.6. Rest of Middle East & Africa
-
5. Asia Pacific
- 5.1. China
- 5.2. India
- 5.3. Japan
- 5.4. South Korea
- 5.5. ASEAN
- 5.6. Oceania
- 5.7. Rest of Asia Pacific
Home Smart Plug Regional Market Share
Geographic Coverage of Home Smart Plug
Home Smart Plug REPORT HIGHLIGHTS
| Aspects | Details |
|---|---|
| Study Period | 2020-2034 |
| Base Year | 2025 |
| Estimated Year | 2026 |
| Forecast Period | 2026-2034 |
| Historical Period | 2020-2025 |
| Growth Rate | CAGR of 13.8% from 2020-2034 |
| Segmentation |
|
Table of Contents
- 1. Introduction
- 1.1. Research Scope
- 1.2. Market Segmentation
- 1.3. Research Methodology
- 1.4. Definitions and Assumptions
- 2. Executive Summary
- 2.1. Introduction
- 3. Market Dynamics
- 3.1. Introduction
- 3.2. Market Drivers
- 3.3. Market Restrains
- 3.4. Market Trends
- 4. Market Factor Analysis
- 4.1. Porters Five Forces
- 4.2. Supply/Value Chain
- 4.3. PESTEL analysis
- 4.4. Market Entropy
- 4.5. Patent/Trademark Analysis
- 5. Global Home Smart Plug Analysis, Insights and Forecast, 2020-2032
- 5.1. Market Analysis, Insights and Forecast - by Application
- 5.1.1. Online Sales
- 5.1.2. Offline Sales
- 5.2. Market Analysis, Insights and Forecast - by Types
- 5.2.1. Wired Plug
- 5.2.2. Wireless Plug
- 5.3. Market Analysis, Insights and Forecast - by Region
- 5.3.1. North America
- 5.3.2. South America
- 5.3.3. Europe
- 5.3.4. Middle East & Africa
- 5.3.5. Asia Pacific
- 5.1. Market Analysis, Insights and Forecast - by Application
- 6. North America Home Smart Plug Analysis, Insights and Forecast, 2020-2032
- 6.1. Market Analysis, Insights and Forecast - by Application
- 6.1.1. Online Sales
- 6.1.2. Offline Sales
- 6.2. Market Analysis, Insights and Forecast - by Types
- 6.2.1. Wired Plug
- 6.2.2. Wireless Plug
- 6.1. Market Analysis, Insights and Forecast - by Application
- 7. South America Home Smart Plug Analysis, Insights and Forecast, 2020-2032
- 7.1. Market Analysis, Insights and Forecast - by Application
- 7.1.1. Online Sales
- 7.1.2. Offline Sales
- 7.2. Market Analysis, Insights and Forecast - by Types
- 7.2.1. Wired Plug
- 7.2.2. Wireless Plug
- 7.1. Market Analysis, Insights and Forecast - by Application
- 8. Europe Home Smart Plug Analysis, Insights and Forecast, 2020-2032
- 8.1. Market Analysis, Insights and Forecast - by Application
- 8.1.1. Online Sales
- 8.1.2. Offline Sales
- 8.2. Market Analysis, Insights and Forecast - by Types
- 8.2.1. Wired Plug
- 8.2.2. Wireless Plug
- 8.1. Market Analysis, Insights and Forecast - by Application
- 9. Middle East & Africa Home Smart Plug Analysis, Insights and Forecast, 2020-2032
- 9.1. Market Analysis, Insights and Forecast - by Application
- 9.1.1. Online Sales
- 9.1.2. Offline Sales
- 9.2. Market Analysis, Insights and Forecast - by Types
- 9.2.1. Wired Plug
- 9.2.2. Wireless Plug
- 9.1. Market Analysis, Insights and Forecast - by Application
- 10. Asia Pacific Home Smart Plug Analysis, Insights and Forecast, 2020-2032
- 10.1. Market Analysis, Insights and Forecast - by Application
- 10.1.1. Online Sales
- 10.1.2. Offline Sales
- 10.2. Market Analysis, Insights and Forecast - by Types
- 10.2.1. Wired Plug
- 10.2.2. Wireless Plug
- 10.1. Market Analysis, Insights and Forecast - by Application
- 11. Competitive Analysis
- 11.1. Global Market Share Analysis 2025
- 11.2. Company Profiles
- 11.2.1 Etekcity
- 11.2.1.1. Overview
- 11.2.1.2. Products
- 11.2.1.3. SWOT Analysis
- 11.2.1.4. Recent Developments
- 11.2.1.5. Financials (Based on Availability)
- 11.2.2 Insteon
- 11.2.2.1. Overview
- 11.2.2.2. Products
- 11.2.2.3. SWOT Analysis
- 11.2.2.4. Recent Developments
- 11.2.2.5. Financials (Based on Availability)
- 11.2.3 iSmartAlarm
- 11.2.3.1. Overview
- 11.2.3.2. Products
- 11.2.3.3. SWOT Analysis
- 11.2.3.4. Recent Developments
- 11.2.3.5. Financials (Based on Availability)
- 11.2.4 SDI Technologies
- 11.2.4.1. Overview
- 11.2.4.2. Products
- 11.2.4.3. SWOT Analysis
- 11.2.4.4. Recent Developments
- 11.2.4.5. Financials (Based on Availability)
- 11.2.5 Belkin International
- 11.2.5.1. Overview
- 11.2.5.2. Products
- 11.2.5.3. SWOT Analysis
- 11.2.5.4. Recent Developments
- 11.2.5.5. Financials (Based on Availability)
- 11.2.6 Broadlink
- 11.2.6.1. Overview
- 11.2.6.2. Products
- 11.2.6.3. SWOT Analysis
- 11.2.6.4. Recent Developments
- 11.2.6.5. Financials (Based on Availability)
- 11.2.7 BULL
- 11.2.7.1. Overview
- 11.2.7.2. Products
- 11.2.7.3. SWOT Analysis
- 11.2.7.4. Recent Developments
- 11.2.7.5. Financials (Based on Availability)
- 11.2.8 Haier
- 11.2.8.1. Overview
- 11.2.8.2. Products
- 11.2.8.3. SWOT Analysis
- 11.2.8.4. Recent Developments
- 11.2.8.5. Financials (Based on Availability)
- 11.2.9 Leviton
- 11.2.9.1. Overview
- 11.2.9.2. Products
- 11.2.9.3. SWOT Analysis
- 11.2.9.4. Recent Developments
- 11.2.9.5. Financials (Based on Availability)
- 11.2.10 Panasonic
- 11.2.10.1. Overview
- 11.2.10.2. Products
- 11.2.10.3. SWOT Analysis
- 11.2.10.4. Recent Developments
- 11.2.10.5. Financials (Based on Availability)
- 11.2.11 EDIMAX Technology
- 11.2.11.1. Overview
- 11.2.11.2. Products
- 11.2.11.3. SWOT Analysis
- 11.2.11.4. Recent Developments
- 11.2.11.5. Financials (Based on Availability)
- 11.2.12 D-Link
- 11.2.12.1. Overview
- 11.2.12.2. Products
- 11.2.12.3. SWOT Analysis
- 11.2.12.4. Recent Developments
- 11.2.12.5. Financials (Based on Availability)
- 11.2.13 BN-LINK
- 11.2.13.1. Overview
- 11.2.13.2. Products
- 11.2.13.3. SWOT Analysis
- 11.2.13.4. Recent Developments
- 11.2.13.5. Financials (Based on Availability)
- 11.2.14 Aoycocr
- 11.2.14.1. Overview
- 11.2.14.2. Products
- 11.2.14.3. SWOT Analysis
- 11.2.14.4. Recent Developments
- 11.2.14.5. Financials (Based on Availability)
- 11.2.15 TP-Link
- 11.2.15.1. Overview
- 11.2.15.2. Products
- 11.2.15.3. SWOT Analysis
- 11.2.15.4. Recent Developments
- 11.2.15.5. Financials (Based on Availability)
- 11.2.16 Foxnovo
- 11.2.16.1. Overview
- 11.2.16.2. Products
- 11.2.16.3. SWOT Analysis
- 11.2.16.4. Recent Developments
- 11.2.16.5. Financials (Based on Availability)
- 11.2.17 GE
- 11.2.17.1. Overview
- 11.2.17.2. Products
- 11.2.17.3. SWOT Analysis
- 11.2.17.4. Recent Developments
- 11.2.17.5. Financials (Based on Availability)
- 11.2.18 Kasa Smart
- 11.2.18.1. Overview
- 11.2.18.2. Products
- 11.2.18.3. SWOT Analysis
- 11.2.18.4. Recent Developments
- 11.2.18.5. Financials (Based on Availability)
- 11.2.19 MelonBoy
- 11.2.19.1. Overview
- 11.2.19.2. Products
- 11.2.19.3. SWOT Analysis
- 11.2.19.4. Recent Developments
- 11.2.19.5. Financials (Based on Availability)
- 11.2.20 Meross
- 11.2.20.1. Overview
- 11.2.20.2. Products
- 11.2.20.3. SWOT Analysis
- 11.2.20.4. Recent Developments
- 11.2.20.5. Financials (Based on Availability)
- 11.2.21 Peteme
- 11.2.21.1. Overview
- 11.2.21.2. Products
- 11.2.21.3. SWOT Analysis
- 11.2.21.4. Recent Developments
- 11.2.21.5. Financials (Based on Availability)
- 11.2.22 POWRUI
- 11.2.22.1. Overview
- 11.2.22.2. Products
- 11.2.22.3. SWOT Analysis
- 11.2.22.4. Recent Developments
- 11.2.22.5. Financials (Based on Availability)
- 11.2.23 Refoss
- 11.2.23.1. Overview
- 11.2.23.2. Products
- 11.2.23.3. SWOT Analysis
- 11.2.23.4. Recent Developments
- 11.2.23.5. Financials (Based on Availability)
- 11.2.24 TECKIN
- 11.2.24.1. Overview
- 11.2.24.2. Products
- 11.2.24.3. SWOT Analysis
- 11.2.24.4. Recent Developments
- 11.2.24.5. Financials (Based on Availability)
- 11.2.25 TONBUX
- 11.2.25.1. Overview
- 11.2.25.2. Products
- 11.2.25.3. SWOT Analysis
- 11.2.25.4. Recent Developments
- 11.2.25.5. Financials (Based on Availability)
- 11.2.26 Amazon
- 11.2.26.1. Overview
- 11.2.26.2. Products
- 11.2.26.3. SWOT Analysis
- 11.2.26.4. Recent Developments
- 11.2.26.5. Financials (Based on Availability)
- 11.2.27 Lightwave
- 11.2.27.1. Overview
- 11.2.27.2. Products
- 11.2.27.3. SWOT Analysis
- 11.2.27.4. Recent Developments
- 11.2.27.5. Financials (Based on Availability)
- 11.2.28 Philips
- 11.2.28.1. Overview
- 11.2.28.2. Products
- 11.2.28.3. SWOT Analysis
- 11.2.28.4. Recent Developments
- 11.2.28.5. Financials (Based on Availability)
- 11.2.29 Humax
- 11.2.29.1. Overview
- 11.2.29.2. Products
- 11.2.29.3. SWOT Analysis
- 11.2.29.4. Recent Developments
- 11.2.29.5. Financials (Based on Availability)
- 11.2.30 Wemo
- 11.2.30.1. Overview
- 11.2.30.2. Products
- 11.2.30.3. SWOT Analysis
- 11.2.30.4. Recent Developments
- 11.2.30.5. Financials (Based on Availability)
- 11.2.1 Etekcity
List of Figures
- Figure 1: Global Home Smart Plug Revenue Breakdown (million, %) by Region 2025 & 2033
- Figure 2: North America Home Smart Plug Revenue (million), by Application 2025 & 2033
- Figure 3: North America Home Smart Plug Revenue Share (%), by Application 2025 & 2033
- Figure 4: North America Home Smart Plug Revenue (million), by Types 2025 & 2033
- Figure 5: North America Home Smart Plug Revenue Share (%), by Types 2025 & 2033
- Figure 6: North America Home Smart Plug Revenue (million), by Country 2025 & 2033
- Figure 7: North America Home Smart Plug Revenue Share (%), by Country 2025 & 2033
- Figure 8: South America Home Smart Plug Revenue (million), by Application 2025 & 2033
- Figure 9: South America Home Smart Plug Revenue Share (%), by Application 2025 & 2033
- Figure 10: South America Home Smart Plug Revenue (million), by Types 2025 & 2033
- Figure 11: South America Home Smart Plug Revenue Share (%), by Types 2025 & 2033
- Figure 12: South America Home Smart Plug Revenue (million), by Country 2025 & 2033
- Figure 13: South America Home Smart Plug Revenue Share (%), by Country 2025 & 2033
- Figure 14: Europe Home Smart Plug Revenue (million), by Application 2025 & 2033
- Figure 15: Europe Home Smart Plug Revenue Share (%), by Application 2025 & 2033
- Figure 16: Europe Home Smart Plug Revenue (million), by Types 2025 & 2033
- Figure 17: Europe Home Smart Plug Revenue Share (%), by Types 2025 & 2033
- Figure 18: Europe Home Smart Plug Revenue (million), by Country 2025 & 2033
- Figure 19: Europe Home Smart Plug Revenue Share (%), by Country 2025 & 2033
- Figure 20: Middle East & Africa Home Smart Plug Revenue (million), by Application 2025 & 2033
- Figure 21: Middle East & Africa Home Smart Plug Revenue Share (%), by Application 2025 & 2033
- Figure 22: Middle East & Africa Home Smart Plug Revenue (million), by Types 2025 & 2033
- Figure 23: Middle East & Africa Home Smart Plug Revenue Share (%), by Types 2025 & 2033
- Figure 24: Middle East & Africa Home Smart Plug Revenue (million), by Country 2025 & 2033
- Figure 25: Middle East & Africa Home Smart Plug Revenue Share (%), by Country 2025 & 2033
- Figure 26: Asia Pacific Home Smart Plug Revenue (million), by Application 2025 & 2033
- Figure 27: Asia Pacific Home Smart Plug Revenue Share (%), by Application 2025 & 2033
- Figure 28: Asia Pacific Home Smart Plug Revenue (million), by Types 2025 & 2033
- Figure 29: Asia Pacific Home Smart Plug Revenue Share (%), by Types 2025 & 2033
- Figure 30: Asia Pacific Home Smart Plug Revenue (million), by Country 2025 & 2033
- Figure 31: Asia Pacific Home Smart Plug Revenue Share (%), by Country 2025 & 2033
List of Tables
- Table 1: Global Home Smart Plug Revenue million Forecast, by Application 2020 & 2033
- Table 2: Global Home Smart Plug Revenue million Forecast, by Types 2020 & 2033
- Table 3: Global Home Smart Plug Revenue million Forecast, by Region 2020 & 2033
- Table 4: Global Home Smart Plug Revenue million Forecast, by Application 2020 & 2033
- Table 5: Global Home Smart Plug Revenue million Forecast, by Types 2020 & 2033
- Table 6: Global Home Smart Plug Revenue million Forecast, by Country 2020 & 2033
- Table 7: United States Home Smart Plug Revenue (million) Forecast, by Application 2020 & 2033
- Table 8: Canada Home Smart Plug Revenue (million) Forecast, by Application 2020 & 2033
- Table 9: Mexico Home Smart Plug Revenue (million) Forecast, by Application 2020 & 2033
- Table 10: Global Home Smart Plug Revenue million Forecast, by Application 2020 & 2033
- Table 11: Global Home Smart Plug Revenue million Forecast, by Types 2020 & 2033
- Table 12: Global Home Smart Plug Revenue million Forecast, by Country 2020 & 2033
- Table 13: Brazil Home Smart Plug Revenue (million) Forecast, by Application 2020 & 2033
- Table 14: Argentina Home Smart Plug Revenue (million) Forecast, by Application 2020 & 2033
- Table 15: Rest of South America Home Smart Plug Revenue (million) Forecast, by Application 2020 & 2033
- Table 16: Global Home Smart Plug Revenue million Forecast, by Application 2020 & 2033
- Table 17: Global Home Smart Plug Revenue million Forecast, by Types 2020 & 2033
- Table 18: Global Home Smart Plug Revenue million Forecast, by Country 2020 & 2033
- Table 19: United Kingdom Home Smart Plug Revenue (million) Forecast, by Application 2020 & 2033
- Table 20: Germany Home Smart Plug Revenue (million) Forecast, by Application 2020 & 2033
- Table 21: France Home Smart Plug Revenue (million) Forecast, by Application 2020 & 2033
- Table 22: Italy Home Smart Plug Revenue (million) Forecast, by Application 2020 & 2033
- Table 23: Spain Home Smart Plug Revenue (million) Forecast, by Application 2020 & 2033
- Table 24: Russia Home Smart Plug Revenue (million) Forecast, by Application 2020 & 2033
- Table 25: Benelux Home Smart Plug Revenue (million) Forecast, by Application 2020 & 2033
- Table 26: Nordics Home Smart Plug Revenue (million) Forecast, by Application 2020 & 2033
- Table 27: Rest of Europe Home Smart Plug Revenue (million) Forecast, by Application 2020 & 2033
- Table 28: Global Home Smart Plug Revenue million Forecast, by Application 2020 & 2033
- Table 29: Global Home Smart Plug Revenue million Forecast, by Types 2020 & 2033
- Table 30: Global Home Smart Plug Revenue million Forecast, by Country 2020 & 2033
- Table 31: Turkey Home Smart Plug Revenue (million) Forecast, by Application 2020 & 2033
- Table 32: Israel Home Smart Plug Revenue (million) Forecast, by Application 2020 & 2033
- Table 33: GCC Home Smart Plug Revenue (million) Forecast, by Application 2020 & 2033
- Table 34: North Africa Home Smart Plug Revenue (million) Forecast, by Application 2020 & 2033
- Table 35: South Africa Home Smart Plug Revenue (million) Forecast, by Application 2020 & 2033
- Table 36: Rest of Middle East & Africa Home Smart Plug Revenue (million) Forecast, by Application 2020 & 2033
- Table 37: Global Home Smart Plug Revenue million Forecast, by Application 2020 & 2033
- Table 38: Global Home Smart Plug Revenue million Forecast, by Types 2020 & 2033
- Table 39: Global Home Smart Plug Revenue million Forecast, by Country 2020 & 2033
- Table 40: China Home Smart Plug Revenue (million) Forecast, by Application 2020 & 2033
- Table 41: India Home Smart Plug Revenue (million) Forecast, by Application 2020 & 2033
- Table 42: Japan Home Smart Plug Revenue (million) Forecast, by Application 2020 & 2033
- Table 43: South Korea Home Smart Plug Revenue (million) Forecast, by Application 2020 & 2033
- Table 44: ASEAN Home Smart Plug Revenue (million) Forecast, by Application 2020 & 2033
- Table 45: Oceania Home Smart Plug Revenue (million) Forecast, by Application 2020 & 2033
- Table 46: Rest of Asia Pacific Home Smart Plug Revenue (million) Forecast, by Application 2020 & 2033
Frequently Asked Questions
1. What is the projected Compound Annual Growth Rate (CAGR) of the Home Smart Plug?
The projected CAGR is approximately 13.8%.
2. Which companies are prominent players in the Home Smart Plug?
Key companies in the market include Etekcity, Insteon, iSmartAlarm, SDI Technologies, Belkin International, Broadlink, BULL, Haier, Leviton, Panasonic, EDIMAX Technology, D-Link, BN-LINK, Aoycocr, TP-Link, Foxnovo, GE, Kasa Smart, MelonBoy, Meross, Peteme, POWRUI, Refoss, TECKIN, TONBUX, Amazon, Lightwave, Philips, Humax, Wemo.
3. What are the main segments of the Home Smart Plug?
The market segments include Application, Types.
4. Can you provide details about the market size?
The market size is estimated to be USD 1664 million as of 2022.
5. What are some drivers contributing to market growth?
N/A
6. What are the notable trends driving market growth?
N/A
7. Are there any restraints impacting market growth?
N/A
8. Can you provide examples of recent developments in the market?
N/A
9. What pricing options are available for accessing the report?
Pricing options include single-user, multi-user, and enterprise licenses priced at USD 2900.00, USD 4350.00, and USD 5800.00 respectively.
10. Is the market size provided in terms of value or volume?
The market size is provided in terms of value, measured in million.
11. Are there any specific market keywords associated with the report?
Yes, the market keyword associated with the report is "Home Smart Plug," which aids in identifying and referencing the specific market segment covered.
12. How do I determine which pricing option suits my needs best?
The pricing options vary based on user requirements and access needs. Individual users may opt for single-user licenses, while businesses requiring broader access may choose multi-user or enterprise licenses for cost-effective access to the report.
13. Are there any additional resources or data provided in the Home Smart Plug report?
While the report offers comprehensive insights, it's advisable to review the specific contents or supplementary materials provided to ascertain if additional resources or data are available.
14. How can I stay updated on further developments or reports in the Home Smart Plug?
To stay informed about further developments, trends, and reports in the Home Smart Plug, consider subscribing to industry newsletters, following relevant companies and organizations, or regularly checking reputable industry news sources and publications.
Methodology
Step 1 - Identification of Relevant Samples Size from Population Database


Step 2 - Approaches for Defining Global Market Size (Value, Volume* & Price*)

Note*: In applicable scenarios
Step 3 - Data Sources
Primary Research
- Web Analytics
- Survey Reports
- Research Institute
- Latest Research Reports
- Opinion Leaders
Secondary Research
- Annual Reports
- White Paper
- Latest Press Release
- Industry Association
- Paid Database
- Investor Presentations

Step 4 - Data Triangulation
Involves using different sources of information in order to increase the validity of a study
These sources are likely to be stakeholders in a program - participants, other researchers, program staff, other community members, and so on.
Then we put all data in single framework & apply various statistical tools to find out the dynamic on the market.
During the analysis stage, feedback from the stakeholder groups would be compared to determine areas of agreement as well as areas of divergence