

Key Insights
The global household insecticides market, valued at an estimated $12.6 billion in 2025, is projected for substantial growth, forecasting a Compound Annual Growth Rate (CAGR) of 3.2% from 2025 to 2033. This expansion is propelled by heightened awareness of vector-borne diseases such as dengue, Zika, and malaria, driving demand for effective mosquito control solutions. Increased urbanization and population density contribute to pest proliferation, necessitating regular insecticide use. Evolving lifestyles and a demand for convenience further support the adoption of ready-to-use aerosol sprays and liquid formulations. The market is segmented by insect type (mosquitoes & flies, rodents, termites, bed bugs & beetles, others), chemical type (synthetic, natural), and form (dust & granules, liquids, aerosol sprays, others). While synthetic insecticides currently lead, growing environmental and health concerns are spurring demand for natural alternatives. North America and Europe represent significant markets, with the Asia Pacific region showing high growth potential due to rapid urbanization and economic development. However, stringent regulations and increasing consumer awareness of potential health risks present challenges.
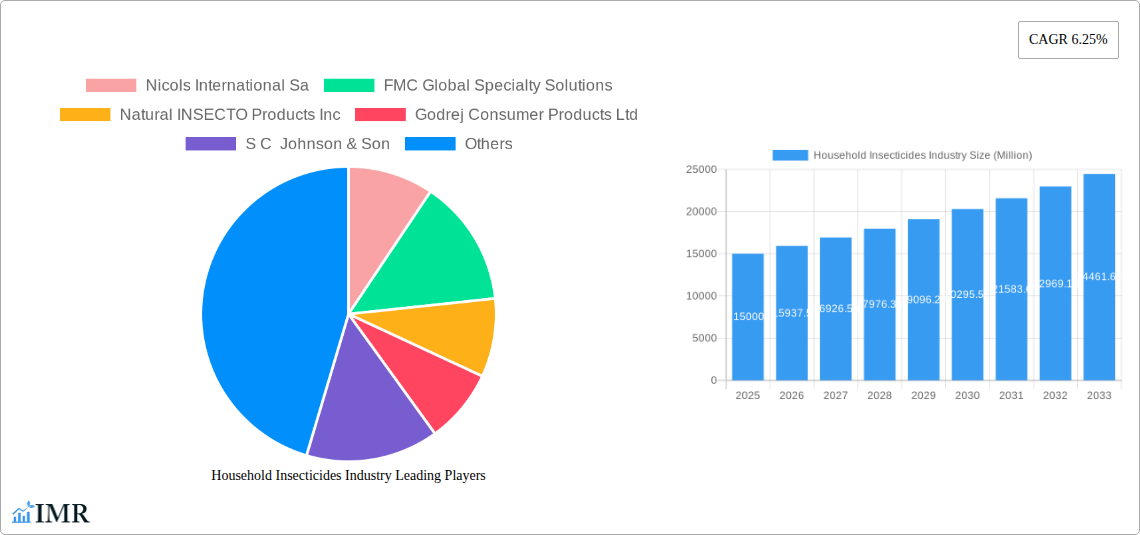
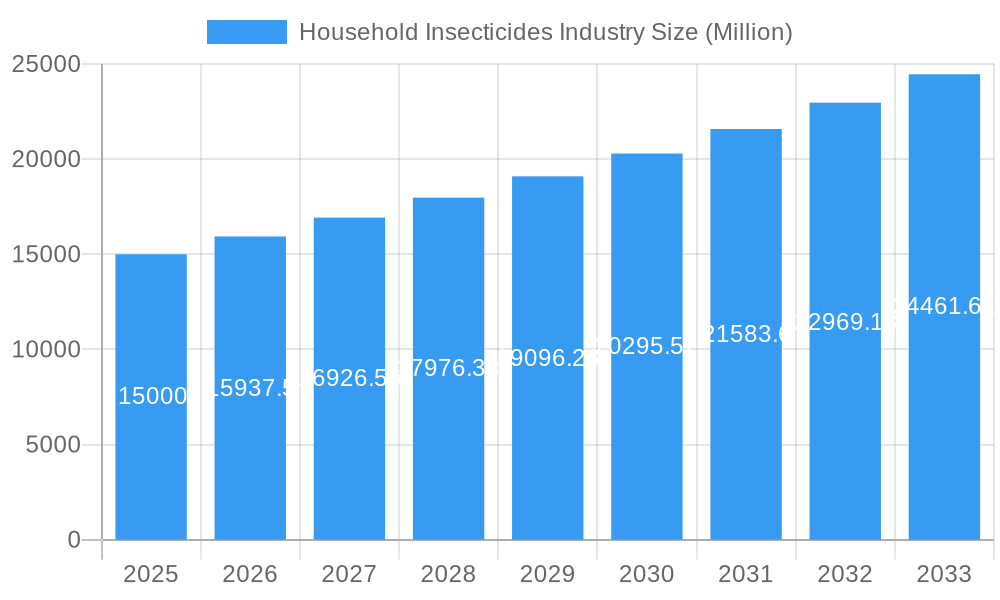
Household Insecticides Industry Market Size (In Billion)
The competitive landscape features a blend of multinational corporations and regional players. Leading companies, including Nicols International SA, FMC Global Specialty Solutions, and Godrej Consumer Products Ltd., are prioritizing research and development for innovative, eco-friendly products. Future market dynamics will be shaped by technological advancements in insecticide formulations, shifting consumer preferences towards sustainable options, and government regulations balancing pest control with environmental preservation. The forecast period (2025-2033) indicates sustained growth, presenting opportunities for companies adept at meeting consumer needs and adapting to regulatory shifts. Product diversification and strategic alliances are crucial for success in this evolving market.
Household Insecticides Industry Company Market Share
Household Insecticides Industry Market Report: 2019-2033
This comprehensive report provides a detailed analysis of the global household insecticides market, encompassing market dynamics, growth trends, regional segmentation, product landscape, key players, and future outlook. The study period spans from 2019 to 2033, with 2025 as the base and estimated year. The report is invaluable for industry professionals, investors, and anyone seeking a deep understanding of this dynamic market. Parent market (Pest Control Industry) and child markets (e.g., Mosquito Repellents, Rodenticides) are thoroughly examined. Market values are presented in million units.
Household Insecticides Industry Market Dynamics & Structure
The household insecticides market is characterized by moderate concentration, with several multinational players and regional brands competing. Technological innovation, particularly in active ingredients and formulation, is a key driver, alongside evolving regulatory frameworks concerning chemical usage and environmental impact. The market faces competition from alternative pest control methods (e.g., natural repellents, pest control services). End-user demographics, particularly in developing economies with high insect-borne disease prevalence, significantly influence market demand. Mergers and acquisitions (M&A) activity has been relatively low in recent years (xx deals in the last 5 years), driven by strategic consolidation within the sector.
- Market Concentration: Moderately concentrated, with top 5 players holding approximately xx% market share in 2024.
- Technological Innovation: Focus on efficacy, safety, and environmentally friendly formulations.
- Regulatory Framework: Stringent regulations on pesticide registration and usage vary across regions.
- Competitive Substitutes: Growing demand for natural and organic pest control methods.
- End-User Demographics: High population density and prevalence of vector-borne diseases in developing nations fuel demand.
- M&A Trends: Consolidation expected to increase, with focus on acquiring specialized technologies and expanding geographic reach.
Household Insecticides Industry Growth Trends & Insights
The global household insecticides market experienced robust growth between 2019 and 2024, exhibiting a CAGR of xx%. This growth is attributed to factors such as rising awareness of pest-borne diseases, increasing urbanization, and growing disposable incomes in emerging markets. Technological advancements, particularly the development of more effective and eco-friendly products, have further boosted market expansion. Consumer behavior has shifted toward preference for convenient, ready-to-use formulations (e.g., aerosol sprays) and products offering longer duration of protection. Market penetration in several regions remains low, offering substantial growth potential in the forecast period (2025-2033), projected to reach xx million units by 2033 with a CAGR of xx%.
Dominant Regions, Countries, or Segments in Household Insecticides Industry
The Asia-Pacific region is currently the dominant market for household insecticides, driven by high population density, favorable climatic conditions for pest proliferation, and increasing disposable incomes. Within this region, India and China are leading countries. Segment-wise, the Mosquitoes & Flies segment holds the largest market share (xx%), followed by Rats & other Rodents (xx%). Synthetic chemical-based insecticides dominate the market (xx%), although demand for natural insecticides is increasing. Aerosol sprays represent the most popular form (xx%), benefiting from convenience and wide application.
- Key Drivers: High population density, favorable climate, rising disposable incomes, increasing awareness of vector-borne diseases, and government initiatives for disease control in Asia-Pacific.
- Dominance Factors: Market share and growth potential, driven by factors like high demand, presence of major manufacturers, and favorable regulatory environment.
Household Insecticides Industry Product Landscape
The household insecticide market presents a diverse range of products catering to various insect types and preferences. Innovation focuses on improving efficacy, safety, and environmental friendliness. Product formulations range from traditional aerosols and liquids to innovative solutions like electric mosquito repellents and natural based products. Unique selling propositions emphasize factors such as extended protection durations, targeted efficacy against specific pests, and minimal environmental impact. Technological advancements in active ingredients and delivery systems continually enhance product performance and consumer experience.
Key Drivers, Barriers & Challenges in Household Insecticides Industry
Key Drivers: Rising prevalence of vector-borne diseases, increasing urbanization, growing disposable incomes in emerging economies, and technological advancements in product formulation.
Key Challenges: Stringent regulatory hurdles, concerns regarding environmental impact of chemical insecticides, competition from alternative pest control methods, and fluctuations in raw material prices. These challenges impose a negative impact on the market growth, estimated at approximately xx% reduction in the projected growth by 2030.
Emerging Opportunities in Household Insecticides Industry
Untapped markets in developing regions, growing demand for eco-friendly and natural insecticides, increasing focus on IoT-enabled pest control solutions, and expanding applications in commercial and industrial settings represent significant opportunities.
Growth Accelerators in the Household Insecticides Industry Industry
Technological breakthroughs in active ingredient development, strategic partnerships between insecticide manufacturers and distributors, expansion into new geographic markets, and effective marketing campaigns promoting product efficacy and safety will be crucial in accelerating market growth.
Key Players Shaping the Household Insecticides Industry Market
- Nicols International Sa
- FMC Global Specialty Solutions
- Natural INSECTO Products Inc
- Godrej Consumer Products Ltd
- S C Johnson & Son
- Spectrum Brands Holdin
- Amplecta AB
- Shogun Organics
Notable Milestones in Household Insecticides Industry Sector
- February 2023: Godrej Consumer Products Ltd launched a low-cost liquid mosquito repellent device and a no-gas instant mosquito-kill spray, boosting its market share in India.
- May 2022: Spectrum Brand Holdings Inc. relaunched Cutter insect repellant with improved packaging and branding, enhancing consumer appeal and product differentiation.
In-Depth Household Insecticides Industry Market Outlook
The future of the household insecticides market is promising, driven by the aforementioned growth accelerators. Strategic investments in research and development, expansion into underpenetrated markets, and a focus on sustainable and eco-friendly solutions will be key to unlocking long-term growth potential. The market is poised for significant expansion, with opportunities for both established players and new entrants to capitalize on evolving consumer preferences and technological advancements.
Household Insecticides Industry Segmentation
- 1. Production Analysis
- 2. Consumption Analysis
- 3. Import Market Analysis (Value & Volume)
- 4. Export Market Analysis (Value & Volume)
- 5. Price Trend Analysis
Household Insecticides Industry Segmentation By Geography
-
1. North America
- 1.1. United States
- 1.2. Canada
- 1.3. Mexico
-
2. South America
- 2.1. Brazil
- 2.2. Argentina
- 2.3. Rest of South America
-
3. Europe
- 3.1. United Kingdom
- 3.2. Germany
- 3.3. France
- 3.4. Italy
- 3.5. Spain
- 3.6. Russia
- 3.7. Benelux
- 3.8. Nordics
- 3.9. Rest of Europe
-
4. Middle East & Africa
- 4.1. Turkey
- 4.2. Israel
- 4.3. GCC
- 4.4. North Africa
- 4.5. South Africa
- 4.6. Rest of Middle East & Africa
-
5. Asia Pacific
- 5.1. China
- 5.2. India
- 5.3. Japan
- 5.4. South Korea
- 5.5. ASEAN
- 5.6. Oceania
- 5.7. Rest of Asia Pacific
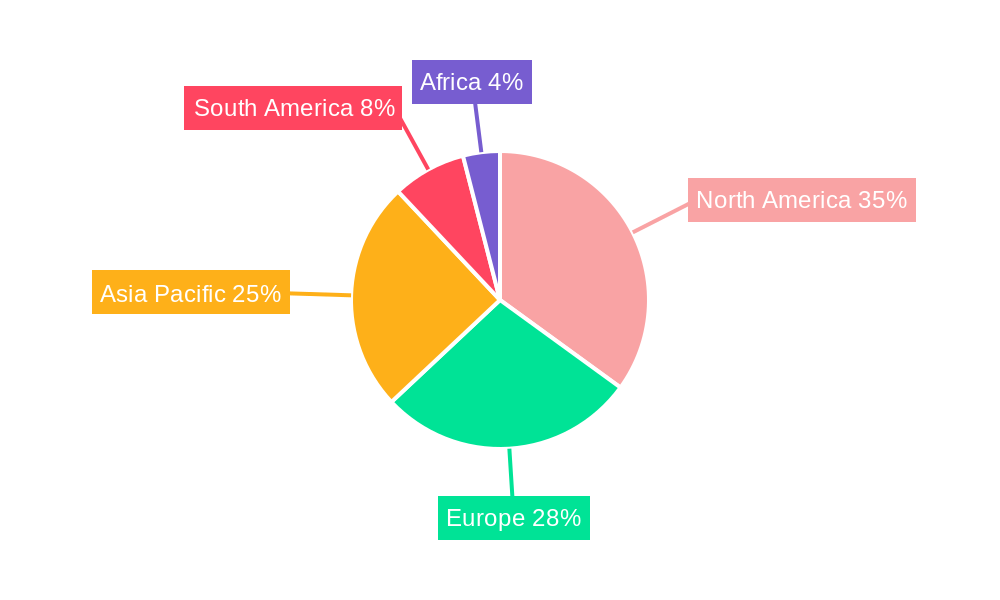
Household Insecticides Industry Regional Market Share
Geographic Coverage of Household Insecticides Industry
Household Insecticides Industry REPORT HIGHLIGHTS
| Aspects | Details |
|---|---|
| Study Period | 2020-2034 |
| Base Year | 2025 |
| Estimated Year | 2026 |
| Forecast Period | 2026-2034 |
| Historical Period | 2020-2025 |
| Growth Rate | CAGR of 3.2% from 2020-2034 |
| Segmentation |
|
Table of Contents
- 1. Introduction
- 1.1. Research Scope
- 1.2. Market Segmentation
- 1.3. Research Objective
- 1.4. Definitions and Assumptions
- 2. Executive Summary
- 2.1. Market Snapshot
- 3. Market Dynamics
- 3.1. Market Drivers
- 3.2. Market Restrains
- 3.3. Market Trends
- 3.4. Market Opportunities
- 4. Market Factor Analysis
- 4.1. Porters Five Forces
- 4.1.1. Bargaining Power of Suppliers
- 4.1.2. Bargaining Power of Buyers
- 4.1.3. Threat of New Entrants
- 4.1.4. Threat of Substitutes
- 4.1.5. Competitive Rivalry
- 4.2. PESTEL analysis
- 4.3. BCG Analysis
- 4.3.1. Stars (High Growth, High Market Share)
- 4.3.2. Cash Cows (Low Growth, High Market Share)
- 4.3.3. Question Mark (High Growth, Low Market Share)
- 4.3.4. Dogs (Low Growth, Low Market Share)
- 4.4. Ansoff Matrix Analysis
- 4.5. Supply Chain Analysis
- 4.6. Regulatory Landscape
- 4.7. Current Market Potential and Opportunity Assessment (TAM–SAM–SOM Framework)
- 4.8. IMR Analyst Note
- 4.1. Porters Five Forces
- 5. Market Analysis, Insights and Forecast 2021-2033
- 5.1. Market Analysis, Insights and Forecast - by Production Analysis
- 5.2. Market Analysis, Insights and Forecast - by Consumption Analysis
- 5.3. Market Analysis, Insights and Forecast - by Import Market Analysis (Value & Volume)
- 5.4. Market Analysis, Insights and Forecast - by Export Market Analysis (Value & Volume)
- 5.5. Market Analysis, Insights and Forecast - by Price Trend Analysis
- 5.6. Market Analysis, Insights and Forecast - by Region
- 5.6.1. North America
- 5.6.2. South America
- 5.6.3. Europe
- 5.6.4. Middle East & Africa
- 5.6.5. Asia Pacific
- 6. Global Household Insecticides Industry Analysis, Insights and Forecast, 2021-2033
- 6.1. Market Analysis, Insights and Forecast - by Production Analysis
- 6.2. Market Analysis, Insights and Forecast - by Consumption Analysis
- 6.3. Market Analysis, Insights and Forecast - by Import Market Analysis (Value & Volume)
- 6.4. Market Analysis, Insights and Forecast - by Export Market Analysis (Value & Volume)
- 6.5. Market Analysis, Insights and Forecast - by Price Trend Analysis
- 7. North America Household Insecticides Industry Analysis, Insights and Forecast, 2020-2032
- 7.1. Market Analysis, Insights and Forecast - by Production Analysis
- 7.2. Market Analysis, Insights and Forecast - by Consumption Analysis
- 7.3. Market Analysis, Insights and Forecast - by Import Market Analysis (Value & Volume)
- 7.4. Market Analysis, Insights and Forecast - by Export Market Analysis (Value & Volume)
- 7.5. Market Analysis, Insights and Forecast - by Price Trend Analysis
- 8. South America Household Insecticides Industry Analysis, Insights and Forecast, 2020-2032
- 8.1. Market Analysis, Insights and Forecast - by Production Analysis
- 8.2. Market Analysis, Insights and Forecast - by Consumption Analysis
- 8.3. Market Analysis, Insights and Forecast - by Import Market Analysis (Value & Volume)
- 8.4. Market Analysis, Insights and Forecast - by Export Market Analysis (Value & Volume)
- 8.5. Market Analysis, Insights and Forecast - by Price Trend Analysis
- 9. Europe Household Insecticides Industry Analysis, Insights and Forecast, 2020-2032
- 9.1. Market Analysis, Insights and Forecast - by Production Analysis
- 9.2. Market Analysis, Insights and Forecast - by Consumption Analysis
- 9.3. Market Analysis, Insights and Forecast - by Import Market Analysis (Value & Volume)
- 9.4. Market Analysis, Insights and Forecast - by Export Market Analysis (Value & Volume)
- 9.5. Market Analysis, Insights and Forecast - by Price Trend Analysis
- 10. Middle East & Africa Household Insecticides Industry Analysis, Insights and Forecast, 2020-2032
- 10.1. Market Analysis, Insights and Forecast - by Production Analysis
- 10.2. Market Analysis, Insights and Forecast - by Consumption Analysis
- 10.3. Market Analysis, Insights and Forecast - by Import Market Analysis (Value & Volume)
- 10.4. Market Analysis, Insights and Forecast - by Export Market Analysis (Value & Volume)
- 10.5. Market Analysis, Insights and Forecast - by Price Trend Analysis
- 11. Asia Pacific Household Insecticides Industry Analysis, Insights and Forecast, 2020-2032
- 11.1. Market Analysis, Insights and Forecast - by Production Analysis
- 11.2. Market Analysis, Insights and Forecast - by Consumption Analysis
- 11.3. Market Analysis, Insights and Forecast - by Import Market Analysis (Value & Volume)
- 11.4. Market Analysis, Insights and Forecast - by Export Market Analysis (Value & Volume)
- 11.5. Market Analysis, Insights and Forecast - by Price Trend Analysis
- 12. Competitive Analysis
- 12.1. Company Profiles
- 12.1.1 Nicols International Sa
- 12.1.1.1. Company Overview
- 12.1.1.2. Products
- 12.1.1.3. Company Financials
- 12.1.1.4. SWOT Analysis
- 12.1.2 FMC Global Specialty Solutions
- 12.1.2.1. Company Overview
- 12.1.2.2. Products
- 12.1.2.3. Company Financials
- 12.1.2.4. SWOT Analysis
- 12.1.3 Natural INSECTO Products Inc
- 12.1.3.1. Company Overview
- 12.1.3.2. Products
- 12.1.3.3. Company Financials
- 12.1.3.4. SWOT Analysis
- 12.1.4 Godrej Consumer Products Ltd
- 12.1.4.1. Company Overview
- 12.1.4.2. Products
- 12.1.4.3. Company Financials
- 12.1.4.4. SWOT Analysis
- 12.1.5 S C Johnson & Son
- 12.1.5.1. Company Overview
- 12.1.5.2. Products
- 12.1.5.3. Company Financials
- 12.1.5.4. SWOT Analysis
- 12.1.6 Spectrum Brands Holdin
- 12.1.6.1. Company Overview
- 12.1.6.2. Products
- 12.1.6.3. Company Financials
- 12.1.6.4. SWOT Analysis
- 12.1.7 Amplecta AB
- 12.1.7.1. Company Overview
- 12.1.7.2. Products
- 12.1.7.3. Company Financials
- 12.1.7.4. SWOT Analysis
- 12.1.8 Shogun Organics
- 12.1.8.1. Company Overview
- 12.1.8.2. Products
- 12.1.8.3. Company Financials
- 12.1.8.4. SWOT Analysis
- 12.1.1 Nicols International Sa
- 12.2. Market Entropy
- 12.2.1 Company's Key Areas Served
- 12.2.2 Recent Developments
- 12.3. Company Market Share Analysis 2025
- 12.3.1 Top 5 Companies Market Share Analysis
- 12.3.2 Top 3 Companies Market Share Analysis
- 12.4. List of Potential Customers
- 13. Research Methodology
List of Figures
- Figure 1: Global Household Insecticides Industry Revenue Breakdown (billion, %) by Region 2025 & 2033
- Figure 2: North America Household Insecticides Industry Revenue (billion), by Production Analysis 2025 & 2033
- Figure 3: North America Household Insecticides Industry Revenue Share (%), by Production Analysis 2025 & 2033
- Figure 4: North America Household Insecticides Industry Revenue (billion), by Consumption Analysis 2025 & 2033
- Figure 5: North America Household Insecticides Industry Revenue Share (%), by Consumption Analysis 2025 & 2033
- Figure 6: North America Household Insecticides Industry Revenue (billion), by Import Market Analysis (Value & Volume) 2025 & 2033
- Figure 7: North America Household Insecticides Industry Revenue Share (%), by Import Market Analysis (Value & Volume) 2025 & 2033
- Figure 8: North America Household Insecticides Industry Revenue (billion), by Export Market Analysis (Value & Volume) 2025 & 2033
- Figure 9: North America Household Insecticides Industry Revenue Share (%), by Export Market Analysis (Value & Volume) 2025 & 2033
- Figure 10: North America Household Insecticides Industry Revenue (billion), by Price Trend Analysis 2025 & 2033
- Figure 11: North America Household Insecticides Industry Revenue Share (%), by Price Trend Analysis 2025 & 2033
- Figure 12: North America Household Insecticides Industry Revenue (billion), by Country 2025 & 2033
- Figure 13: North America Household Insecticides Industry Revenue Share (%), by Country 2025 & 2033
- Figure 14: South America Household Insecticides Industry Revenue (billion), by Production Analysis 2025 & 2033
- Figure 15: South America Household Insecticides Industry Revenue Share (%), by Production Analysis 2025 & 2033
- Figure 16: South America Household Insecticides Industry Revenue (billion), by Consumption Analysis 2025 & 2033
- Figure 17: South America Household Insecticides Industry Revenue Share (%), by Consumption Analysis 2025 & 2033
- Figure 18: South America Household Insecticides Industry Revenue (billion), by Import Market Analysis (Value & Volume) 2025 & 2033
- Figure 19: South America Household Insecticides Industry Revenue Share (%), by Import Market Analysis (Value & Volume) 2025 & 2033
- Figure 20: South America Household Insecticides Industry Revenue (billion), by Export Market Analysis (Value & Volume) 2025 & 2033
- Figure 21: South America Household Insecticides Industry Revenue Share (%), by Export Market Analysis (Value & Volume) 2025 & 2033
- Figure 22: South America Household Insecticides Industry Revenue (billion), by Price Trend Analysis 2025 & 2033
- Figure 23: South America Household Insecticides Industry Revenue Share (%), by Price Trend Analysis 2025 & 2033
- Figure 24: South America Household Insecticides Industry Revenue (billion), by Country 2025 & 2033
- Figure 25: South America Household Insecticides Industry Revenue Share (%), by Country 2025 & 2033
- Figure 26: Europe Household Insecticides Industry Revenue (billion), by Production Analysis 2025 & 2033
- Figure 27: Europe Household Insecticides Industry Revenue Share (%), by Production Analysis 2025 & 2033
- Figure 28: Europe Household Insecticides Industry Revenue (billion), by Consumption Analysis 2025 & 2033
- Figure 29: Europe Household Insecticides Industry Revenue Share (%), by Consumption Analysis 2025 & 2033
- Figure 30: Europe Household Insecticides Industry Revenue (billion), by Import Market Analysis (Value & Volume) 2025 & 2033
- Figure 31: Europe Household Insecticides Industry Revenue Share (%), by Import Market Analysis (Value & Volume) 2025 & 2033
- Figure 32: Europe Household Insecticides Industry Revenue (billion), by Export Market Analysis (Value & Volume) 2025 & 2033
- Figure 33: Europe Household Insecticides Industry Revenue Share (%), by Export Market Analysis (Value & Volume) 2025 & 2033
- Figure 34: Europe Household Insecticides Industry Revenue (billion), by Price Trend Analysis 2025 & 2033
- Figure 35: Europe Household Insecticides Industry Revenue Share (%), by Price Trend Analysis 2025 & 2033
- Figure 36: Europe Household Insecticides Industry Revenue (billion), by Country 2025 & 2033
- Figure 37: Europe Household Insecticides Industry Revenue Share (%), by Country 2025 & 2033
- Figure 38: Middle East & Africa Household Insecticides Industry Revenue (billion), by Production Analysis 2025 & 2033
- Figure 39: Middle East & Africa Household Insecticides Industry Revenue Share (%), by Production Analysis 2025 & 2033
- Figure 40: Middle East & Africa Household Insecticides Industry Revenue (billion), by Consumption Analysis 2025 & 2033
- Figure 41: Middle East & Africa Household Insecticides Industry Revenue Share (%), by Consumption Analysis 2025 & 2033
- Figure 42: Middle East & Africa Household Insecticides Industry Revenue (billion), by Import Market Analysis (Value & Volume) 2025 & 2033
- Figure 43: Middle East & Africa Household Insecticides Industry Revenue Share (%), by Import Market Analysis (Value & Volume) 2025 & 2033
- Figure 44: Middle East & Africa Household Insecticides Industry Revenue (billion), by Export Market Analysis (Value & Volume) 2025 & 2033
- Figure 45: Middle East & Africa Household Insecticides Industry Revenue Share (%), by Export Market Analysis (Value & Volume) 2025 & 2033
- Figure 46: Middle East & Africa Household Insecticides Industry Revenue (billion), by Price Trend Analysis 2025 & 2033
- Figure 47: Middle East & Africa Household Insecticides Industry Revenue Share (%), by Price Trend Analysis 2025 & 2033
- Figure 48: Middle East & Africa Household Insecticides Industry Revenue (billion), by Country 2025 & 2033
- Figure 49: Middle East & Africa Household Insecticides Industry Revenue Share (%), by Country 2025 & 2033
- Figure 50: Asia Pacific Household Insecticides Industry Revenue (billion), by Production Analysis 2025 & 2033
- Figure 51: Asia Pacific Household Insecticides Industry Revenue Share (%), by Production Analysis 2025 & 2033
- Figure 52: Asia Pacific Household Insecticides Industry Revenue (billion), by Consumption Analysis 2025 & 2033
- Figure 53: Asia Pacific Household Insecticides Industry Revenue Share (%), by Consumption Analysis 2025 & 2033
- Figure 54: Asia Pacific Household Insecticides Industry Revenue (billion), by Import Market Analysis (Value & Volume) 2025 & 2033
- Figure 55: Asia Pacific Household Insecticides Industry Revenue Share (%), by Import Market Analysis (Value & Volume) 2025 & 2033
- Figure 56: Asia Pacific Household Insecticides Industry Revenue (billion), by Export Market Analysis (Value & Volume) 2025 & 2033
- Figure 57: Asia Pacific Household Insecticides Industry Revenue Share (%), by Export Market Analysis (Value & Volume) 2025 & 2033
- Figure 58: Asia Pacific Household Insecticides Industry Revenue (billion), by Price Trend Analysis 2025 & 2033
- Figure 59: Asia Pacific Household Insecticides Industry Revenue Share (%), by Price Trend Analysis 2025 & 2033
- Figure 60: Asia Pacific Household Insecticides Industry Revenue (billion), by Country 2025 & 2033
- Figure 61: Asia Pacific Household Insecticides Industry Revenue Share (%), by Country 2025 & 2033
List of Tables
- Table 1: Global Household Insecticides Industry Revenue billion Forecast, by Production Analysis 2020 & 2033
- Table 2: Global Household Insecticides Industry Revenue billion Forecast, by Consumption Analysis 2020 & 2033
- Table 3: Global Household Insecticides Industry Revenue billion Forecast, by Import Market Analysis (Value & Volume) 2020 & 2033
- Table 4: Global Household Insecticides Industry Revenue billion Forecast, by Export Market Analysis (Value & Volume) 2020 & 2033
- Table 5: Global Household Insecticides Industry Revenue billion Forecast, by Price Trend Analysis 2020 & 2033
- Table 6: Global Household Insecticides Industry Revenue billion Forecast, by Region 2020 & 2033
- Table 7: Global Household Insecticides Industry Revenue billion Forecast, by Production Analysis 2020 & 2033
- Table 8: Global Household Insecticides Industry Revenue billion Forecast, by Consumption Analysis 2020 & 2033
- Table 9: Global Household Insecticides Industry Revenue billion Forecast, by Import Market Analysis (Value & Volume) 2020 & 2033
- Table 10: Global Household Insecticides Industry Revenue billion Forecast, by Export Market Analysis (Value & Volume) 2020 & 2033
- Table 11: Global Household Insecticides Industry Revenue billion Forecast, by Price Trend Analysis 2020 & 2033
- Table 12: Global Household Insecticides Industry Revenue billion Forecast, by Country 2020 & 2033
- Table 13: United States Household Insecticides Industry Revenue (billion) Forecast, by Application 2020 & 2033
- Table 14: Canada Household Insecticides Industry Revenue (billion) Forecast, by Application 2020 & 2033
- Table 15: Mexico Household Insecticides Industry Revenue (billion) Forecast, by Application 2020 & 2033
- Table 16: Global Household Insecticides Industry Revenue billion Forecast, by Production Analysis 2020 & 2033
- Table 17: Global Household Insecticides Industry Revenue billion Forecast, by Consumption Analysis 2020 & 2033
- Table 18: Global Household Insecticides Industry Revenue billion Forecast, by Import Market Analysis (Value & Volume) 2020 & 2033
- Table 19: Global Household Insecticides Industry Revenue billion Forecast, by Export Market Analysis (Value & Volume) 2020 & 2033
- Table 20: Global Household Insecticides Industry Revenue billion Forecast, by Price Trend Analysis 2020 & 2033
- Table 21: Global Household Insecticides Industry Revenue billion Forecast, by Country 2020 & 2033
- Table 22: Brazil Household Insecticides Industry Revenue (billion) Forecast, by Application 2020 & 2033
- Table 23: Argentina Household Insecticides Industry Revenue (billion) Forecast, by Application 2020 & 2033
- Table 24: Rest of South America Household Insecticides Industry Revenue (billion) Forecast, by Application 2020 & 2033
- Table 25: Global Household Insecticides Industry Revenue billion Forecast, by Production Analysis 2020 & 2033
- Table 26: Global Household Insecticides Industry Revenue billion Forecast, by Consumption Analysis 2020 & 2033
- Table 27: Global Household Insecticides Industry Revenue billion Forecast, by Import Market Analysis (Value & Volume) 2020 & 2033
- Table 28: Global Household Insecticides Industry Revenue billion Forecast, by Export Market Analysis (Value & Volume) 2020 & 2033
- Table 29: Global Household Insecticides Industry Revenue billion Forecast, by Price Trend Analysis 2020 & 2033
- Table 30: Global Household Insecticides Industry Revenue billion Forecast, by Country 2020 & 2033
- Table 31: United Kingdom Household Insecticides Industry Revenue (billion) Forecast, by Application 2020 & 2033
- Table 32: Germany Household Insecticides Industry Revenue (billion) Forecast, by Application 2020 & 2033
- Table 33: France Household Insecticides Industry Revenue (billion) Forecast, by Application 2020 & 2033
- Table 34: Italy Household Insecticides Industry Revenue (billion) Forecast, by Application 2020 & 2033
- Table 35: Spain Household Insecticides Industry Revenue (billion) Forecast, by Application 2020 & 2033
- Table 36: Russia Household Insecticides Industry Revenue (billion) Forecast, by Application 2020 & 2033
- Table 37: Benelux Household Insecticides Industry Revenue (billion) Forecast, by Application 2020 & 2033
- Table 38: Nordics Household Insecticides Industry Revenue (billion) Forecast, by Application 2020 & 2033
- Table 39: Rest of Europe Household Insecticides Industry Revenue (billion) Forecast, by Application 2020 & 2033
- Table 40: Global Household Insecticides Industry Revenue billion Forecast, by Production Analysis 2020 & 2033
- Table 41: Global Household Insecticides Industry Revenue billion Forecast, by Consumption Analysis 2020 & 2033
- Table 42: Global Household Insecticides Industry Revenue billion Forecast, by Import Market Analysis (Value & Volume) 2020 & 2033
- Table 43: Global Household Insecticides Industry Revenue billion Forecast, by Export Market Analysis (Value & Volume) 2020 & 2033
- Table 44: Global Household Insecticides Industry Revenue billion Forecast, by Price Trend Analysis 2020 & 2033
- Table 45: Global Household Insecticides Industry Revenue billion Forecast, by Country 2020 & 2033
- Table 46: Turkey Household Insecticides Industry Revenue (billion) Forecast, by Application 2020 & 2033
- Table 47: Israel Household Insecticides Industry Revenue (billion) Forecast, by Application 2020 & 2033
- Table 48: GCC Household Insecticides Industry Revenue (billion) Forecast, by Application 2020 & 2033
- Table 49: North Africa Household Insecticides Industry Revenue (billion) Forecast, by Application 2020 & 2033
- Table 50: South Africa Household Insecticides Industry Revenue (billion) Forecast, by Application 2020 & 2033
- Table 51: Rest of Middle East & Africa Household Insecticides Industry Revenue (billion) Forecast, by Application 2020 & 2033
- Table 52: Global Household Insecticides Industry Revenue billion Forecast, by Production Analysis 2020 & 2033
- Table 53: Global Household Insecticides Industry Revenue billion Forecast, by Consumption Analysis 2020 & 2033
- Table 54: Global Household Insecticides Industry Revenue billion Forecast, by Import Market Analysis (Value & Volume) 2020 & 2033
- Table 55: Global Household Insecticides Industry Revenue billion Forecast, by Export Market Analysis (Value & Volume) 2020 & 2033
- Table 56: Global Household Insecticides Industry Revenue billion Forecast, by Price Trend Analysis 2020 & 2033
- Table 57: Global Household Insecticides Industry Revenue billion Forecast, by Country 2020 & 2033
- Table 58: China Household Insecticides Industry Revenue (billion) Forecast, by Application 2020 & 2033
- Table 59: India Household Insecticides Industry Revenue (billion) Forecast, by Application 2020 & 2033
- Table 60: Japan Household Insecticides Industry Revenue (billion) Forecast, by Application 2020 & 2033
- Table 61: South Korea Household Insecticides Industry Revenue (billion) Forecast, by Application 2020 & 2033
- Table 62: ASEAN Household Insecticides Industry Revenue (billion) Forecast, by Application 2020 & 2033
- Table 63: Oceania Household Insecticides Industry Revenue (billion) Forecast, by Application 2020 & 2033
- Table 64: Rest of Asia Pacific Household Insecticides Industry Revenue (billion) Forecast, by Application 2020 & 2033
Frequently Asked Questions
1. What is the projected Compound Annual Growth Rate (CAGR) of the Household Insecticides Industry?
The projected CAGR is approximately 3.2%.
2. Which companies are prominent players in the Household Insecticides Industry?
Key companies in the market include Nicols International Sa, FMC Global Specialty Solutions, Natural INSECTO Products Inc, Godrej Consumer Products Ltd, S C Johnson & Son, Spectrum Brands Holdin, Amplecta AB, Shogun Organics.
3. What are the main segments of the Household Insecticides Industry?
The market segments include Production Analysis, Consumption Analysis, Import Market Analysis (Value & Volume), Export Market Analysis (Value & Volume), Price Trend Analysis.
4. Can you provide details about the market size?
The market size is estimated to be USD 12.6 billion as of 2022.
5. What are some drivers contributing to market growth?
Seed Treatment As A Solution To Enhance Yield; Growing Awareness For Seed Treatment Among The Farmers; Rising Trend Of Organic Farming.
6. What are the notable trends driving market growth?
Rising Prevalence of Insect-borne Diseases.
7. Are there any restraints impacting market growth?
Limitations Across Farm-Level Seed Treatment; Rising Environmental Concerns.
8. Can you provide examples of recent developments in the market?
February 2023: Godrej Consumer Products Ltd launched two homegrown innovations; a low-cost liquid mosquito repellent device and a no-gas instant mosquito-kill spray. The products were launched in the presence of experts from the National Center for Vector-Borne Diseases Control (NCVDC), Malaria no more India, Fortis Hospital, Noida, among others.
9. What pricing options are available for accessing the report?
Pricing options include single-user, multi-user, and enterprise licenses priced at USD 4750, USD 5250, and USD 8750 respectively.
10. Is the market size provided in terms of value or volume?
The market size is provided in terms of value, measured in billion.
11. Are there any specific market keywords associated with the report?
Yes, the market keyword associated with the report is "Household Insecticides Industry," which aids in identifying and referencing the specific market segment covered.
12. How do I determine which pricing option suits my needs best?
The pricing options vary based on user requirements and access needs. Individual users may opt for single-user licenses, while businesses requiring broader access may choose multi-user or enterprise licenses for cost-effective access to the report.
13. Are there any additional resources or data provided in the Household Insecticides Industry report?
While the report offers comprehensive insights, it's advisable to review the specific contents or supplementary materials provided to ascertain if additional resources or data are available.
14. How can I stay updated on further developments or reports in the Household Insecticides Industry?
To stay informed about further developments, trends, and reports in the Household Insecticides Industry, consider subscribing to industry newsletters, following relevant companies and organizations, or regularly checking reputable industry news sources and publications.
Methodology
Step 1 - Identification of Relevant Samples Size from Population Database


Step 2 - Approaches for Defining Global Market Size (Value, Volume* & Price*)

Note*: In applicable scenarios
Step 3 - Data Sources
Primary Research
- Web Analytics
- Survey Reports
- Research Institute
- Latest Research Reports
- Opinion Leaders
Secondary Research
- Annual Reports
- White Paper
- Latest Press Release
- Industry Association
- Paid Database
- Investor Presentations

Step 4 - Data Triangulation
Involves using different sources of information in order to increase the validity of a study
These sources are likely to be stakeholders in a program - participants, other researchers, program staff, other community members, and so on.
Then we put all data in single framework & apply various statistical tools to find out the dynamic on the market.
During the analysis stage, feedback from the stakeholder groups would be compared to determine areas of agreement as well as areas of divergence