

Key Insights
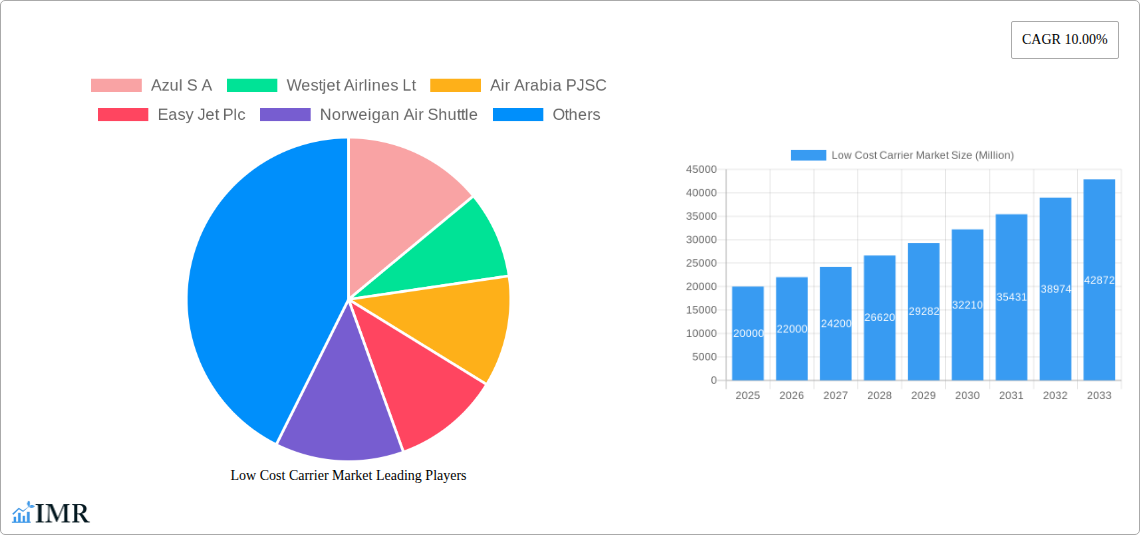
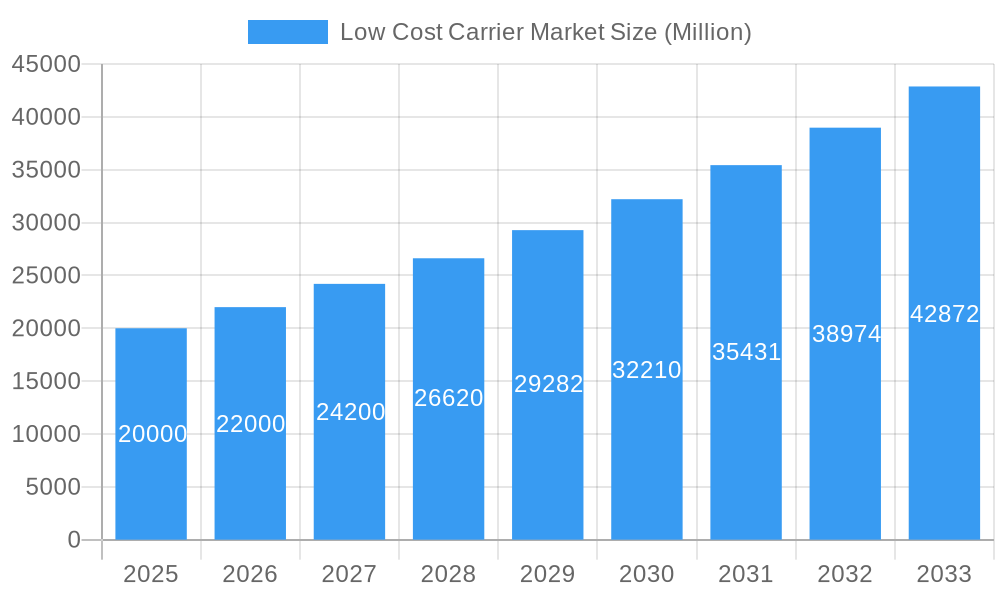
The low-cost carrier (LCC) market, currently experiencing robust growth, is projected to maintain a Compound Annual Growth Rate (CAGR) of 10% from 2025 to 2033. This expansion is driven by several key factors. Increased disposable incomes in emerging economies, particularly in Asia-Pacific, are fueling demand for affordable air travel. Technological advancements, such as improved online booking systems and ancillary revenue generation strategies (e.g., baggage fees, seat selection), are enhancing LCC profitability and efficiency. Furthermore, the trend towards point-to-point travel, bypassing major hub airports, is further boosting the LCC model's appeal. However, the market faces challenges, including rising fuel prices, increased competition from traditional airlines adopting low-cost strategies, and potential economic downturns impacting consumer spending. The market segmentation reveals significant regional variations, with Asia-Pacific and North America leading in terms of market share, driven by their large populations and robust economic growth. The segment split across aircraft types (narrow-body and wide-body) and distribution channels (online vs. travel agencies) demonstrates a strong preference for online booking and the dominance of narrow-body aircraft in the LCC fleet. The competitive landscape is highly fragmented, with a mix of established global players and regional LCCs. Successfully navigating the fluctuating fuel prices and intense competition will be crucial for sustained growth. The future outlook for the LCC market remains positive, provided players can effectively manage operational costs and adapt to evolving consumer preferences.
Low Cost Carrier Market Market Size (In Billion)
The strategic focus for LCCs will likely revolve around operational efficiency, technological integration, and a refined understanding of customer needs in each specific market. Further expansion into underserved markets, particularly in Africa and Latin America, presents lucrative opportunities for growth. However, expansion requires careful consideration of local regulations, infrastructure limitations, and cultural nuances. Developing strategic partnerships with local businesses and authorities will be paramount for effective market penetration. Furthermore, environmental concerns related to aviation emissions are beginning to influence consumer choice and may necessitate investment in sustainable aviation fuels and operational strategies to mitigate the industry's environmental impact. Differentiation through enhanced customer service, loyalty programs, and ancillary services will be crucial for LCCs to stand out in a competitive marketplace.
Low Cost Carrier Market Company Market Share
This comprehensive report provides an in-depth analysis of the Low Cost Carrier (LCC) market, encompassing its dynamics, growth trends, dominant segments, key players, and future outlook. The study period covers 2019-2033, with 2025 as the base and estimated year. The report meticulously examines the parent market (Air Transportation) and its child market (Low Cost Carriers), offering valuable insights for industry professionals, investors, and strategic decision-makers. Market values are presented in Million units.
Low Cost Carrier Market Dynamics & Structure
The LCC market exhibits a dynamic interplay of factors influencing its structure and growth. Market concentration is moderately high, with a few major players holding significant market share, while numerous smaller players compete for niche segments. Technological innovation, particularly in areas like aircraft efficiency and digital distribution, is a key driver. Stringent regulatory frameworks concerning safety, environmental regulations, and consumer protection significantly shape market operations. The rise of hybrid carriers blurring the lines between LCCs and full-service airlines presents a competitive threat. End-user demographics are shifting towards younger, price-sensitive travelers, while M&A activity remains a significant force, though the volume of deals in 2024 was xx Million, reflecting a post-pandemic consolidation trend.
- Market Concentration: Top 5 players hold approximately xx% market share in 2025.
- Technological Innovation: Focus on fuel-efficient aircraft and AI-driven operational efficiencies.
- Regulatory Landscape: Stringent safety and environmental regulations impact operational costs.
- Competitive Substitutes: Hybrid carriers and high-speed rail pose competitive challenges.
- End-User Demographics: Shifting towards younger, price-conscious travelers.
- M&A Activity: xx Million in deal value in 2024, indicating ongoing consolidation.
Low Cost Carrier Market Growth Trends & Insights
The LCC market experienced substantial growth during the historical period (2019-2024), recovering strongly from the pandemic downturn. The market size reached xx Million in 2024, exhibiting a CAGR of xx% during the historical period. This growth is fueled by factors such as increasing disposable incomes in emerging economies, a surge in travel demand, and the ongoing adoption of online booking platforms. Technological disruptions, particularly in the area of personalized travel experiences and dynamic pricing models, further drive growth. Consumer behavior is evolving towards greater price sensitivity coupled with expectations of enhanced convenience and personalized services. The forecast period (2025-2033) projects continued expansion, with a projected CAGR of xx%, driven by factors such as expanding route networks, an increasing focus on ancillary revenue streams, and the penetration of LCCs into previously underserved markets. Market penetration will reach xx% by 2033.
Dominant Regions, Countries, or Segments in Low Cost Carrier Market
The Asia-Pacific region emerged as the dominant market for LCCs in 2025, driven by rapid economic growth and the expanding middle class in countries like India and China. Within aircraft types, Narrow-body aircraft constitute the largest segment, reflecting their efficiency and suitability for high-volume, short-to-medium haul routes. Domestic travel significantly dominates over international travel, reflecting the higher frequency of shorter trips, while online distribution channels are increasingly preferred over traditional travel agencies.
- Dominant Region: Asia-Pacific, due to rapid economic growth and rising middle class.
- Leading Country: India, exhibiting significant growth potential.
- Dominant Aircraft Type: Narrow-body aircraft, owing to efficiency and cost-effectiveness.
- Predominant Destination: Domestic, reflecting the high volume of short-haul travel.
- Preferred Distribution Channel: Online booking, enhancing convenience and reducing costs.
- Key Drivers: Favorable economic policies, expanding infrastructure, and rising disposable incomes.
Low Cost Carrier Market Product Landscape
LCCs continuously innovate to enhance efficiency and customer experience. This includes optimizing route networks, adopting fuel-efficient aircraft, and leveraging technology for improved operational efficiency. Unique selling propositions often center on affordability, convenience, and ancillary revenue generation. Recent advancements include the incorporation of advanced data analytics for personalized offers and improved customer service.
Key Drivers, Barriers & Challenges in Low Cost Carrier Market
Key Drivers:
- Rising disposable incomes globally.
- Increasing demand for air travel, particularly in emerging markets.
- Technological advancements reducing operational costs.
- Growth of online travel agencies (OTAs) and mobile booking platforms.
Challenges & Restraints:
- Fuel price volatility significantly impacting profitability. A 10% increase in fuel prices can reduce profits by xx Million.
- Intense competition among LCCs and full-service carriers.
- Regulatory hurdles and airport infrastructure limitations impacting growth.
- Supply chain disruptions, impacting aircraft maintenance and spare parts availability.
Emerging Opportunities in Low Cost Carrier Market
- Expansion into underserved markets in Africa and Latin America.
- Leveraging technology for enhanced personalization and customer engagement.
- Growth of ancillary revenue streams through partnerships and bundled services.
- Focus on sustainable aviation fuels and environmentally conscious operations.
Growth Accelerators in the Low Cost Carrier Market Industry
Strategic partnerships with OTAs and technology providers enhance market reach and operational efficiency. Technological advancements, such as autonomous flight technologies (though still in early stages) and the adoption of sustainable aviation fuels, promise to drive long-term growth by lowering costs and enhancing environmental performance. Expansion into new markets and the development of new ancillary revenue streams will further fuel market growth.
Key Players Shaping the Low Cost Carrier Market Market
Notable Milestones in Low Cost Carrier Market Sector
- 2022 Q3: Ryanair announced a significant expansion of its route network in Europe.
- 2023 Q1: Several LCCs announced partnerships with sustainable aviation fuel providers.
- 2024 Q2: A major merger between two regional LCCs was completed.
In-Depth Low Cost Carrier Market Market Outlook
The LCC market is poised for continued robust growth throughout the forecast period, driven by several key factors, including the expansion of affordable travel options to new markets, innovative pricing models, and continuous improvements in operational efficiency. Strategic opportunities abound for LCCs that focus on sustainability, technology integration, and expansion into untapped markets. This positive outlook suggests a bright future for the LCC industry.
Low Cost Carrier Market Segmentation
-
1. Aircraft Type
- 1.1. Narrow Body
- 1.2. Wide Body Aircraft
-
2. Destination
- 2.1. Domestic
- 2.2. International
-
3. Distribution Channel
- 3.1. Online
- 3.2. Travel Agency
Low Cost Carrier Market Segmentation By Geography
-
1. North America
- 1.1. United States
- 1.2. Canada
-
2. Europe
- 2.1. Germany
- 2.2. United Kingdom
- 2.3. France
- 2.4. Russia
- 2.5. Rest of Europe
-
3. Asia Pacific
- 3.1. China
- 3.2. Japan
- 3.3. India
- 3.4. South Korea
- 3.5. Rest of Asia Pacific
-
4. Latin America
- 4.1. Brazil
- 4.2. Rest of Latin America
-
5. Middle East and Africa
- 5.1. Saudi Arabia
- 5.2. United Arab Emirates
- 5.3. Rest of Middle East and Africa
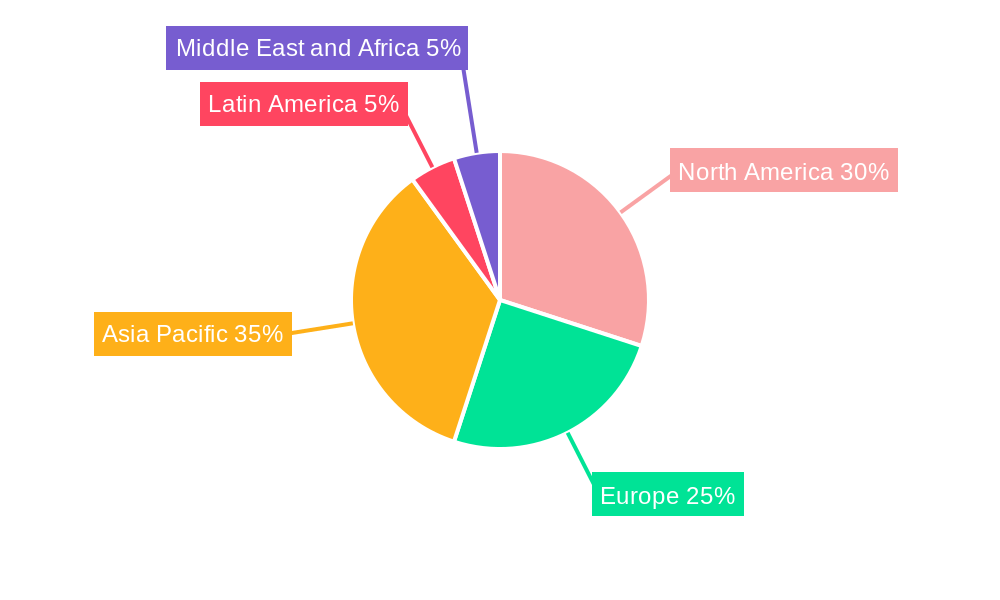
Low Cost Carrier Market Regional Market Share
Geographic Coverage of Low Cost Carrier Market
Low Cost Carrier Market REPORT HIGHLIGHTS
| Aspects | Details |
|---|---|
| Study Period | 2020-2034 |
| Base Year | 2025 |
| Estimated Year | 2026 |
| Forecast Period | 2026-2034 |
| Historical Period | 2020-2025 |
| Growth Rate | CAGR of 5.7% from 2020-2034 |
| Segmentation |
|
Table of Contents
- 1. Introduction
- 1.1. Research Scope
- 1.2. Market Segmentation
- 1.3. Research Objective
- 1.4. Definitions and Assumptions
- 2. Executive Summary
- 2.1. Market Snapshot
- 3. Market Dynamics
- 3.1. Market Drivers
- 3.2. Market Restrains
- 3.3. Market Trends
- 3.4. Market Opportunities
- 4. Market Factor Analysis
- 4.1. Porters Five Forces
- 4.1.1. Bargaining Power of Suppliers
- 4.1.2. Bargaining Power of Buyers
- 4.1.3. Threat of New Entrants
- 4.1.4. Threat of Substitutes
- 4.1.5. Competitive Rivalry
- 4.2. PESTEL analysis
- 4.3. BCG Analysis
- 4.3.1. Stars (High Growth, High Market Share)
- 4.3.2. Cash Cows (Low Growth, High Market Share)
- 4.3.3. Question Mark (High Growth, Low Market Share)
- 4.3.4. Dogs (Low Growth, Low Market Share)
- 4.4. Ansoff Matrix Analysis
- 4.5. Supply Chain Analysis
- 4.6. Regulatory Landscape
- 4.7. Current Market Potential and Opportunity Assessment (TAM–SAM–SOM Framework)
- 4.8. IMR Analyst Note
- 4.1. Porters Five Forces
- 5. Market Analysis, Insights and Forecast 2021-2033
- 5.1. Market Analysis, Insights and Forecast - by Aircraft Type
- 5.1.1. Narrow Body
- 5.1.2. Wide Body Aircraft
- 5.2. Market Analysis, Insights and Forecast - by Destination
- 5.2.1. Domestic
- 5.2.2. International
- 5.3. Market Analysis, Insights and Forecast - by Distribution Channel
- 5.3.1. Online
- 5.3.2. Travel Agency
- 5.4. Market Analysis, Insights and Forecast - by Region
- 5.4.1. North America
- 5.4.2. Europe
- 5.4.3. Asia Pacific
- 5.4.4. Latin America
- 5.4.5. Middle East and Africa
- 5.1. Market Analysis, Insights and Forecast - by Aircraft Type
- 6. Global Low Cost Carrier Market Analysis, Insights and Forecast, 2021-2033
- 6.1. Market Analysis, Insights and Forecast - by Aircraft Type
- 6.1.1. Narrow Body
- 6.1.2. Wide Body Aircraft
- 6.2. Market Analysis, Insights and Forecast - by Destination
- 6.2.1. Domestic
- 6.2.2. International
- 6.3. Market Analysis, Insights and Forecast - by Distribution Channel
- 6.3.1. Online
- 6.3.2. Travel Agency
- 6.1. Market Analysis, Insights and Forecast - by Aircraft Type
- 7. North America Low Cost Carrier Market Analysis, Insights and Forecast, 2020-2032
- 7.1. Market Analysis, Insights and Forecast - by Aircraft Type
- 7.1.1. Narrow Body
- 7.1.2. Wide Body Aircraft
- 7.2. Market Analysis, Insights and Forecast - by Destination
- 7.2.1. Domestic
- 7.2.2. International
- 7.3. Market Analysis, Insights and Forecast - by Distribution Channel
- 7.3.1. Online
- 7.3.2. Travel Agency
- 7.1. Market Analysis, Insights and Forecast - by Aircraft Type
- 8. Europe Low Cost Carrier Market Analysis, Insights and Forecast, 2020-2032
- 8.1. Market Analysis, Insights and Forecast - by Aircraft Type
- 8.1.1. Narrow Body
- 8.1.2. Wide Body Aircraft
- 8.2. Market Analysis, Insights and Forecast - by Destination
- 8.2.1. Domestic
- 8.2.2. International
- 8.3. Market Analysis, Insights and Forecast - by Distribution Channel
- 8.3.1. Online
- 8.3.2. Travel Agency
- 8.1. Market Analysis, Insights and Forecast - by Aircraft Type
- 9. Asia Pacific Low Cost Carrier Market Analysis, Insights and Forecast, 2020-2032
- 9.1. Market Analysis, Insights and Forecast - by Aircraft Type
- 9.1.1. Narrow Body
- 9.1.2. Wide Body Aircraft
- 9.2. Market Analysis, Insights and Forecast - by Destination
- 9.2.1. Domestic
- 9.2.2. International
- 9.3. Market Analysis, Insights and Forecast - by Distribution Channel
- 9.3.1. Online
- 9.3.2. Travel Agency
- 9.1. Market Analysis, Insights and Forecast - by Aircraft Type
- 10. Latin America Low Cost Carrier Market Analysis, Insights and Forecast, 2020-2032
- 10.1. Market Analysis, Insights and Forecast - by Aircraft Type
- 10.1.1. Narrow Body
- 10.1.2. Wide Body Aircraft
- 10.2. Market Analysis, Insights and Forecast - by Destination
- 10.2.1. Domestic
- 10.2.2. International
- 10.3. Market Analysis, Insights and Forecast - by Distribution Channel
- 10.3.1. Online
- 10.3.2. Travel Agency
- 10.1. Market Analysis, Insights and Forecast - by Aircraft Type
- 11. Middle East and Africa Low Cost Carrier Market Analysis, Insights and Forecast, 2020-2032
- 11.1. Market Analysis, Insights and Forecast - by Aircraft Type
- 11.1.1. Narrow Body
- 11.1.2. Wide Body Aircraft
- 11.2. Market Analysis, Insights and Forecast - by Destination
- 11.2.1. Domestic
- 11.2.2. International
- 11.3. Market Analysis, Insights and Forecast - by Distribution Channel
- 11.3.1. Online
- 11.3.2. Travel Agency
- 11.1. Market Analysis, Insights and Forecast - by Aircraft Type
- 12. Competitive Analysis
- 12.1. Company Profiles
- 12.1.1 Azul S A
- 12.1.1.1. Company Overview
- 12.1.1.2. Products
- 12.1.1.3. Company Financials
- 12.1.1.4. SWOT Analysis
- 12.1.2 Westjet Airlines Lt
- 12.1.2.1. Company Overview
- 12.1.2.2. Products
- 12.1.2.3. Company Financials
- 12.1.2.4. SWOT Analysis
- 12.1.3 Air Arabia PJSC
- 12.1.3.1. Company Overview
- 12.1.3.2. Products
- 12.1.3.3. Company Financials
- 12.1.3.4. SWOT Analysis
- 12.1.4 Easy Jet Plc
- 12.1.4.1. Company Overview
- 12.1.4.2. Products
- 12.1.4.3. Company Financials
- 12.1.4.4. SWOT Analysis
- 12.1.5 Norweigan Air Shuttle
- 12.1.5.1. Company Overview
- 12.1.5.2. Products
- 12.1.5.3. Company Financials
- 12.1.5.4. SWOT Analysis
- 12.1.6 Ryan Air
- 12.1.6.1. Company Overview
- 12.1.6.2. Products
- 12.1.6.3. Company Financials
- 12.1.6.4. SWOT Analysis
- 12.1.7 Southwest Airlines Co
- 12.1.7.1. Company Overview
- 12.1.7.2. Products
- 12.1.7.3. Company Financials
- 12.1.7.4. SWOT Analysis
- 12.1.8 Spirit Airlines
- 12.1.8.1. Company Overview
- 12.1.8.2. Products
- 12.1.8.3. Company Financials
- 12.1.8.4. SWOT Analysis
- 12.1.9 Spicejet Ltd
- 12.1.9.1. Company Overview
- 12.1.9.2. Products
- 12.1.9.3. Company Financials
- 12.1.9.4. SWOT Analysis
- 12.1.10 JetBlue Airways Corporation
- 12.1.10.1. Company Overview
- 12.1.10.2. Products
- 12.1.10.3. Company Financials
- 12.1.10.4. SWOT Analysis
- 12.1.11 Indigo
- 12.1.11.1. Company Overview
- 12.1.11.2. Products
- 12.1.11.3. Company Financials
- 12.1.11.4. SWOT Analysis
- 12.1.12 AirAsia Group Berhad
- 12.1.12.1. Company Overview
- 12.1.12.2. Products
- 12.1.12.3. Company Financials
- 12.1.12.4. SWOT Analysis
- 12.1.13 Alaska Air Group Inc
- 12.1.13.1. Company Overview
- 12.1.13.2. Products
- 12.1.13.3. Company Financials
- 12.1.13.4. SWOT Analysis
- 12.1.1 Azul S A
- 12.2. Market Entropy
- 12.2.1 Company's Key Areas Served
- 12.2.2 Recent Developments
- 12.3. Company Market Share Analysis 2025
- 12.3.1 Top 5 Companies Market Share Analysis
- 12.3.2 Top 3 Companies Market Share Analysis
- 12.4. List of Potential Customers
- 13. Research Methodology
List of Figures
- Figure 1: Global Low Cost Carrier Market Revenue Breakdown (billion, %) by Region 2025 & 2033
- Figure 2: North America Low Cost Carrier Market Revenue (billion), by Aircraft Type 2025 & 2033
- Figure 3: North America Low Cost Carrier Market Revenue Share (%), by Aircraft Type 2025 & 2033
- Figure 4: North America Low Cost Carrier Market Revenue (billion), by Destination 2025 & 2033
- Figure 5: North America Low Cost Carrier Market Revenue Share (%), by Destination 2025 & 2033
- Figure 6: North America Low Cost Carrier Market Revenue (billion), by Distribution Channel 2025 & 2033
- Figure 7: North America Low Cost Carrier Market Revenue Share (%), by Distribution Channel 2025 & 2033
- Figure 8: North America Low Cost Carrier Market Revenue (billion), by Country 2025 & 2033
- Figure 9: North America Low Cost Carrier Market Revenue Share (%), by Country 2025 & 2033
- Figure 10: Europe Low Cost Carrier Market Revenue (billion), by Aircraft Type 2025 & 2033
- Figure 11: Europe Low Cost Carrier Market Revenue Share (%), by Aircraft Type 2025 & 2033
- Figure 12: Europe Low Cost Carrier Market Revenue (billion), by Destination 2025 & 2033
- Figure 13: Europe Low Cost Carrier Market Revenue Share (%), by Destination 2025 & 2033
- Figure 14: Europe Low Cost Carrier Market Revenue (billion), by Distribution Channel 2025 & 2033
- Figure 15: Europe Low Cost Carrier Market Revenue Share (%), by Distribution Channel 2025 & 2033
- Figure 16: Europe Low Cost Carrier Market Revenue (billion), by Country 2025 & 2033
- Figure 17: Europe Low Cost Carrier Market Revenue Share (%), by Country 2025 & 2033
- Figure 18: Asia Pacific Low Cost Carrier Market Revenue (billion), by Aircraft Type 2025 & 2033
- Figure 19: Asia Pacific Low Cost Carrier Market Revenue Share (%), by Aircraft Type 2025 & 2033
- Figure 20: Asia Pacific Low Cost Carrier Market Revenue (billion), by Destination 2025 & 2033
- Figure 21: Asia Pacific Low Cost Carrier Market Revenue Share (%), by Destination 2025 & 2033
- Figure 22: Asia Pacific Low Cost Carrier Market Revenue (billion), by Distribution Channel 2025 & 2033
- Figure 23: Asia Pacific Low Cost Carrier Market Revenue Share (%), by Distribution Channel 2025 & 2033
- Figure 24: Asia Pacific Low Cost Carrier Market Revenue (billion), by Country 2025 & 2033
- Figure 25: Asia Pacific Low Cost Carrier Market Revenue Share (%), by Country 2025 & 2033
- Figure 26: Latin America Low Cost Carrier Market Revenue (billion), by Aircraft Type 2025 & 2033
- Figure 27: Latin America Low Cost Carrier Market Revenue Share (%), by Aircraft Type 2025 & 2033
- Figure 28: Latin America Low Cost Carrier Market Revenue (billion), by Destination 2025 & 2033
- Figure 29: Latin America Low Cost Carrier Market Revenue Share (%), by Destination 2025 & 2033
- Figure 30: Latin America Low Cost Carrier Market Revenue (billion), by Distribution Channel 2025 & 2033
- Figure 31: Latin America Low Cost Carrier Market Revenue Share (%), by Distribution Channel 2025 & 2033
- Figure 32: Latin America Low Cost Carrier Market Revenue (billion), by Country 2025 & 2033
- Figure 33: Latin America Low Cost Carrier Market Revenue Share (%), by Country 2025 & 2033
- Figure 34: Middle East and Africa Low Cost Carrier Market Revenue (billion), by Aircraft Type 2025 & 2033
- Figure 35: Middle East and Africa Low Cost Carrier Market Revenue Share (%), by Aircraft Type 2025 & 2033
- Figure 36: Middle East and Africa Low Cost Carrier Market Revenue (billion), by Destination 2025 & 2033
- Figure 37: Middle East and Africa Low Cost Carrier Market Revenue Share (%), by Destination 2025 & 2033
- Figure 38: Middle East and Africa Low Cost Carrier Market Revenue (billion), by Distribution Channel 2025 & 2033
- Figure 39: Middle East and Africa Low Cost Carrier Market Revenue Share (%), by Distribution Channel 2025 & 2033
- Figure 40: Middle East and Africa Low Cost Carrier Market Revenue (billion), by Country 2025 & 2033
- Figure 41: Middle East and Africa Low Cost Carrier Market Revenue Share (%), by Country 2025 & 2033
List of Tables
- Table 1: Global Low Cost Carrier Market Revenue billion Forecast, by Aircraft Type 2020 & 2033
- Table 2: Global Low Cost Carrier Market Revenue billion Forecast, by Destination 2020 & 2033
- Table 3: Global Low Cost Carrier Market Revenue billion Forecast, by Distribution Channel 2020 & 2033
- Table 4: Global Low Cost Carrier Market Revenue billion Forecast, by Region 2020 & 2033
- Table 5: Global Low Cost Carrier Market Revenue billion Forecast, by Aircraft Type 2020 & 2033
- Table 6: Global Low Cost Carrier Market Revenue billion Forecast, by Destination 2020 & 2033
- Table 7: Global Low Cost Carrier Market Revenue billion Forecast, by Distribution Channel 2020 & 2033
- Table 8: Global Low Cost Carrier Market Revenue billion Forecast, by Country 2020 & 2033
- Table 9: United States Low Cost Carrier Market Revenue (billion) Forecast, by Application 2020 & 2033
- Table 10: Canada Low Cost Carrier Market Revenue (billion) Forecast, by Application 2020 & 2033
- Table 11: Global Low Cost Carrier Market Revenue billion Forecast, by Aircraft Type 2020 & 2033
- Table 12: Global Low Cost Carrier Market Revenue billion Forecast, by Destination 2020 & 2033
- Table 13: Global Low Cost Carrier Market Revenue billion Forecast, by Distribution Channel 2020 & 2033
- Table 14: Global Low Cost Carrier Market Revenue billion Forecast, by Country 2020 & 2033
- Table 15: Germany Low Cost Carrier Market Revenue (billion) Forecast, by Application 2020 & 2033
- Table 16: United Kingdom Low Cost Carrier Market Revenue (billion) Forecast, by Application 2020 & 2033
- Table 17: France Low Cost Carrier Market Revenue (billion) Forecast, by Application 2020 & 2033
- Table 18: Russia Low Cost Carrier Market Revenue (billion) Forecast, by Application 2020 & 2033
- Table 19: Rest of Europe Low Cost Carrier Market Revenue (billion) Forecast, by Application 2020 & 2033
- Table 20: Global Low Cost Carrier Market Revenue billion Forecast, by Aircraft Type 2020 & 2033
- Table 21: Global Low Cost Carrier Market Revenue billion Forecast, by Destination 2020 & 2033
- Table 22: Global Low Cost Carrier Market Revenue billion Forecast, by Distribution Channel 2020 & 2033
- Table 23: Global Low Cost Carrier Market Revenue billion Forecast, by Country 2020 & 2033
- Table 24: China Low Cost Carrier Market Revenue (billion) Forecast, by Application 2020 & 2033
- Table 25: Japan Low Cost Carrier Market Revenue (billion) Forecast, by Application 2020 & 2033
- Table 26: India Low Cost Carrier Market Revenue (billion) Forecast, by Application 2020 & 2033
- Table 27: South Korea Low Cost Carrier Market Revenue (billion) Forecast, by Application 2020 & 2033
- Table 28: Rest of Asia Pacific Low Cost Carrier Market Revenue (billion) Forecast, by Application 2020 & 2033
- Table 29: Global Low Cost Carrier Market Revenue billion Forecast, by Aircraft Type 2020 & 2033
- Table 30: Global Low Cost Carrier Market Revenue billion Forecast, by Destination 2020 & 2033
- Table 31: Global Low Cost Carrier Market Revenue billion Forecast, by Distribution Channel 2020 & 2033
- Table 32: Global Low Cost Carrier Market Revenue billion Forecast, by Country 2020 & 2033
- Table 33: Brazil Low Cost Carrier Market Revenue (billion) Forecast, by Application 2020 & 2033
- Table 34: Rest of Latin America Low Cost Carrier Market Revenue (billion) Forecast, by Application 2020 & 2033
- Table 35: Global Low Cost Carrier Market Revenue billion Forecast, by Aircraft Type 2020 & 2033
- Table 36: Global Low Cost Carrier Market Revenue billion Forecast, by Destination 2020 & 2033
- Table 37: Global Low Cost Carrier Market Revenue billion Forecast, by Distribution Channel 2020 & 2033
- Table 38: Global Low Cost Carrier Market Revenue billion Forecast, by Country 2020 & 2033
- Table 39: Saudi Arabia Low Cost Carrier Market Revenue (billion) Forecast, by Application 2020 & 2033
- Table 40: United Arab Emirates Low Cost Carrier Market Revenue (billion) Forecast, by Application 2020 & 2033
- Table 41: Rest of Middle East and Africa Low Cost Carrier Market Revenue (billion) Forecast, by Application 2020 & 2033
Frequently Asked Questions
1. What is the projected Compound Annual Growth Rate (CAGR) of the Low Cost Carrier Market?
The projected CAGR is approximately 5.7%.
2. Which companies are prominent players in the Low Cost Carrier Market?
Key companies in the market include Azul S A, Westjet Airlines Lt, Air Arabia PJSC, Easy Jet Plc, Norweigan Air Shuttle, Ryan Air, Southwest Airlines Co, Spirit Airlines, Spicejet Ltd, JetBlue Airways Corporation, Indigo, AirAsia Group Berhad, Alaska Air Group Inc.
3. What are the main segments of the Low Cost Carrier Market?
The market segments include Aircraft Type, Destination, Distribution Channel.
4. Can you provide details about the market size?
The market size is estimated to be USD 332.4 billion as of 2022.
5. What are some drivers contributing to market growth?
N/A
6. What are the notable trends driving market growth?
By Market Segmentation. Narrowbody Aircraft Type is Expected to Witness Significant Growth During the Forecast Period.
7. Are there any restraints impacting market growth?
N/A
8. Can you provide examples of recent developments in the market?
N/A
9. What pricing options are available for accessing the report?
Pricing options include single-user, multi-user, and enterprise licenses priced at USD 4750, USD 5250, and USD 8750 respectively.
10. Is the market size provided in terms of value or volume?
The market size is provided in terms of value, measured in billion.
11. Are there any specific market keywords associated with the report?
Yes, the market keyword associated with the report is "Low Cost Carrier Market," which aids in identifying and referencing the specific market segment covered.
12. How do I determine which pricing option suits my needs best?
The pricing options vary based on user requirements and access needs. Individual users may opt for single-user licenses, while businesses requiring broader access may choose multi-user or enterprise licenses for cost-effective access to the report.
13. Are there any additional resources or data provided in the Low Cost Carrier Market report?
While the report offers comprehensive insights, it's advisable to review the specific contents or supplementary materials provided to ascertain if additional resources or data are available.
14. How can I stay updated on further developments or reports in the Low Cost Carrier Market?
To stay informed about further developments, trends, and reports in the Low Cost Carrier Market, consider subscribing to industry newsletters, following relevant companies and organizations, or regularly checking reputable industry news sources and publications.
Methodology
Step 1 - Identification of Relevant Samples Size from Population Database


Step 2 - Approaches for Defining Global Market Size (Value, Volume* & Price*)

Note*: In applicable scenarios
Step 3 - Data Sources
Primary Research
- Web Analytics
- Survey Reports
- Research Institute
- Latest Research Reports
- Opinion Leaders
Secondary Research
- Annual Reports
- White Paper
- Latest Press Release
- Industry Association
- Paid Database
- Investor Presentations

Step 4 - Data Triangulation
Involves using different sources of information in order to increase the validity of a study
These sources are likely to be stakeholders in a program - participants, other researchers, program staff, other community members, and so on.
Then we put all data in single framework & apply various statistical tools to find out the dynamic on the market.
During the analysis stage, feedback from the stakeholder groups would be compared to determine areas of agreement as well as areas of divergence