

Key Insights
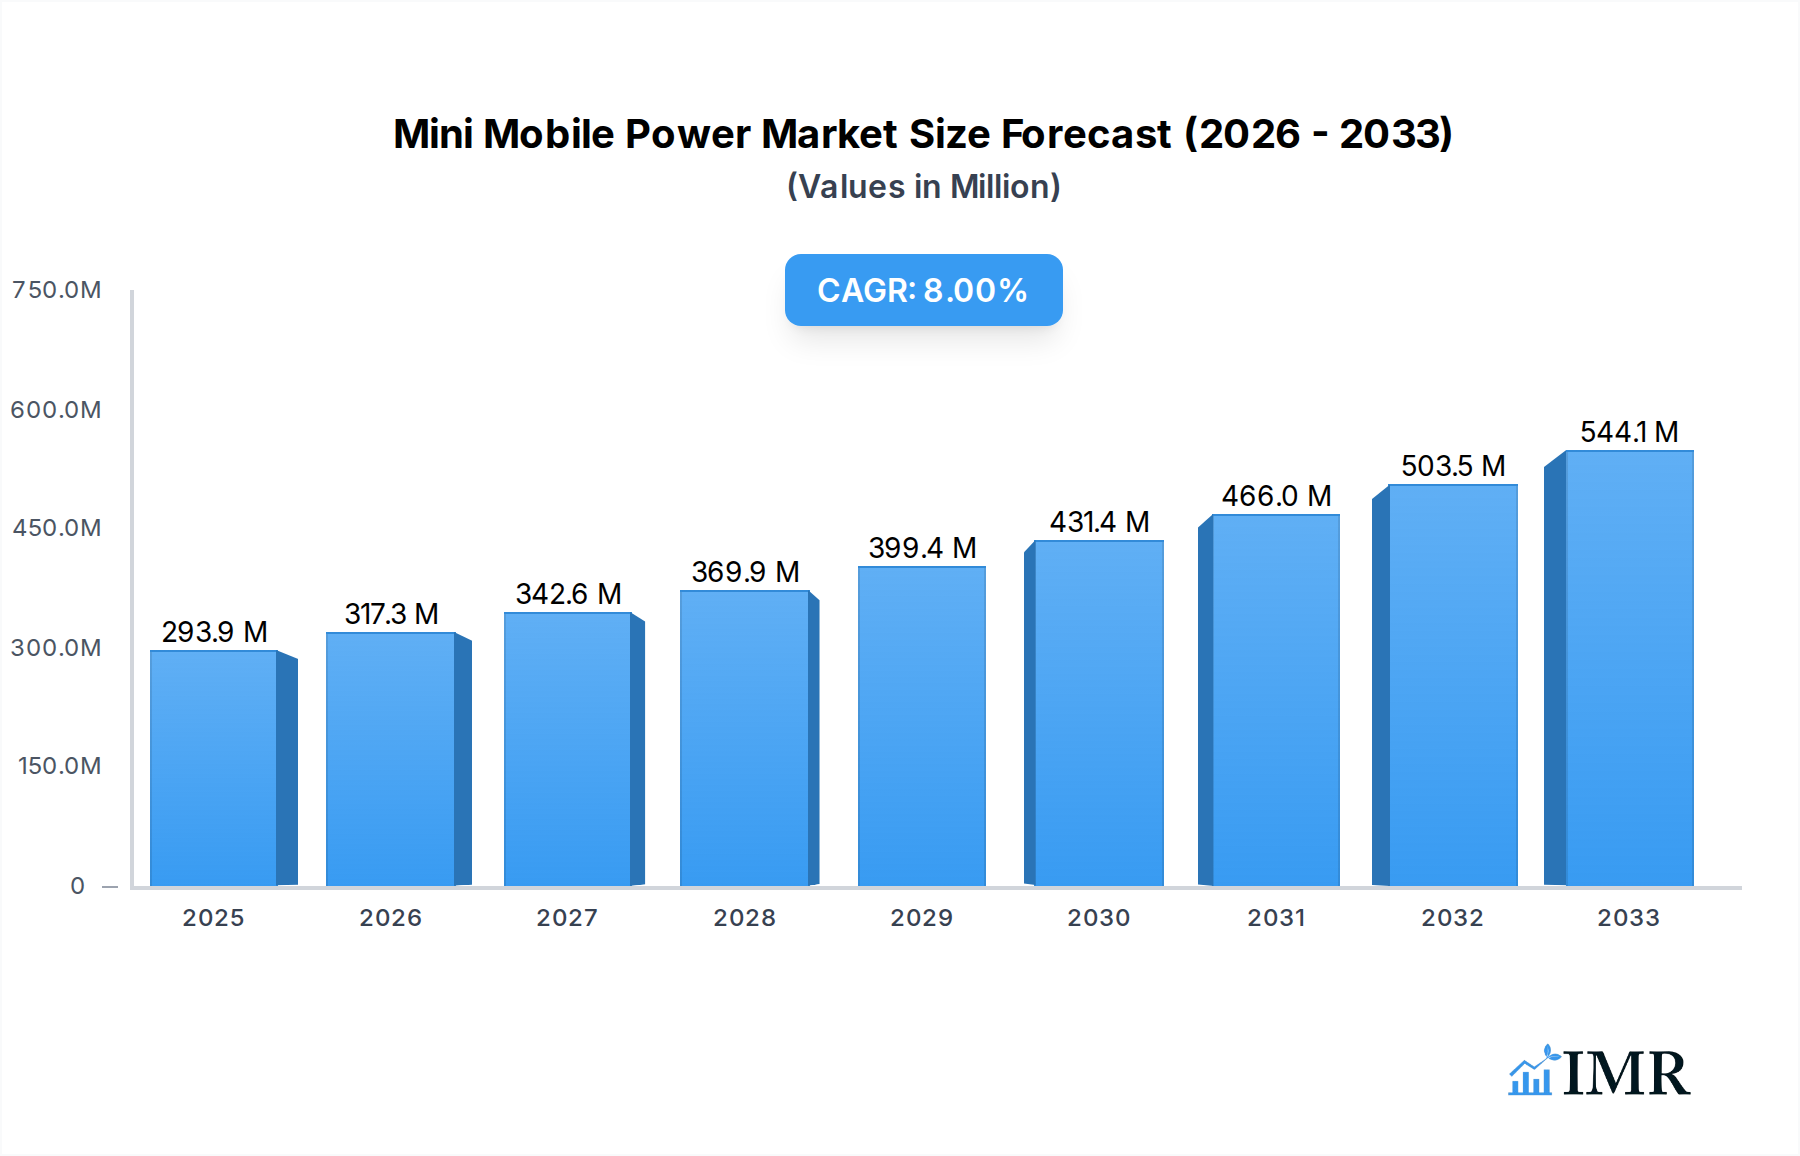
The global Mini Mobile Power market is poised for substantial growth, projected to reach USD 293.94 million in 2025, exhibiting a robust Compound Annual Growth Rate (CAGR) of 8.04% during the forecast period of 2025-2033. This expansion is primarily fueled by the ever-increasing demand for portable and reliable power solutions for an array of mobile devices, including smartphones, tablets, and wearables. The pervasive adoption of these devices across both consumer and enterprise sectors, coupled with the growing trend of remote work and on-the-go lifestyles, significantly bolsters the market's upward trajectory. Furthermore, continuous innovation in battery technology, leading to more compact, lightweight, and higher-capacity power banks, is a key driver, making these accessories indispensable for modern consumers. The market's segmentation into online and offline sales channels caters to diverse consumer preferences, with online platforms offering convenience and a wider selection, while offline retail provides immediate access and tactile product evaluation.

Mini Mobile Power Market Size (In Million)
The Mini Mobile Power market is experiencing dynamic shifts driven by evolving consumer needs and technological advancements. While the convenience and portability of power banks are universally appreciated, the market faces certain challenges. The increasing integration of larger battery capacities within mobile devices themselves and the rapid development of wireless charging technologies, while offering alternative charging solutions, can present moderate headwinds. However, these are largely offset by the ongoing need for supplementary power, especially for power-intensive applications and in regions with less developed charging infrastructure. The market's segmentation by capacity—Below 10000 mAh, 10001-20000 mAh, and Above 20000 mAh—reflects a spectrum of user requirements, from basic smartphone top-ups to powering multiple devices or high-drain gadgets. Key players such as Anker Innovations, Xiaomi, and Samsung are at the forefront, investing in research and development to introduce products with enhanced features like fast charging, multiple ports, and advanced safety mechanisms, thereby shaping the competitive landscape and driving market value.
Mini Mobile Power Company Market Share
Mini Mobile Power Market Report: Comprehensive Analysis and Future Outlook (2019-2033)
This in-depth report provides a comprehensive analysis of the global mini mobile power market, offering critical insights into market dynamics, growth trends, regional dominance, product innovation, and key players. Designed for industry professionals, investors, and stakeholders, this report leverages high-traffic keywords such as "portable power solutions," "mobile battery chargers," "power bank market," and "compact energy storage" to maximize SEO visibility. The analysis encompasses both the parent market for portable electronics accessories and the child market for specialized mini mobile power devices, providing a holistic view of market evolution.
Key Timelines:
- Study Period: 2019–2033
- Base Year: 2025
- Estimated Year: 2025
- Forecast Period: 2025–2033
- Historical Period: 2019–2024
Mini Mobile Power Market Dynamics & Structure
The mini mobile power market exhibits a moderately concentrated structure, with a few major players like Anker Innovations, Xiaomi, and Samsung holding significant market shares. However, a robust ecosystem of smaller and niche manufacturers contributes to competitive dynamism. Technological innovation serves as a primary driver, with continuous advancements in battery technology, charging speeds (e.g., GaN technology, USB-C Power Delivery), and product miniaturization. Regulatory frameworks, particularly those related to battery safety standards and environmental compliance (e.g., RoHS, CE certifications), also shape market entry and product development. Competitive product substitutes include integrated battery solutions within devices and higher-capacity, albeit larger, power banks. End-user demographics span a wide spectrum, from tech-savvy millennials and Gen Z seeking on-the-go charging to business professionals requiring reliable power for their devices and travelers prioritizing portability. Mergers and acquisitions (M&A) trends are observed, albeit at a moderate pace, as larger companies strategically acquire innovative startups to expand their product portfolios and technological capabilities. For instance, a predicted XX M&A deals are anticipated within the forecast period, aiming to consolidate market positions or acquire intellectual property.
- Market Concentration: Moderate to High in specific sub-segments.
- Technological Innovation Drivers: Faster charging, increased energy density, smart charging features, and compact design.
- Regulatory Frameworks: Battery safety, environmental compliance, and electronic waste management.
- Competitive Product Substitutes: Built-in device batteries, larger capacity power banks, wireless charging solutions.
- End-User Demographics: Students, travelers, business professionals, outdoor enthusiasts, and digital nomads.
- M&A Trends: Strategic acquisitions for technology and market expansion.
Mini Mobile Power Growth Trends & Insights
The global mini mobile power market is poised for robust expansion, driven by the relentless proliferation of mobile devices and the increasing demand for uninterrupted connectivity. The market size is projected to witness significant growth, evolving from an estimated $12,500 million in the base year 2025 to a projected $25,000 million by the end of the forecast period in 2033, exhibiting a Compound Annual Growth Rate (CAGR) of approximately XX%. Adoption rates for mini mobile power solutions are steadily increasing, particularly among younger demographics who rely heavily on their smartphones, tablets, and wearables for daily activities. Technological disruptions, such as the widespread adoption of USB-C Power Delivery and the integration of AI for optimized charging, are enhancing user experience and driving further market penetration. Consumer behavior shifts are characterized by a growing preference for ultra-portable and feature-rich charging solutions that seamlessly integrate into their busy lifestyles. The convenience of compact power banks, capable of providing multiple device charges, has become a crucial factor for consumers on the go. Furthermore, the expanding use of portable gaming devices, smartwatches, and other personal electronic gadgets further fuels the demand for these essential accessories. The increasing emphasis on sustainable and eco-friendly charging solutions is also becoming a significant trend, prompting manufacturers to develop products with improved energy efficiency and materials. The market penetration of mini mobile power solutions is expected to reach XX% of all portable electronic device users by 2033. This growth is underpinned by continuous innovation in battery capacity, charging speed, and form factor, making these devices indispensable for modern digital life. The increasing disposable income in emerging economies also plays a crucial role in expanding the consumer base for these portable power products.
Dominant Regions, Countries, or Segments in Mini Mobile Power
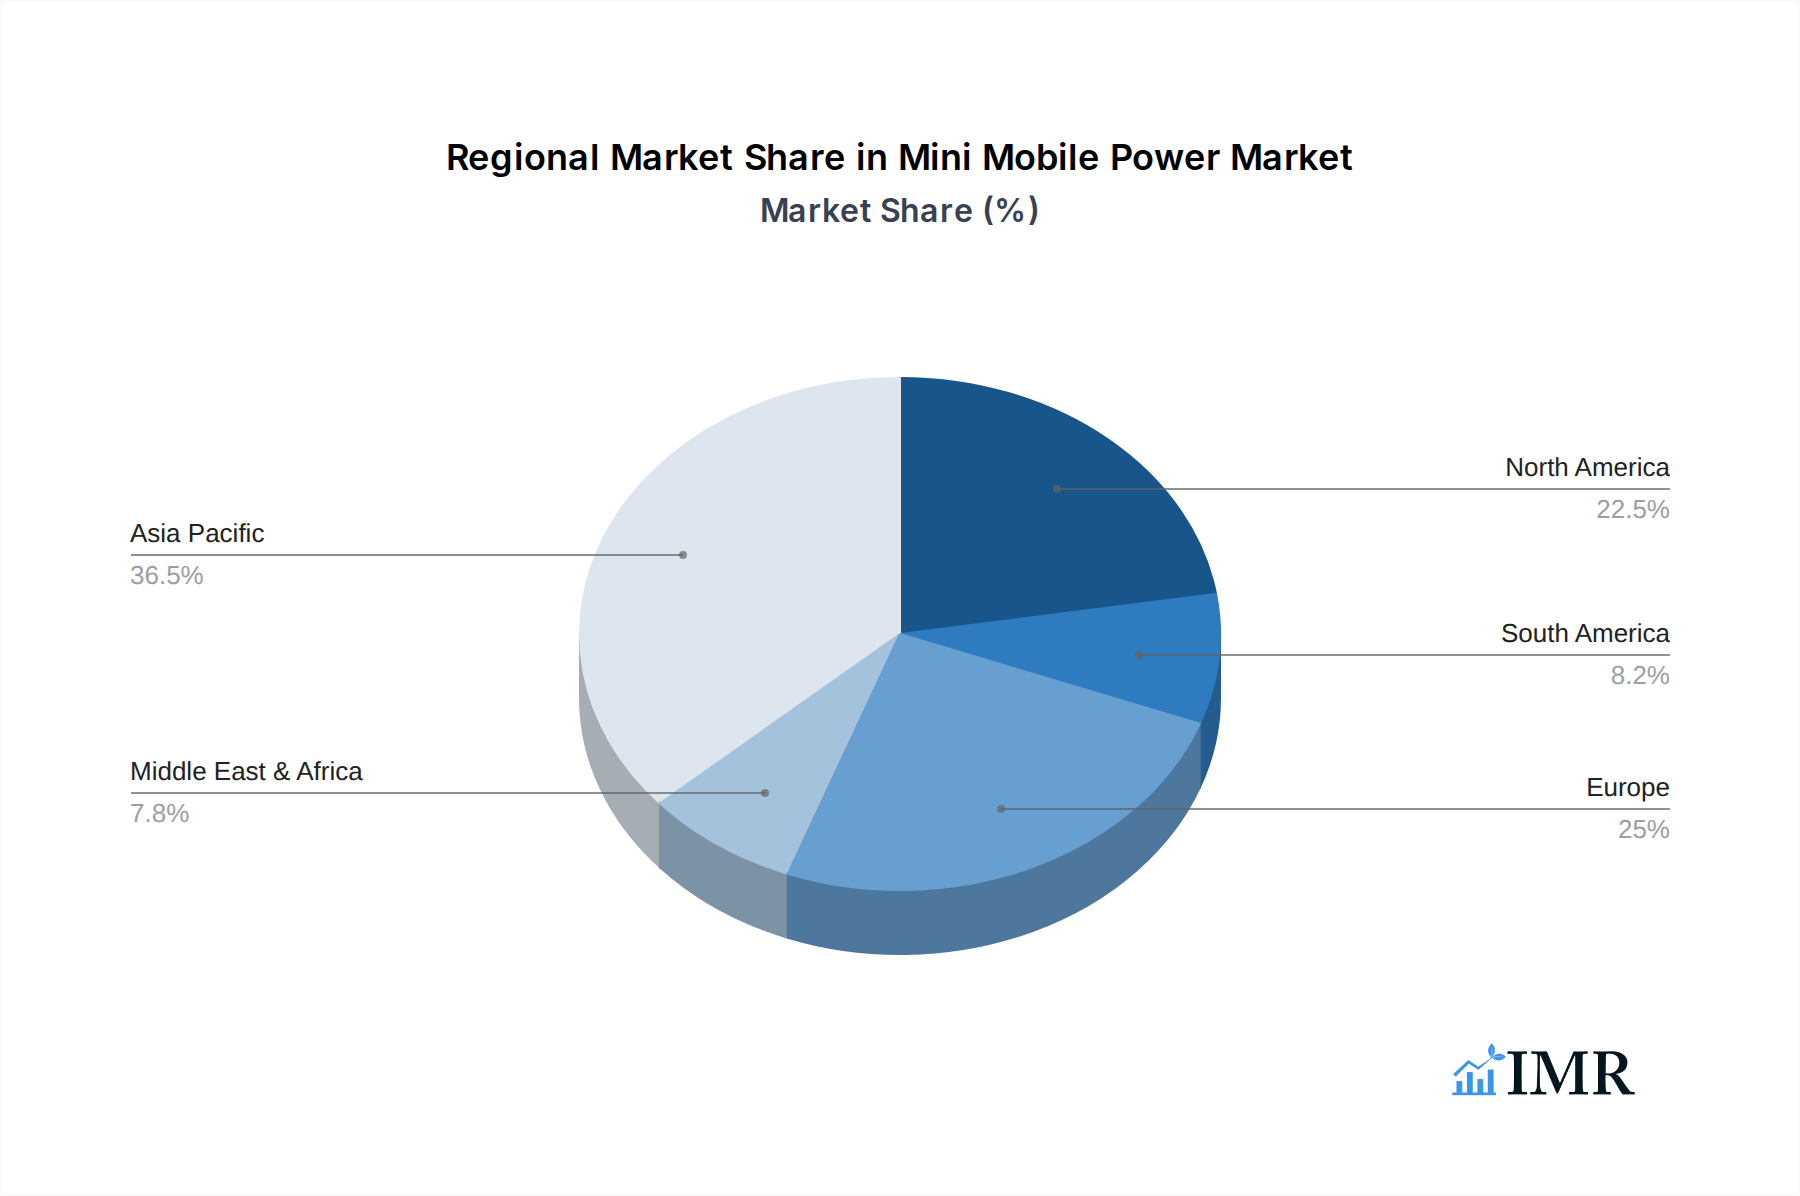
The Asia-Pacific region is currently the dominant force in the mini mobile power market, driven by its massive consumer base, rapid urbanization, and the widespread adoption of smartphones and other portable electronic devices. Countries like China and India, with their burgeoning middle-class populations and significant manufacturing capabilities, are key contributors to this regional dominance. The application segment of Online sales channels is experiencing unparalleled growth, largely due to the e-commerce boom in these regions, offering wider accessibility and competitive pricing. Within the product type segments, Below 10000 mAh power banks are witnessing the highest demand due to their ultra-portability and suitability for topping up essential devices like smartphones and wireless earbuds. However, the 10001-20000 mAh segment is rapidly gaining traction as consumers seek a balance between portability and sufficient charging capacity for multiple devices or longer usage periods.
- Dominant Region: Asia-Pacific
- Key Drivers: Large and growing population, high smartphone penetration, robust e-commerce infrastructure, competitive manufacturing landscape.
- Market Share: Estimated XX% of the global market.
- Growth Potential: Continued expansion driven by increasing disposable incomes and demand for smart devices.
- Dominant Application Segment: Online
- Key Drivers: Convenience, wider product selection, competitive pricing, efficient logistics networks, digital marketing reach.
- Market Share: Expected to account for XX% of total sales by 2033.
- Growth Potential: Sustained growth fueled by the ongoing digital transformation and consumer preference for online shopping.
- Dominant Product Type Segment: Below 10000 mAh
- Key Drivers: Portability, affordability, suitability for smartphones and wearables, integration into daily carry.
- Market Share: Currently leading, with XX% of unit sales.
- Growth Potential: Stable growth, especially with the continued popularity of compact personal devices.
Mini Mobile Power Product Landscape
The mini mobile power landscape is characterized by continuous innovation focused on enhanced portability, faster charging capabilities, and smart features. Manufacturers are integrating advanced technologies like Gallium Nitride (GaN) for more efficient and smaller chargers, alongside USB-C Power Delivery (PD) and Qualcomm Quick Charge for rapid charging of compatible devices. Product designs emphasize sleek aesthetics, lightweight construction, and durable materials. Applications extend beyond basic smartphone charging to include powering smartwatches, wireless earbuds, portable gaming consoles, and even small laptops. Unique selling propositions often revolve around ultra-compact form factors, high-capacity-to-size ratios, and multi-port outputs for simultaneous charging. Technological advancements are also seen in the integration of smart charging algorithms that optimize power delivery to prolong device battery health.
Key Drivers, Barriers & Challenges in Mini Mobile Power
The mini mobile power market is propelled by several key drivers. The ever-increasing number of portable electronic devices, the growing demand for uninterrupted connectivity, and the desire for convenience and portability are primary forces. Technological advancements in battery technology leading to smaller, lighter, and more powerful units also act as significant accelerators. The expanding travel and tourism industry further fuels demand for portable charging solutions.
Conversely, the market faces certain barriers and challenges. Intense price competition, particularly in the lower-capacity segments, can squeeze profit margins for manufacturers. Supply chain disruptions, especially for critical components like lithium-ion batteries, can impact production and availability. Stringent safety regulations and the need for product certifications add to development costs and time. Evolving consumer expectations for longer battery life and faster charging speeds necessitate continuous R&D investment.
Emerging Opportunities in Mini Mobile Power
Emerging opportunities in the mini mobile power industry lie in the development of eco-friendly and sustainable charging solutions, utilizing recycled materials and energy-efficient designs. The integration of wireless charging capabilities directly into mini power banks presents a significant untapped market. Furthermore, niche applications such as specialized power solutions for drones, portable medical devices, and augmented reality (AR) headsets offer promising growth avenues. The increasing demand for smart functionalities, like built-in device health monitoring or remote power management, also presents an opportunity for product differentiation.
Growth Accelerators in the Mini Mobile Power Industry
Several catalysts are driving long-term growth in the mini mobile power industry. Technological breakthroughs in battery energy density and charging speeds continue to push the boundaries of what is possible in compact form factors. Strategic partnerships between power bank manufacturers and device OEMs can lead to co-branded products and bundled offerings, expanding market reach. The growing trend of digital nomadism and remote work necessitates reliable portable power, creating sustained demand. Market expansion into emerging economies, coupled with increasing consumer awareness of the benefits of portable charging, will also accelerate growth.
Key Players Shaping the Mini Mobile Power Market
- Anker Innovations
- Xiaomi
- Samsung
- Romoss
- RavPower
- Pisen
- Philips
- Mophie
- Mipow
- Maxell
- Lepow
- Huawei
- HIPER
- Guangdong Pisen Electronics
- FSP Europe
- Besiter
- Baseus
- YOOBAO
- Xtorm
- Sony
- SCUD Group Limited
- Samya
Notable Milestones in Mini Mobile Power Sector
- 2019: Increased adoption of USB-C PD for faster charging in compact power banks.
- 2020: Introduction of GaN technology enabling smaller and more efficient charging adapters and power banks.
- 2021: Rise in demand for higher capacity mini power banks to support multiple device charging.
- 2022: Growing emphasis on sustainable materials and energy-efficient designs in product development.
- 2023: Emergence of smart power management features in higher-end mini mobile power solutions.
- 2024: Increased integration of wireless charging capabilities within compact power bank form factors.
In-Depth Mini Mobile Power Market Outlook
The future outlook for the mini mobile power market is exceptionally bright, fueled by ongoing technological advancements and evolving consumer needs. Growth accelerators such as further improvements in battery technology for higher energy density and faster charging, coupled with strategic market expansion into underserved regions, will continue to propel the industry forward. The increasing adoption of electric vehicles (EVs) may also present opportunities for integrated or complementary portable power solutions. Furthermore, the growing demand for specialized power solutions for emerging technologies like IoT devices and wearables will create new market segments. Companies that focus on innovation, sustainability, and user-centric design will be best positioned to capitalize on the expanding opportunities within this dynamic market.
Mini Mobile Power Segmentation
-
1. Application
- 1.1. Online
- 1.2. Offline
-
2. Types
- 2.1. Below 10000 mAh
- 2.2. 10001-20000 mAh
- 2.3. Above 20000 mAh
Mini Mobile Power Segmentation By Geography
-
1. North America
- 1.1. United States
- 1.2. Canada
- 1.3. Mexico
-
2. South America
- 2.1. Brazil
- 2.2. Argentina
- 2.3. Rest of South America
-
3. Europe
- 3.1. United Kingdom
- 3.2. Germany
- 3.3. France
- 3.4. Italy
- 3.5. Spain
- 3.6. Russia
- 3.7. Benelux
- 3.8. Nordics
- 3.9. Rest of Europe
-
4. Middle East & Africa
- 4.1. Turkey
- 4.2. Israel
- 4.3. GCC
- 4.4. North Africa
- 4.5. South Africa
- 4.6. Rest of Middle East & Africa
-
5. Asia Pacific
- 5.1. China
- 5.2. India
- 5.3. Japan
- 5.4. South Korea
- 5.5. ASEAN
- 5.6. Oceania
- 5.7. Rest of Asia Pacific
Mini Mobile Power Regional Market Share
Geographic Coverage of Mini Mobile Power
Mini Mobile Power REPORT HIGHLIGHTS
| Aspects | Details |
|---|---|
| Study Period | 2020-2034 |
| Base Year | 2025 |
| Estimated Year | 2026 |
| Forecast Period | 2026-2034 |
| Historical Period | 2020-2025 |
| Growth Rate | CAGR of 8.04% from 2020-2034 |
| Segmentation |
|
Table of Contents
- 1. Introduction
- 1.1. Research Scope
- 1.2. Market Segmentation
- 1.3. Research Objective
- 1.4. Definitions and Assumptions
- 2. Executive Summary
- 2.1. Market Snapshot
- 3. Market Dynamics
- 3.1. Market Drivers
- 3.2. Market Restrains
- 3.3. Market Trends
- 3.4. Market Opportunities
- 4. Market Factor Analysis
- 4.1. Porters Five Forces
- 4.1.1. Bargaining Power of Suppliers
- 4.1.2. Bargaining Power of Buyers
- 4.1.3. Threat of New Entrants
- 4.1.4. Threat of Substitutes
- 4.1.5. Competitive Rivalry
- 4.2. PESTEL analysis
- 4.3. BCG Analysis
- 4.3.1. Stars (High Growth, High Market Share)
- 4.3.2. Cash Cows (Low Growth, High Market Share)
- 4.3.3. Question Mark (High Growth, Low Market Share)
- 4.3.4. Dogs (Low Growth, Low Market Share)
- 4.4. Ansoff Matrix Analysis
- 4.5. Supply Chain Analysis
- 4.6. Regulatory Landscape
- 4.7. Current Market Potential and Opportunity Assessment (TAM–SAM–SOM Framework)
- 4.8. IMR Analyst Note
- 4.1. Porters Five Forces
- 5. Market Analysis, Insights and Forecast 2021-2033
- 5.1. Market Analysis, Insights and Forecast - by Application
- 5.1.1. Online
- 5.1.2. Offline
- 5.2. Market Analysis, Insights and Forecast - by Types
- 5.2.1. Below 10000 mAh
- 5.2.2. 10001-20000 mAh
- 5.2.3. Above 20000 mAh
- 5.3. Market Analysis, Insights and Forecast - by Region
- 5.3.1. North America
- 5.3.2. South America
- 5.3.3. Europe
- 5.3.4. Middle East & Africa
- 5.3.5. Asia Pacific
- 5.1. Market Analysis, Insights and Forecast - by Application
- 6. Global Mini Mobile Power Analysis, Insights and Forecast, 2021-2033
- 6.1. Market Analysis, Insights and Forecast - by Application
- 6.1.1. Online
- 6.1.2. Offline
- 6.2. Market Analysis, Insights and Forecast - by Types
- 6.2.1. Below 10000 mAh
- 6.2.2. 10001-20000 mAh
- 6.2.3. Above 20000 mAh
- 6.1. Market Analysis, Insights and Forecast - by Application
- 7. North America Mini Mobile Power Analysis, Insights and Forecast, 2020-2032
- 7.1. Market Analysis, Insights and Forecast - by Application
- 7.1.1. Online
- 7.1.2. Offline
- 7.2. Market Analysis, Insights and Forecast - by Types
- 7.2.1. Below 10000 mAh
- 7.2.2. 10001-20000 mAh
- 7.2.3. Above 20000 mAh
- 7.1. Market Analysis, Insights and Forecast - by Application
- 8. South America Mini Mobile Power Analysis, Insights and Forecast, 2020-2032
- 8.1. Market Analysis, Insights and Forecast - by Application
- 8.1.1. Online
- 8.1.2. Offline
- 8.2. Market Analysis, Insights and Forecast - by Types
- 8.2.1. Below 10000 mAh
- 8.2.2. 10001-20000 mAh
- 8.2.3. Above 20000 mAh
- 8.1. Market Analysis, Insights and Forecast - by Application
- 9. Europe Mini Mobile Power Analysis, Insights and Forecast, 2020-2032
- 9.1. Market Analysis, Insights and Forecast - by Application
- 9.1.1. Online
- 9.1.2. Offline
- 9.2. Market Analysis, Insights and Forecast - by Types
- 9.2.1. Below 10000 mAh
- 9.2.2. 10001-20000 mAh
- 9.2.3. Above 20000 mAh
- 9.1. Market Analysis, Insights and Forecast - by Application
- 10. Middle East & Africa Mini Mobile Power Analysis, Insights and Forecast, 2020-2032
- 10.1. Market Analysis, Insights and Forecast - by Application
- 10.1.1. Online
- 10.1.2. Offline
- 10.2. Market Analysis, Insights and Forecast - by Types
- 10.2.1. Below 10000 mAh
- 10.2.2. 10001-20000 mAh
- 10.2.3. Above 20000 mAh
- 10.1. Market Analysis, Insights and Forecast - by Application
- 11. Asia Pacific Mini Mobile Power Analysis, Insights and Forecast, 2020-2032
- 11.1. Market Analysis, Insights and Forecast - by Application
- 11.1.1. Online
- 11.1.2. Offline
- 11.2. Market Analysis, Insights and Forecast - by Types
- 11.2.1. Below 10000 mAh
- 11.2.2. 10001-20000 mAh
- 11.2.3. Above 20000 mAh
- 11.1. Market Analysis, Insights and Forecast - by Application
- 12. Competitive Analysis
- 12.1. Company Profiles
- 12.1.1 YOOBAO
- 12.1.1.1. Company Overview
- 12.1.1.2. Products
- 12.1.1.3. Company Financials
- 12.1.1.4. SWOT Analysis
- 12.1.2 Xtorm
- 12.1.2.1. Company Overview
- 12.1.2.2. Products
- 12.1.2.3. Company Financials
- 12.1.2.4. SWOT Analysis
- 12.1.3 Xiaomi
- 12.1.3.1. Company Overview
- 12.1.3.2. Products
- 12.1.3.3. Company Financials
- 12.1.3.4. SWOT Analysis
- 12.1.4 Sony
- 12.1.4.1. Company Overview
- 12.1.4.2. Products
- 12.1.4.3. Company Financials
- 12.1.4.4. SWOT Analysis
- 12.1.5 SCUD Group Limited
- 12.1.5.1. Company Overview
- 12.1.5.2. Products
- 12.1.5.3. Company Financials
- 12.1.5.4. SWOT Analysis
- 12.1.6 Samya
- 12.1.6.1. Company Overview
- 12.1.6.2. Products
- 12.1.6.3. Company Financials
- 12.1.6.4. SWOT Analysis
- 12.1.7 Samsung
- 12.1.7.1. Company Overview
- 12.1.7.2. Products
- 12.1.7.3. Company Financials
- 12.1.7.4. SWOT Analysis
- 12.1.8 Romoss
- 12.1.8.1. Company Overview
- 12.1.8.2. Products
- 12.1.8.3. Company Financials
- 12.1.8.4. SWOT Analysis
- 12.1.9 RavPower
- 12.1.9.1. Company Overview
- 12.1.9.2. Products
- 12.1.9.3. Company Financials
- 12.1.9.4. SWOT Analysis
- 12.1.10 Pisen
- 12.1.10.1. Company Overview
- 12.1.10.2. Products
- 12.1.10.3. Company Financials
- 12.1.10.4. SWOT Analysis
- 12.1.11 Philips
- 12.1.11.1. Company Overview
- 12.1.11.2. Products
- 12.1.11.3. Company Financials
- 12.1.11.4. SWOT Analysis
- 12.1.12 Mophie
- 12.1.12.1. Company Overview
- 12.1.12.2. Products
- 12.1.12.3. Company Financials
- 12.1.12.4. SWOT Analysis
- 12.1.13 Mipow
- 12.1.13.1. Company Overview
- 12.1.13.2. Products
- 12.1.13.3. Company Financials
- 12.1.13.4. SWOT Analysis
- 12.1.14 Maxell
- 12.1.14.1. Company Overview
- 12.1.14.2. Products
- 12.1.14.3. Company Financials
- 12.1.14.4. SWOT Analysis
- 12.1.15 Lepow
- 12.1.15.1. Company Overview
- 12.1.15.2. Products
- 12.1.15.3. Company Financials
- 12.1.15.4. SWOT Analysis
- 12.1.16 Huawei
- 12.1.16.1. Company Overview
- 12.1.16.2. Products
- 12.1.16.3. Company Financials
- 12.1.16.4. SWOT Analysis
- 12.1.17 HIPER
- 12.1.17.1. Company Overview
- 12.1.17.2. Products
- 12.1.17.3. Company Financials
- 12.1.17.4. SWOT Analysis
- 12.1.18 Guangdong Pisen Electronics
- 12.1.18.1. Company Overview
- 12.1.18.2. Products
- 12.1.18.3. Company Financials
- 12.1.18.4. SWOT Analysis
- 12.1.19 FSP Europe
- 12.1.19.1. Company Overview
- 12.1.19.2. Products
- 12.1.19.3. Company Financials
- 12.1.19.4. SWOT Analysis
- 12.1.20 Besiter
- 12.1.20.1. Company Overview
- 12.1.20.2. Products
- 12.1.20.3. Company Financials
- 12.1.20.4. SWOT Analysis
- 12.1.21 Baseus
- 12.1.21.1. Company Overview
- 12.1.21.2. Products
- 12.1.21.3. Company Financials
- 12.1.21.4. SWOT Analysis
- 12.1.22 Anker Innovations
- 12.1.22.1. Company Overview
- 12.1.22.2. Products
- 12.1.22.3. Company Financials
- 12.1.22.4. SWOT Analysis
- 12.1.23 aigo
- 12.1.23.1. Company Overview
- 12.1.23.2. Products
- 12.1.23.3. Company Financials
- 12.1.23.4. SWOT Analysis
- 12.1.1 YOOBAO
- 12.2. Market Entropy
- 12.2.1 Company's Key Areas Served
- 12.2.2 Recent Developments
- 12.3. Company Market Share Analysis 2025
- 12.3.1 Top 5 Companies Market Share Analysis
- 12.3.2 Top 3 Companies Market Share Analysis
- 12.4. List of Potential Customers
- 13. Research Methodology
List of Figures
- Figure 1: Global Mini Mobile Power Revenue Breakdown (undefined, %) by Region 2025 & 2033
- Figure 2: North America Mini Mobile Power Revenue (undefined), by Application 2025 & 2033
- Figure 3: North America Mini Mobile Power Revenue Share (%), by Application 2025 & 2033
- Figure 4: North America Mini Mobile Power Revenue (undefined), by Types 2025 & 2033
- Figure 5: North America Mini Mobile Power Revenue Share (%), by Types 2025 & 2033
- Figure 6: North America Mini Mobile Power Revenue (undefined), by Country 2025 & 2033
- Figure 7: North America Mini Mobile Power Revenue Share (%), by Country 2025 & 2033
- Figure 8: South America Mini Mobile Power Revenue (undefined), by Application 2025 & 2033
- Figure 9: South America Mini Mobile Power Revenue Share (%), by Application 2025 & 2033
- Figure 10: South America Mini Mobile Power Revenue (undefined), by Types 2025 & 2033
- Figure 11: South America Mini Mobile Power Revenue Share (%), by Types 2025 & 2033
- Figure 12: South America Mini Mobile Power Revenue (undefined), by Country 2025 & 2033
- Figure 13: South America Mini Mobile Power Revenue Share (%), by Country 2025 & 2033
- Figure 14: Europe Mini Mobile Power Revenue (undefined), by Application 2025 & 2033
- Figure 15: Europe Mini Mobile Power Revenue Share (%), by Application 2025 & 2033
- Figure 16: Europe Mini Mobile Power Revenue (undefined), by Types 2025 & 2033
- Figure 17: Europe Mini Mobile Power Revenue Share (%), by Types 2025 & 2033
- Figure 18: Europe Mini Mobile Power Revenue (undefined), by Country 2025 & 2033
- Figure 19: Europe Mini Mobile Power Revenue Share (%), by Country 2025 & 2033
- Figure 20: Middle East & Africa Mini Mobile Power Revenue (undefined), by Application 2025 & 2033
- Figure 21: Middle East & Africa Mini Mobile Power Revenue Share (%), by Application 2025 & 2033
- Figure 22: Middle East & Africa Mini Mobile Power Revenue (undefined), by Types 2025 & 2033
- Figure 23: Middle East & Africa Mini Mobile Power Revenue Share (%), by Types 2025 & 2033
- Figure 24: Middle East & Africa Mini Mobile Power Revenue (undefined), by Country 2025 & 2033
- Figure 25: Middle East & Africa Mini Mobile Power Revenue Share (%), by Country 2025 & 2033
- Figure 26: Asia Pacific Mini Mobile Power Revenue (undefined), by Application 2025 & 2033
- Figure 27: Asia Pacific Mini Mobile Power Revenue Share (%), by Application 2025 & 2033
- Figure 28: Asia Pacific Mini Mobile Power Revenue (undefined), by Types 2025 & 2033
- Figure 29: Asia Pacific Mini Mobile Power Revenue Share (%), by Types 2025 & 2033
- Figure 30: Asia Pacific Mini Mobile Power Revenue (undefined), by Country 2025 & 2033
- Figure 31: Asia Pacific Mini Mobile Power Revenue Share (%), by Country 2025 & 2033
List of Tables
- Table 1: Global Mini Mobile Power Revenue undefined Forecast, by Application 2020 & 2033
- Table 2: Global Mini Mobile Power Revenue undefined Forecast, by Types 2020 & 2033
- Table 3: Global Mini Mobile Power Revenue undefined Forecast, by Region 2020 & 2033
- Table 4: Global Mini Mobile Power Revenue undefined Forecast, by Application 2020 & 2033
- Table 5: Global Mini Mobile Power Revenue undefined Forecast, by Types 2020 & 2033
- Table 6: Global Mini Mobile Power Revenue undefined Forecast, by Country 2020 & 2033
- Table 7: United States Mini Mobile Power Revenue (undefined) Forecast, by Application 2020 & 2033
- Table 8: Canada Mini Mobile Power Revenue (undefined) Forecast, by Application 2020 & 2033
- Table 9: Mexico Mini Mobile Power Revenue (undefined) Forecast, by Application 2020 & 2033
- Table 10: Global Mini Mobile Power Revenue undefined Forecast, by Application 2020 & 2033
- Table 11: Global Mini Mobile Power Revenue undefined Forecast, by Types 2020 & 2033
- Table 12: Global Mini Mobile Power Revenue undefined Forecast, by Country 2020 & 2033
- Table 13: Brazil Mini Mobile Power Revenue (undefined) Forecast, by Application 2020 & 2033
- Table 14: Argentina Mini Mobile Power Revenue (undefined) Forecast, by Application 2020 & 2033
- Table 15: Rest of South America Mini Mobile Power Revenue (undefined) Forecast, by Application 2020 & 2033
- Table 16: Global Mini Mobile Power Revenue undefined Forecast, by Application 2020 & 2033
- Table 17: Global Mini Mobile Power Revenue undefined Forecast, by Types 2020 & 2033
- Table 18: Global Mini Mobile Power Revenue undefined Forecast, by Country 2020 & 2033
- Table 19: United Kingdom Mini Mobile Power Revenue (undefined) Forecast, by Application 2020 & 2033
- Table 20: Germany Mini Mobile Power Revenue (undefined) Forecast, by Application 2020 & 2033
- Table 21: France Mini Mobile Power Revenue (undefined) Forecast, by Application 2020 & 2033
- Table 22: Italy Mini Mobile Power Revenue (undefined) Forecast, by Application 2020 & 2033
- Table 23: Spain Mini Mobile Power Revenue (undefined) Forecast, by Application 2020 & 2033
- Table 24: Russia Mini Mobile Power Revenue (undefined) Forecast, by Application 2020 & 2033
- Table 25: Benelux Mini Mobile Power Revenue (undefined) Forecast, by Application 2020 & 2033
- Table 26: Nordics Mini Mobile Power Revenue (undefined) Forecast, by Application 2020 & 2033
- Table 27: Rest of Europe Mini Mobile Power Revenue (undefined) Forecast, by Application 2020 & 2033
- Table 28: Global Mini Mobile Power Revenue undefined Forecast, by Application 2020 & 2033
- Table 29: Global Mini Mobile Power Revenue undefined Forecast, by Types 2020 & 2033
- Table 30: Global Mini Mobile Power Revenue undefined Forecast, by Country 2020 & 2033
- Table 31: Turkey Mini Mobile Power Revenue (undefined) Forecast, by Application 2020 & 2033
- Table 32: Israel Mini Mobile Power Revenue (undefined) Forecast, by Application 2020 & 2033
- Table 33: GCC Mini Mobile Power Revenue (undefined) Forecast, by Application 2020 & 2033
- Table 34: North Africa Mini Mobile Power Revenue (undefined) Forecast, by Application 2020 & 2033
- Table 35: South Africa Mini Mobile Power Revenue (undefined) Forecast, by Application 2020 & 2033
- Table 36: Rest of Middle East & Africa Mini Mobile Power Revenue (undefined) Forecast, by Application 2020 & 2033
- Table 37: Global Mini Mobile Power Revenue undefined Forecast, by Application 2020 & 2033
- Table 38: Global Mini Mobile Power Revenue undefined Forecast, by Types 2020 & 2033
- Table 39: Global Mini Mobile Power Revenue undefined Forecast, by Country 2020 & 2033
- Table 40: China Mini Mobile Power Revenue (undefined) Forecast, by Application 2020 & 2033
- Table 41: India Mini Mobile Power Revenue (undefined) Forecast, by Application 2020 & 2033
- Table 42: Japan Mini Mobile Power Revenue (undefined) Forecast, by Application 2020 & 2033
- Table 43: South Korea Mini Mobile Power Revenue (undefined) Forecast, by Application 2020 & 2033
- Table 44: ASEAN Mini Mobile Power Revenue (undefined) Forecast, by Application 2020 & 2033
- Table 45: Oceania Mini Mobile Power Revenue (undefined) Forecast, by Application 2020 & 2033
- Table 46: Rest of Asia Pacific Mini Mobile Power Revenue (undefined) Forecast, by Application 2020 & 2033
Frequently Asked Questions
1. What is the projected Compound Annual Growth Rate (CAGR) of the Mini Mobile Power?
The projected CAGR is approximately 8.04%.
2. Which companies are prominent players in the Mini Mobile Power?
Key companies in the market include YOOBAO, Xtorm, Xiaomi, Sony, SCUD Group Limited, Samya, Samsung, Romoss, RavPower, Pisen, Philips, Mophie, Mipow, Maxell, Lepow, Huawei, HIPER, Guangdong Pisen Electronics, FSP Europe, Besiter, Baseus, Anker Innovations, aigo.
3. What are the main segments of the Mini Mobile Power?
The market segments include Application, Types.
4. Can you provide details about the market size?
The market size is estimated to be USD XXX N/A as of 2022.
5. What are some drivers contributing to market growth?
N/A
6. What are the notable trends driving market growth?
N/A
7. Are there any restraints impacting market growth?
N/A
8. Can you provide examples of recent developments in the market?
N/A
9. What pricing options are available for accessing the report?
Pricing options include single-user, multi-user, and enterprise licenses priced at USD 4900.00, USD 7350.00, and USD 9800.00 respectively.
10. Is the market size provided in terms of value or volume?
The market size is provided in terms of value, measured in N/A.
11. Are there any specific market keywords associated with the report?
Yes, the market keyword associated with the report is "Mini Mobile Power," which aids in identifying and referencing the specific market segment covered.
12. How do I determine which pricing option suits my needs best?
The pricing options vary based on user requirements and access needs. Individual users may opt for single-user licenses, while businesses requiring broader access may choose multi-user or enterprise licenses for cost-effective access to the report.
13. Are there any additional resources or data provided in the Mini Mobile Power report?
While the report offers comprehensive insights, it's advisable to review the specific contents or supplementary materials provided to ascertain if additional resources or data are available.
14. How can I stay updated on further developments or reports in the Mini Mobile Power?
To stay informed about further developments, trends, and reports in the Mini Mobile Power, consider subscribing to industry newsletters, following relevant companies and organizations, or regularly checking reputable industry news sources and publications.
Methodology
Step 1 - Identification of Relevant Samples Size from Population Database


Step 2 - Approaches for Defining Global Market Size (Value, Volume* & Price*)

Note*: In applicable scenarios
Step 3 - Data Sources
Primary Research
- Web Analytics
- Survey Reports
- Research Institute
- Latest Research Reports
- Opinion Leaders
Secondary Research
- Annual Reports
- White Paper
- Latest Press Release
- Industry Association
- Paid Database
- Investor Presentations

Step 4 - Data Triangulation
Involves using different sources of information in order to increase the validity of a study
These sources are likely to be stakeholders in a program - participants, other researchers, program staff, other community members, and so on.
Then we put all data in single framework & apply various statistical tools to find out the dynamic on the market.
During the analysis stage, feedback from the stakeholder groups would be compared to determine areas of agreement as well as areas of divergence