

Key Insights
The non-photo personalized gifts market is experiencing robust growth, estimated to be valued at USD 9.69 billion in 2024, with a projected Compound Annual Growth Rate (CAGR) of 7.03% through 2033. This expansion is fueled by an increasing consumer desire for unique and sentimentally valuable items that cater to individual preferences and relationships. The shift towards e-commerce has been a significant driver, making personalized products more accessible and convenient for a global audience. Online stores now represent a dominant channel, offering a vast array of customization options and reaching consumers beyond traditional retail footprints. Supermarkets and convenience stores are also adapting, integrating personalized gift offerings to capture impulse purchases and cater to immediate gifting needs. This market thrives on emotional connection, with consumers willing to invest in gifts that reflect personal stories, inside jokes, or special memories, moving beyond generic offerings. The versatility of personalization, encompassing everything from custom engravings on kitchenware to bespoke designs for stationery, further broadens its appeal across various demographics.

Non-photo Personalized Gifts Market Size (In Billion)
The market's dynamism is further shaped by emerging trends such as sustainable and ethically sourced personalized gifts, appealing to environmentally conscious consumers. Innovations in printing and engraving technologies are also enabling more intricate and high-quality customization. However, the market is not without its challenges. Maintaining consistent quality across a wide range of personalized products and managing efficient production and delivery timelines, especially for high-volume orders, remain key operational hurdles. Intense competition from a large number of players, ranging from large corporations like Disney to niche online platforms like Etsy and Redbubble, necessitates continuous innovation and strong brand differentiation. The ability of companies to offer unique personalization tools, exceptional customer service, and a seamless online experience will be critical for sustained success in this evolving and highly personal market.

Non-photo Personalized Gifts Company Market Share
This in-depth report provides an exhaustive analysis of the global Non-photo Personalized Gifts market, offering critical insights for industry professionals and stakeholders. Spanning the historical period of 2019-2024 and projecting growth through 2033, this study leverages robust data and expert analysis to illuminate market dynamics, growth trajectories, and emerging opportunities. Our focus remains on the parent and child market segments, ensuring a holistic view of market evolution.
Non-photo Personalized Gifts Market Dynamics & Structure
The Non-photo Personalized Gifts market exhibits a moderately consolidated structure, with a few key players like Cimpress, CafePress, and Zazzle holding significant market share. Technological innovation is a primary driver, fueled by advancements in printing technology, laser engraving, and 3D printing, enabling greater customization options and product diversity. Regulatory frameworks are generally supportive, focusing on intellectual property rights and consumer protection. Competitive product substitutes include mass-produced gifts and DIY craft supplies, but the unique value proposition of personalization continues to differentiate the market. End-user demographics are broad, encompassing millennials and Gen Z consumers who value unique and sentimental items, as well as older generations seeking traditional personalized keepsakes. Merger and acquisition (M&A) trends indicate strategic consolidation to expand product portfolios and geographical reach. For instance, the acquisition of smaller, niche personalization companies by larger entities is a recurring strategy to gain market access and technological capabilities. Innovation barriers exist in terms of high initial investment for advanced personalization equipment and the ongoing need to adapt to rapidly changing consumer design preferences.
- Market Concentration: Moderately consolidated, with key players investing heavily in proprietary personalization technologies.
- Technological Innovation Drivers: Advancements in direct-to-garment printing, laser etching, embroidery machines, and digital design software are crucial.
- Regulatory Frameworks: Primarily focused on consumer safety standards, data privacy for customization information, and intellectual property protection.
- Competitive Product Substitutes: Generic gifts, artisanal crafts, and do-it-yourself (DIY) personalization kits.
- End-User Demographics: Strong demand from younger demographics (Gen Z, Millennials) for unique, socially shareable items, alongside consistent demand from older demographics for sentimental, heirloom-quality gifts.
- M&A Trends: Strategic acquisitions by larger players to integrate specialized personalization technologies and customer bases.
- Innovation Barriers: High capital expenditure for advanced machinery and the challenge of staying ahead of evolving design trends and consumer expectations.
Non-photo Personalized Gifts Growth Trends & Insights
The Non-photo Personalized Gifts market is poised for significant expansion, driven by evolving consumer preferences for unique and meaningful products. The global market size, estimated at $15.3 billion in the base year 2025, is projected to reach $26.8 billion by 2033, exhibiting a compound annual growth rate (CAGR) of approximately 7.3% during the forecast period (2025-2033). This robust growth trajectory is underpinned by a substantial increase in online shopping penetration and the growing desire for distinctive gift options that go beyond mass-produced items. Technological disruptions, such as the integration of AI-powered design tools and augmented reality for previewing personalized items, are enhancing the customer experience and further stimulating adoption rates. Consumer behavior shifts are evident, with an increasing emphasis on sustainability and ethically sourced materials, which is influencing the types of non-photo personalized gifts being developed and marketed. The market penetration of personalized goods is steadily increasing as more consumers recognize the intrinsic value and emotional connection offered by bespoke items. Furthermore, the expansion of e-commerce platforms has democratized access to personalized gift options, making them more accessible to a wider audience. The influence of social media in showcasing unique personalized gifts also plays a crucial role in driving consumer interest and purchase decisions. The shift towards experiential gifting is also contributing, with personalized items often enhancing the recipient's experience. The parent market for personalized gifts, encompassing all forms of customization, is experiencing strong tailwinds, with the non-photo segment benefiting from its broader appeal across various occasions and recipient types.
Dominant Regions, Countries, or Segments in Non-photo Personalized Gifts
The Online Stores application segment is currently the most dominant force in the Non-photo Personalized Gifts market, driven by its unparalleled reach, convenience, and ability to showcase a vast array of customizable products. This segment is projected to continue its leadership throughout the forecast period. North America, particularly the United States, remains a key country driving market growth due to its high disposable income, strong e-commerce infrastructure, and a deeply ingrained culture of gift-giving that embraces personalization.
The Wearables & Accessories type segment is also a significant growth engine, encompassing personalized jewelry, apparel, bags, and footwear, which appeal to a broad consumer base seeking individual expression. The Decoration segment, including personalized home decor items like wall art, custom mugs, and photo frames (without photos), also holds substantial market share due to its appeal for creating unique living spaces.
- Dominant Application Segment: Online Stores
- Key Drivers: Extensive product variety, easy customization tools, global shipping capabilities, and 24/7 accessibility.
- Market Share & Growth Potential: Holds the largest market share and is expected to grow at a robust pace due to increasing internet penetration and e-commerce adoption globally.
- Dominant Country: United States
- Key Drivers: High consumer spending power, established online retail infrastructure, strong gifting culture, and a significant population segment that values bespoke items.
- Market Share & Growth Potential: Represents a substantial portion of the global market and is expected to maintain steady growth.
- Dominant Type Segments:
- Wearables & Accessories: High demand driven by self-expression and fashion trends.
- Decoration: Fueled by the desire for unique home aesthetics and personalized living spaces.
- Other Significant Segments:
- Kitchen & Tableware: Personalized mugs, glassware, and serving ware are consistently popular.
- Stationary & Greeting Cards: Ongoing demand for personalized invitations, stationery sets, and cards for special occasions.
Non-photo Personalized Gifts Product Landscape
The product landscape for non-photo personalized gifts is characterized by continuous innovation and diversification. Key product categories include engraved jewelry, embroidered apparel and textiles, custom-printed homeware (mugs, coasters, cushions), personalized stationery and notebooks, and laser-cut wooden or acrylic items. Technological advancements in digital printing, embroidery, and laser engraving enable intricate designs and precise personalization on a wide range of materials. Unique selling propositions lie in the ability to offer bespoke designs, monograms, custom messages, and artistic illustrations that resonate with individual tastes and preferences. Performance metrics are often tied to customer satisfaction, repeat purchase rates, and the perceived value of the personalized item as a unique and thoughtful gift.
Key Drivers, Barriers & Challenges in Non-photo Personalized Gifts
Key Drivers:
- Rising Disposable Income: Enables consumers to spend more on unique and personalized items.
- Evolving Consumer Preferences: A growing demand for unique, thoughtful, and customized products over mass-produced goods.
- Technological Advancements: Innovations in printing, engraving, and design software enhance customization capabilities and product quality.
- Growth of E-commerce: Provides a convenient platform for consumers to access and purchase personalized gifts globally.
- Social Media Influence: The visual nature of personalized gifts promotes sharing and discovery, driving demand.
Barriers & Challenges:
- Supply Chain Disruptions: Potential delays in sourcing customized materials and components can impact delivery times.
- High Production Costs: Specialized machinery and skilled labor can lead to higher manufacturing costs, impacting pricing.
- Intense Competition: The market is crowded, with both established players and numerous small businesses vying for market share.
- Perceived Value vs. Price: Balancing the cost of personalization with consumer willingness to pay for bespoke items.
- Intellectual Property Infringement: Protecting designs and ensuring authentic personalization can be challenging.
- Lead Time Management: Ensuring timely delivery of customized orders, especially during peak gifting seasons, is critical.
Emerging Opportunities in Non-photo Personalized Gifts
Emerging opportunities in the Non-photo Personalized Gifts market lie in the expansion of sustainable and eco-friendly personalization options, catering to the growing conscious consumerism trend. The integration of augmented reality (AR) for virtual product visualization and customization previews presents a significant opportunity to enhance the online shopping experience. Furthermore, the development of personalized gift boxes and curated subscription services for non-photo items, targeting niche interests and demographics, offers untapped market potential. Leveraging AI for personalized design recommendations based on recipient profiles and occasions can further personalize the customer journey and drive sales.
Growth Accelerators in the Non-photo Personalized Gifts Industry
Key growth accelerators for the Non-photo Personalized Gifts industry include the continuous development of more intuitive and accessible online personalization platforms, enabling a wider range of consumers to design their own products. Strategic partnerships between personalization companies and retailers across various sectors (e.g., fashion, home decor, electronics) can significantly expand market reach and introduce personalized options to new customer bases. The increasing adoption of 3D printing technology for unique, complex, and personalized decorative items also promises to be a significant growth driver. Furthermore, focusing on gifting occasions beyond traditional holidays, such as personalized gifts for anniversaries, graduations, and pet memorials, can unlock new revenue streams.
Key Players Shaping the Non-photo Personalized Gifts Market
- CafePress
- Things Remembered
- Cimpress
- Getting Personal
- PersonalizationMall
- Disney
- Funky Pigeon
- American Stationery
- Hallmark
- Memorable Gifts
- Etsy
- Redbubble
- Signature Gifts
- The Original Gift Company
- Zazzle
- Personalized Gift Shop
Notable Milestones in Non-photo Personalized Gifts Sector
- 2019: Increased adoption of direct-to-garment (DTG) printing technology for apparel personalization, improving quality and speed.
- 2020: Surge in demand for personalized home decor and workspace items due to increased time spent at home.
- 2021: Expansion of laser engraving capabilities for intricate designs on wood and metal products.
- 2022: Rise of online marketplaces like Etsy and Redbubble facilitating independent creators offering unique non-photo personalized gifts.
- 2023: Growing integration of AI-powered design tools for enhanced customer personalization experiences.
- 2024: Increased focus on sustainable materials and eco-friendly personalization processes.
In-Depth Non-photo Personalized Gifts Market Outlook
The future outlook for the Non-photo Personalized Gifts market remains exceptionally bright, fueled by a confluence of sustained consumer demand for individuality and ongoing technological innovation. Growth accelerators such as advanced personalization software, the increasing integration of AR/VR for immersive design experiences, and strategic collaborations with established brands will continue to propel market expansion. The increasing focus on unique and sentimental gifting occasions, coupled with the growing appeal of sustainable and ethically produced personalized items, indicates a robust and evolving market. Stakeholders can anticipate continued opportunities in catering to niche markets and developing innovative product applications that deepen the emotional connection between giver and receiver.
Non-photo Personalized Gifts Segmentation
-
1. Application
- 1.1. Supermarket
- 1.2. Convenience Store
- 1.3. Online Stores
- 1.4. Others
-
2. Types
- 2.1. Decoration
- 2.2. Wearables & Accessories
- 2.3. Kitchen & Tableware
- 2.4. Sports & Toys
- 2.5. Stationary & Greeting Cards
- 2.6. Others
Non-photo Personalized Gifts Segmentation By Geography
-
1. North America
- 1.1. United States
- 1.2. Canada
- 1.3. Mexico
-
2. South America
- 2.1. Brazil
- 2.2. Argentina
- 2.3. Rest of South America
-
3. Europe
- 3.1. United Kingdom
- 3.2. Germany
- 3.3. France
- 3.4. Italy
- 3.5. Spain
- 3.6. Russia
- 3.7. Benelux
- 3.8. Nordics
- 3.9. Rest of Europe
-
4. Middle East & Africa
- 4.1. Turkey
- 4.2. Israel
- 4.3. GCC
- 4.4. North Africa
- 4.5. South Africa
- 4.6. Rest of Middle East & Africa
-
5. Asia Pacific
- 5.1. China
- 5.2. India
- 5.3. Japan
- 5.4. South Korea
- 5.5. ASEAN
- 5.6. Oceania
- 5.7. Rest of Asia Pacific
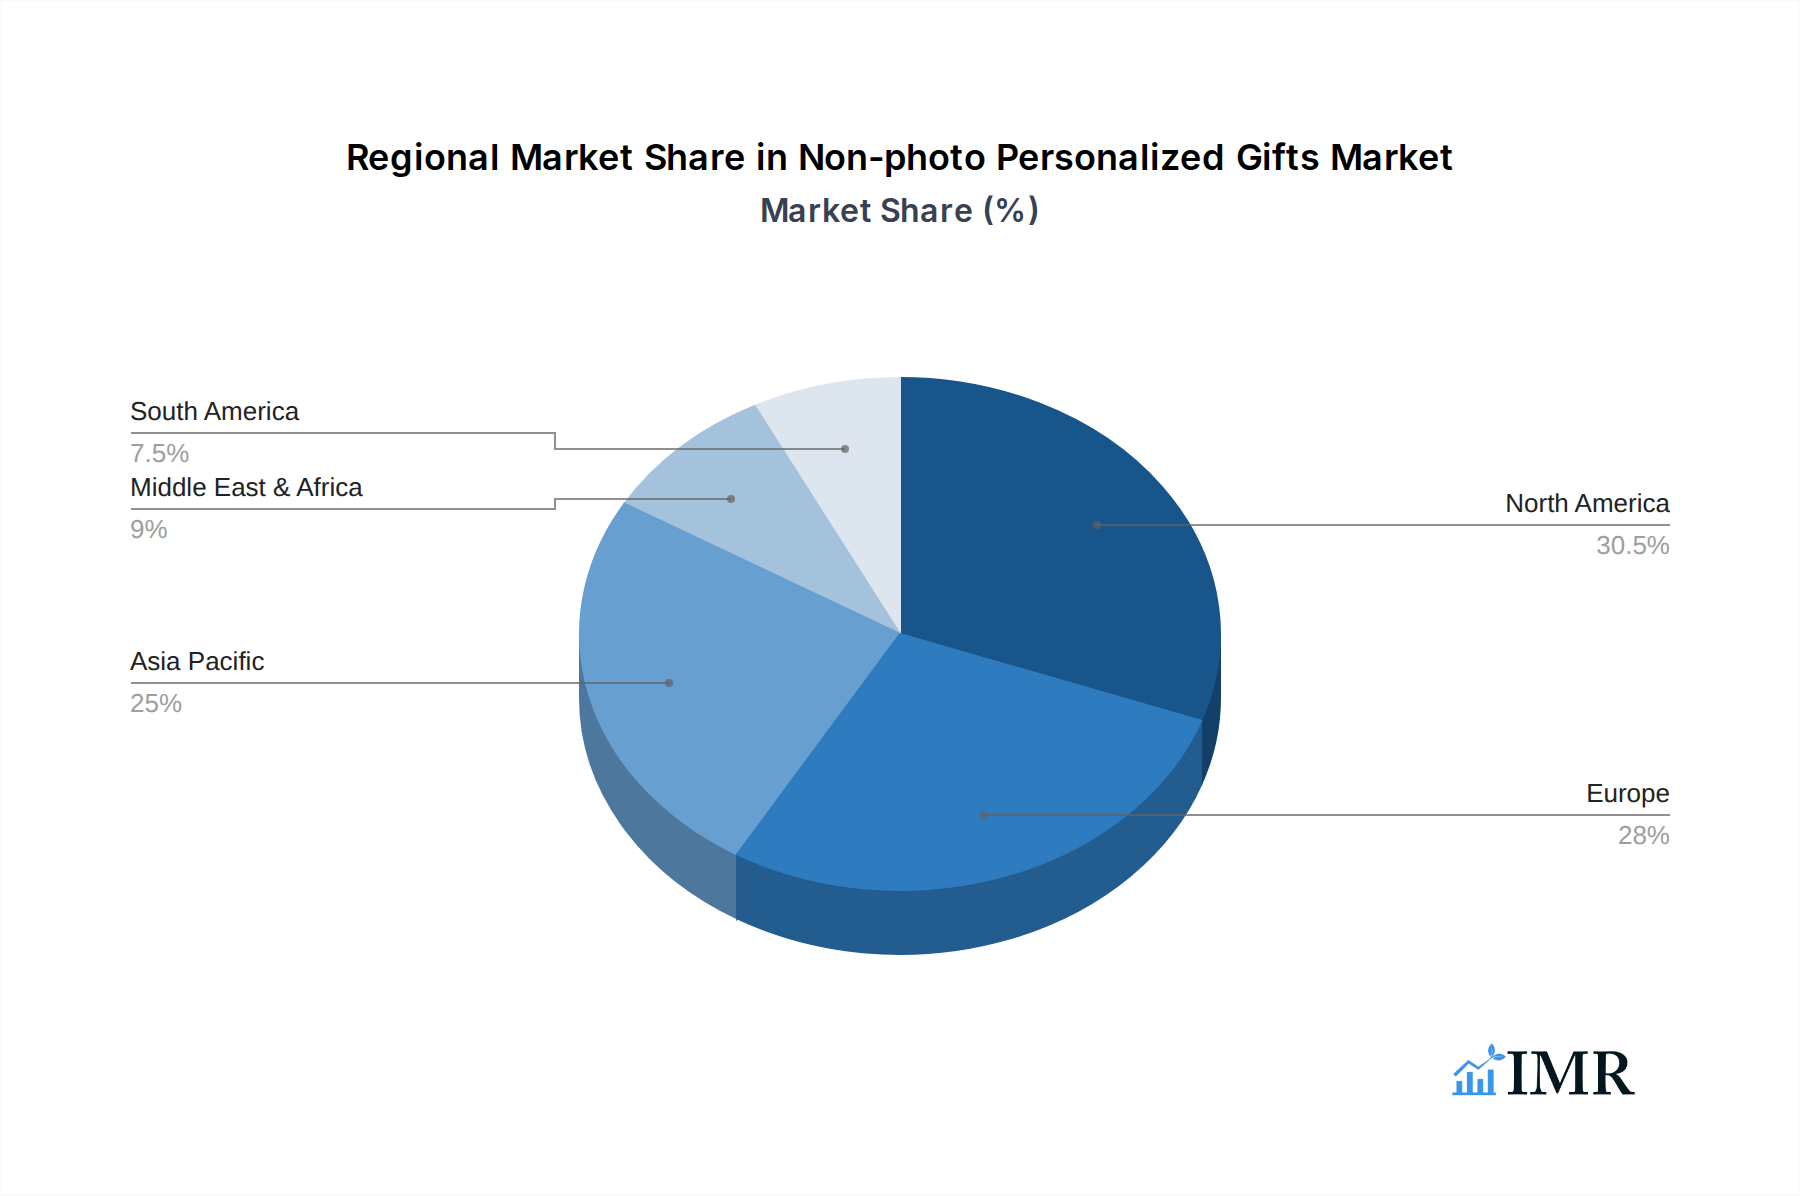
Non-photo Personalized Gifts Regional Market Share
Geographic Coverage of Non-photo Personalized Gifts
Non-photo Personalized Gifts REPORT HIGHLIGHTS
| Aspects | Details |
|---|---|
| Study Period | 2020-2034 |
| Base Year | 2025 |
| Estimated Year | 2026 |
| Forecast Period | 2026-2034 |
| Historical Period | 2020-2025 |
| Growth Rate | CAGR of 7.03% from 2020-2034 |
| Segmentation |
|
Table of Contents
- 1. Introduction
- 1.1. Research Scope
- 1.2. Market Segmentation
- 1.3. Research Methodology
- 1.4. Definitions and Assumptions
- 2. Executive Summary
- 2.1. Introduction
- 3. Market Dynamics
- 3.1. Introduction
- 3.2. Market Drivers
- 3.3. Market Restrains
- 3.4. Market Trends
- 4. Market Factor Analysis
- 4.1. Porters Five Forces
- 4.2. Supply/Value Chain
- 4.3. PESTEL analysis
- 4.4. Market Entropy
- 4.5. Patent/Trademark Analysis
- 5. Global Non-photo Personalized Gifts Analysis, Insights and Forecast, 2020-2032
- 5.1. Market Analysis, Insights and Forecast - by Application
- 5.1.1. Supermarket
- 5.1.2. Convenience Store
- 5.1.3. Online Stores
- 5.1.4. Others
- 5.2. Market Analysis, Insights and Forecast - by Types
- 5.2.1. Decoration
- 5.2.2. Wearables & Accessories
- 5.2.3. Kitchen & Tableware
- 5.2.4. Sports & Toys
- 5.2.5. Stationary & Greeting Cards
- 5.2.6. Others
- 5.3. Market Analysis, Insights and Forecast - by Region
- 5.3.1. North America
- 5.3.2. South America
- 5.3.3. Europe
- 5.3.4. Middle East & Africa
- 5.3.5. Asia Pacific
- 5.1. Market Analysis, Insights and Forecast - by Application
- 6. North America Non-photo Personalized Gifts Analysis, Insights and Forecast, 2020-2032
- 6.1. Market Analysis, Insights and Forecast - by Application
- 6.1.1. Supermarket
- 6.1.2. Convenience Store
- 6.1.3. Online Stores
- 6.1.4. Others
- 6.2. Market Analysis, Insights and Forecast - by Types
- 6.2.1. Decoration
- 6.2.2. Wearables & Accessories
- 6.2.3. Kitchen & Tableware
- 6.2.4. Sports & Toys
- 6.2.5. Stationary & Greeting Cards
- 6.2.6. Others
- 6.1. Market Analysis, Insights and Forecast - by Application
- 7. South America Non-photo Personalized Gifts Analysis, Insights and Forecast, 2020-2032
- 7.1. Market Analysis, Insights and Forecast - by Application
- 7.1.1. Supermarket
- 7.1.2. Convenience Store
- 7.1.3. Online Stores
- 7.1.4. Others
- 7.2. Market Analysis, Insights and Forecast - by Types
- 7.2.1. Decoration
- 7.2.2. Wearables & Accessories
- 7.2.3. Kitchen & Tableware
- 7.2.4. Sports & Toys
- 7.2.5. Stationary & Greeting Cards
- 7.2.6. Others
- 7.1. Market Analysis, Insights and Forecast - by Application
- 8. Europe Non-photo Personalized Gifts Analysis, Insights and Forecast, 2020-2032
- 8.1. Market Analysis, Insights and Forecast - by Application
- 8.1.1. Supermarket
- 8.1.2. Convenience Store
- 8.1.3. Online Stores
- 8.1.4. Others
- 8.2. Market Analysis, Insights and Forecast - by Types
- 8.2.1. Decoration
- 8.2.2. Wearables & Accessories
- 8.2.3. Kitchen & Tableware
- 8.2.4. Sports & Toys
- 8.2.5. Stationary & Greeting Cards
- 8.2.6. Others
- 8.1. Market Analysis, Insights and Forecast - by Application
- 9. Middle East & Africa Non-photo Personalized Gifts Analysis, Insights and Forecast, 2020-2032
- 9.1. Market Analysis, Insights and Forecast - by Application
- 9.1.1. Supermarket
- 9.1.2. Convenience Store
- 9.1.3. Online Stores
- 9.1.4. Others
- 9.2. Market Analysis, Insights and Forecast - by Types
- 9.2.1. Decoration
- 9.2.2. Wearables & Accessories
- 9.2.3. Kitchen & Tableware
- 9.2.4. Sports & Toys
- 9.2.5. Stationary & Greeting Cards
- 9.2.6. Others
- 9.1. Market Analysis, Insights and Forecast - by Application
- 10. Asia Pacific Non-photo Personalized Gifts Analysis, Insights and Forecast, 2020-2032
- 10.1. Market Analysis, Insights and Forecast - by Application
- 10.1.1. Supermarket
- 10.1.2. Convenience Store
- 10.1.3. Online Stores
- 10.1.4. Others
- 10.2. Market Analysis, Insights and Forecast - by Types
- 10.2.1. Decoration
- 10.2.2. Wearables & Accessories
- 10.2.3. Kitchen & Tableware
- 10.2.4. Sports & Toys
- 10.2.5. Stationary & Greeting Cards
- 10.2.6. Others
- 10.1. Market Analysis, Insights and Forecast - by Application
- 11. Competitive Analysis
- 11.1. Global Market Share Analysis 2025
- 11.2. Company Profiles
- 11.2.1 CafePress
- 11.2.1.1. Overview
- 11.2.1.2. Products
- 11.2.1.3. SWOT Analysis
- 11.2.1.4. Recent Developments
- 11.2.1.5. Financials (Based on Availability)
- 11.2.2 Things Remembered
- 11.2.2.1. Overview
- 11.2.2.2. Products
- 11.2.2.3. SWOT Analysis
- 11.2.2.4. Recent Developments
- 11.2.2.5. Financials (Based on Availability)
- 11.2.3 Cimpress
- 11.2.3.1. Overview
- 11.2.3.2. Products
- 11.2.3.3. SWOT Analysis
- 11.2.3.4. Recent Developments
- 11.2.3.5. Financials (Based on Availability)
- 11.2.4 Getting Personal
- 11.2.4.1. Overview
- 11.2.4.2. Products
- 11.2.4.3. SWOT Analysis
- 11.2.4.4. Recent Developments
- 11.2.4.5. Financials (Based on Availability)
- 11.2.5 PersonalizationMall
- 11.2.5.1. Overview
- 11.2.5.2. Products
- 11.2.5.3. SWOT Analysis
- 11.2.5.4. Recent Developments
- 11.2.5.5. Financials (Based on Availability)
- 11.2.6 Disney
- 11.2.6.1. Overview
- 11.2.6.2. Products
- 11.2.6.3. SWOT Analysis
- 11.2.6.4. Recent Developments
- 11.2.6.5. Financials (Based on Availability)
- 11.2.7 Funky Pigeon
- 11.2.7.1. Overview
- 11.2.7.2. Products
- 11.2.7.3. SWOT Analysis
- 11.2.7.4. Recent Developments
- 11.2.7.5. Financials (Based on Availability)
- 11.2.8 American Stationery
- 11.2.8.1. Overview
- 11.2.8.2. Products
- 11.2.8.3. SWOT Analysis
- 11.2.8.4. Recent Developments
- 11.2.8.5. Financials (Based on Availability)
- 11.2.9 Hallmark
- 11.2.9.1. Overview
- 11.2.9.2. Products
- 11.2.9.3. SWOT Analysis
- 11.2.9.4. Recent Developments
- 11.2.9.5. Financials (Based on Availability)
- 11.2.10 Memorable Gifts
- 11.2.10.1. Overview
- 11.2.10.2. Products
- 11.2.10.3. SWOT Analysis
- 11.2.10.4. Recent Developments
- 11.2.10.5. Financials (Based on Availability)
- 11.2.11 Etsy
- 11.2.11.1. Overview
- 11.2.11.2. Products
- 11.2.11.3. SWOT Analysis
- 11.2.11.4. Recent Developments
- 11.2.11.5. Financials (Based on Availability)
- 11.2.12 Redbubble
- 11.2.12.1. Overview
- 11.2.12.2. Products
- 11.2.12.3. SWOT Analysis
- 11.2.12.4. Recent Developments
- 11.2.12.5. Financials (Based on Availability)
- 11.2.13 Signature Gifts
- 11.2.13.1. Overview
- 11.2.13.2. Products
- 11.2.13.3. SWOT Analysis
- 11.2.13.4. Recent Developments
- 11.2.13.5. Financials (Based on Availability)
- 11.2.14 The Original Gift Company
- 11.2.14.1. Overview
- 11.2.14.2. Products
- 11.2.14.3. SWOT Analysis
- 11.2.14.4. Recent Developments
- 11.2.14.5. Financials (Based on Availability)
- 11.2.15 Zazzle
- 11.2.15.1. Overview
- 11.2.15.2. Products
- 11.2.15.3. SWOT Analysis
- 11.2.15.4. Recent Developments
- 11.2.15.5. Financials (Based on Availability)
- 11.2.16 Personalized Gift Shop
- 11.2.16.1. Overview
- 11.2.16.2. Products
- 11.2.16.3. SWOT Analysis
- 11.2.16.4. Recent Developments
- 11.2.16.5. Financials (Based on Availability)
- 11.2.1 CafePress
List of Figures
- Figure 1: Global Non-photo Personalized Gifts Revenue Breakdown (billion, %) by Region 2025 & 2033
- Figure 2: North America Non-photo Personalized Gifts Revenue (billion), by Application 2025 & 2033
- Figure 3: North America Non-photo Personalized Gifts Revenue Share (%), by Application 2025 & 2033
- Figure 4: North America Non-photo Personalized Gifts Revenue (billion), by Types 2025 & 2033
- Figure 5: North America Non-photo Personalized Gifts Revenue Share (%), by Types 2025 & 2033
- Figure 6: North America Non-photo Personalized Gifts Revenue (billion), by Country 2025 & 2033
- Figure 7: North America Non-photo Personalized Gifts Revenue Share (%), by Country 2025 & 2033
- Figure 8: South America Non-photo Personalized Gifts Revenue (billion), by Application 2025 & 2033
- Figure 9: South America Non-photo Personalized Gifts Revenue Share (%), by Application 2025 & 2033
- Figure 10: South America Non-photo Personalized Gifts Revenue (billion), by Types 2025 & 2033
- Figure 11: South America Non-photo Personalized Gifts Revenue Share (%), by Types 2025 & 2033
- Figure 12: South America Non-photo Personalized Gifts Revenue (billion), by Country 2025 & 2033
- Figure 13: South America Non-photo Personalized Gifts Revenue Share (%), by Country 2025 & 2033
- Figure 14: Europe Non-photo Personalized Gifts Revenue (billion), by Application 2025 & 2033
- Figure 15: Europe Non-photo Personalized Gifts Revenue Share (%), by Application 2025 & 2033
- Figure 16: Europe Non-photo Personalized Gifts Revenue (billion), by Types 2025 & 2033
- Figure 17: Europe Non-photo Personalized Gifts Revenue Share (%), by Types 2025 & 2033
- Figure 18: Europe Non-photo Personalized Gifts Revenue (billion), by Country 2025 & 2033
- Figure 19: Europe Non-photo Personalized Gifts Revenue Share (%), by Country 2025 & 2033
- Figure 20: Middle East & Africa Non-photo Personalized Gifts Revenue (billion), by Application 2025 & 2033
- Figure 21: Middle East & Africa Non-photo Personalized Gifts Revenue Share (%), by Application 2025 & 2033
- Figure 22: Middle East & Africa Non-photo Personalized Gifts Revenue (billion), by Types 2025 & 2033
- Figure 23: Middle East & Africa Non-photo Personalized Gifts Revenue Share (%), by Types 2025 & 2033
- Figure 24: Middle East & Africa Non-photo Personalized Gifts Revenue (billion), by Country 2025 & 2033
- Figure 25: Middle East & Africa Non-photo Personalized Gifts Revenue Share (%), by Country 2025 & 2033
- Figure 26: Asia Pacific Non-photo Personalized Gifts Revenue (billion), by Application 2025 & 2033
- Figure 27: Asia Pacific Non-photo Personalized Gifts Revenue Share (%), by Application 2025 & 2033
- Figure 28: Asia Pacific Non-photo Personalized Gifts Revenue (billion), by Types 2025 & 2033
- Figure 29: Asia Pacific Non-photo Personalized Gifts Revenue Share (%), by Types 2025 & 2033
- Figure 30: Asia Pacific Non-photo Personalized Gifts Revenue (billion), by Country 2025 & 2033
- Figure 31: Asia Pacific Non-photo Personalized Gifts Revenue Share (%), by Country 2025 & 2033
List of Tables
- Table 1: Global Non-photo Personalized Gifts Revenue billion Forecast, by Application 2020 & 2033
- Table 2: Global Non-photo Personalized Gifts Revenue billion Forecast, by Types 2020 & 2033
- Table 3: Global Non-photo Personalized Gifts Revenue billion Forecast, by Region 2020 & 2033
- Table 4: Global Non-photo Personalized Gifts Revenue billion Forecast, by Application 2020 & 2033
- Table 5: Global Non-photo Personalized Gifts Revenue billion Forecast, by Types 2020 & 2033
- Table 6: Global Non-photo Personalized Gifts Revenue billion Forecast, by Country 2020 & 2033
- Table 7: United States Non-photo Personalized Gifts Revenue (billion) Forecast, by Application 2020 & 2033
- Table 8: Canada Non-photo Personalized Gifts Revenue (billion) Forecast, by Application 2020 & 2033
- Table 9: Mexico Non-photo Personalized Gifts Revenue (billion) Forecast, by Application 2020 & 2033
- Table 10: Global Non-photo Personalized Gifts Revenue billion Forecast, by Application 2020 & 2033
- Table 11: Global Non-photo Personalized Gifts Revenue billion Forecast, by Types 2020 & 2033
- Table 12: Global Non-photo Personalized Gifts Revenue billion Forecast, by Country 2020 & 2033
- Table 13: Brazil Non-photo Personalized Gifts Revenue (billion) Forecast, by Application 2020 & 2033
- Table 14: Argentina Non-photo Personalized Gifts Revenue (billion) Forecast, by Application 2020 & 2033
- Table 15: Rest of South America Non-photo Personalized Gifts Revenue (billion) Forecast, by Application 2020 & 2033
- Table 16: Global Non-photo Personalized Gifts Revenue billion Forecast, by Application 2020 & 2033
- Table 17: Global Non-photo Personalized Gifts Revenue billion Forecast, by Types 2020 & 2033
- Table 18: Global Non-photo Personalized Gifts Revenue billion Forecast, by Country 2020 & 2033
- Table 19: United Kingdom Non-photo Personalized Gifts Revenue (billion) Forecast, by Application 2020 & 2033
- Table 20: Germany Non-photo Personalized Gifts Revenue (billion) Forecast, by Application 2020 & 2033
- Table 21: France Non-photo Personalized Gifts Revenue (billion) Forecast, by Application 2020 & 2033
- Table 22: Italy Non-photo Personalized Gifts Revenue (billion) Forecast, by Application 2020 & 2033
- Table 23: Spain Non-photo Personalized Gifts Revenue (billion) Forecast, by Application 2020 & 2033
- Table 24: Russia Non-photo Personalized Gifts Revenue (billion) Forecast, by Application 2020 & 2033
- Table 25: Benelux Non-photo Personalized Gifts Revenue (billion) Forecast, by Application 2020 & 2033
- Table 26: Nordics Non-photo Personalized Gifts Revenue (billion) Forecast, by Application 2020 & 2033
- Table 27: Rest of Europe Non-photo Personalized Gifts Revenue (billion) Forecast, by Application 2020 & 2033
- Table 28: Global Non-photo Personalized Gifts Revenue billion Forecast, by Application 2020 & 2033
- Table 29: Global Non-photo Personalized Gifts Revenue billion Forecast, by Types 2020 & 2033
- Table 30: Global Non-photo Personalized Gifts Revenue billion Forecast, by Country 2020 & 2033
- Table 31: Turkey Non-photo Personalized Gifts Revenue (billion) Forecast, by Application 2020 & 2033
- Table 32: Israel Non-photo Personalized Gifts Revenue (billion) Forecast, by Application 2020 & 2033
- Table 33: GCC Non-photo Personalized Gifts Revenue (billion) Forecast, by Application 2020 & 2033
- Table 34: North Africa Non-photo Personalized Gifts Revenue (billion) Forecast, by Application 2020 & 2033
- Table 35: South Africa Non-photo Personalized Gifts Revenue (billion) Forecast, by Application 2020 & 2033
- Table 36: Rest of Middle East & Africa Non-photo Personalized Gifts Revenue (billion) Forecast, by Application 2020 & 2033
- Table 37: Global Non-photo Personalized Gifts Revenue billion Forecast, by Application 2020 & 2033
- Table 38: Global Non-photo Personalized Gifts Revenue billion Forecast, by Types 2020 & 2033
- Table 39: Global Non-photo Personalized Gifts Revenue billion Forecast, by Country 2020 & 2033
- Table 40: China Non-photo Personalized Gifts Revenue (billion) Forecast, by Application 2020 & 2033
- Table 41: India Non-photo Personalized Gifts Revenue (billion) Forecast, by Application 2020 & 2033
- Table 42: Japan Non-photo Personalized Gifts Revenue (billion) Forecast, by Application 2020 & 2033
- Table 43: South Korea Non-photo Personalized Gifts Revenue (billion) Forecast, by Application 2020 & 2033
- Table 44: ASEAN Non-photo Personalized Gifts Revenue (billion) Forecast, by Application 2020 & 2033
- Table 45: Oceania Non-photo Personalized Gifts Revenue (billion) Forecast, by Application 2020 & 2033
- Table 46: Rest of Asia Pacific Non-photo Personalized Gifts Revenue (billion) Forecast, by Application 2020 & 2033
Frequently Asked Questions
1. What is the projected Compound Annual Growth Rate (CAGR) of the Non-photo Personalized Gifts?
The projected CAGR is approximately 7.03%.
2. Which companies are prominent players in the Non-photo Personalized Gifts?
Key companies in the market include CafePress, Things Remembered, Cimpress, Getting Personal, PersonalizationMall, Disney, Funky Pigeon, American Stationery, Hallmark, Memorable Gifts, Etsy, Redbubble, Signature Gifts, The Original Gift Company, Zazzle, Personalized Gift Shop.
3. What are the main segments of the Non-photo Personalized Gifts?
The market segments include Application, Types.
4. Can you provide details about the market size?
The market size is estimated to be USD 9.69 billion as of 2022.
5. What are some drivers contributing to market growth?
N/A
6. What are the notable trends driving market growth?
N/A
7. Are there any restraints impacting market growth?
N/A
8. Can you provide examples of recent developments in the market?
N/A
9. What pricing options are available for accessing the report?
Pricing options include single-user, multi-user, and enterprise licenses priced at USD 2900.00, USD 4350.00, and USD 5800.00 respectively.
10. Is the market size provided in terms of value or volume?
The market size is provided in terms of value, measured in billion.
11. Are there any specific market keywords associated with the report?
Yes, the market keyword associated with the report is "Non-photo Personalized Gifts," which aids in identifying and referencing the specific market segment covered.
12. How do I determine which pricing option suits my needs best?
The pricing options vary based on user requirements and access needs. Individual users may opt for single-user licenses, while businesses requiring broader access may choose multi-user or enterprise licenses for cost-effective access to the report.
13. Are there any additional resources or data provided in the Non-photo Personalized Gifts report?
While the report offers comprehensive insights, it's advisable to review the specific contents or supplementary materials provided to ascertain if additional resources or data are available.
14. How can I stay updated on further developments or reports in the Non-photo Personalized Gifts?
To stay informed about further developments, trends, and reports in the Non-photo Personalized Gifts, consider subscribing to industry newsletters, following relevant companies and organizations, or regularly checking reputable industry news sources and publications.
Methodology
Step 1 - Identification of Relevant Samples Size from Population Database


Step 2 - Approaches for Defining Global Market Size (Value, Volume* & Price*)

Note*: In applicable scenarios
Step 3 - Data Sources
Primary Research
- Web Analytics
- Survey Reports
- Research Institute
- Latest Research Reports
- Opinion Leaders
Secondary Research
- Annual Reports
- White Paper
- Latest Press Release
- Industry Association
- Paid Database
- Investor Presentations

Step 4 - Data Triangulation
Involves using different sources of information in order to increase the validity of a study
These sources are likely to be stakeholders in a program - participants, other researchers, program staff, other community members, and so on.
Then we put all data in single framework & apply various statistical tools to find out the dynamic on the market.
During the analysis stage, feedback from the stakeholder groups would be compared to determine areas of agreement as well as areas of divergence