

Key Insights
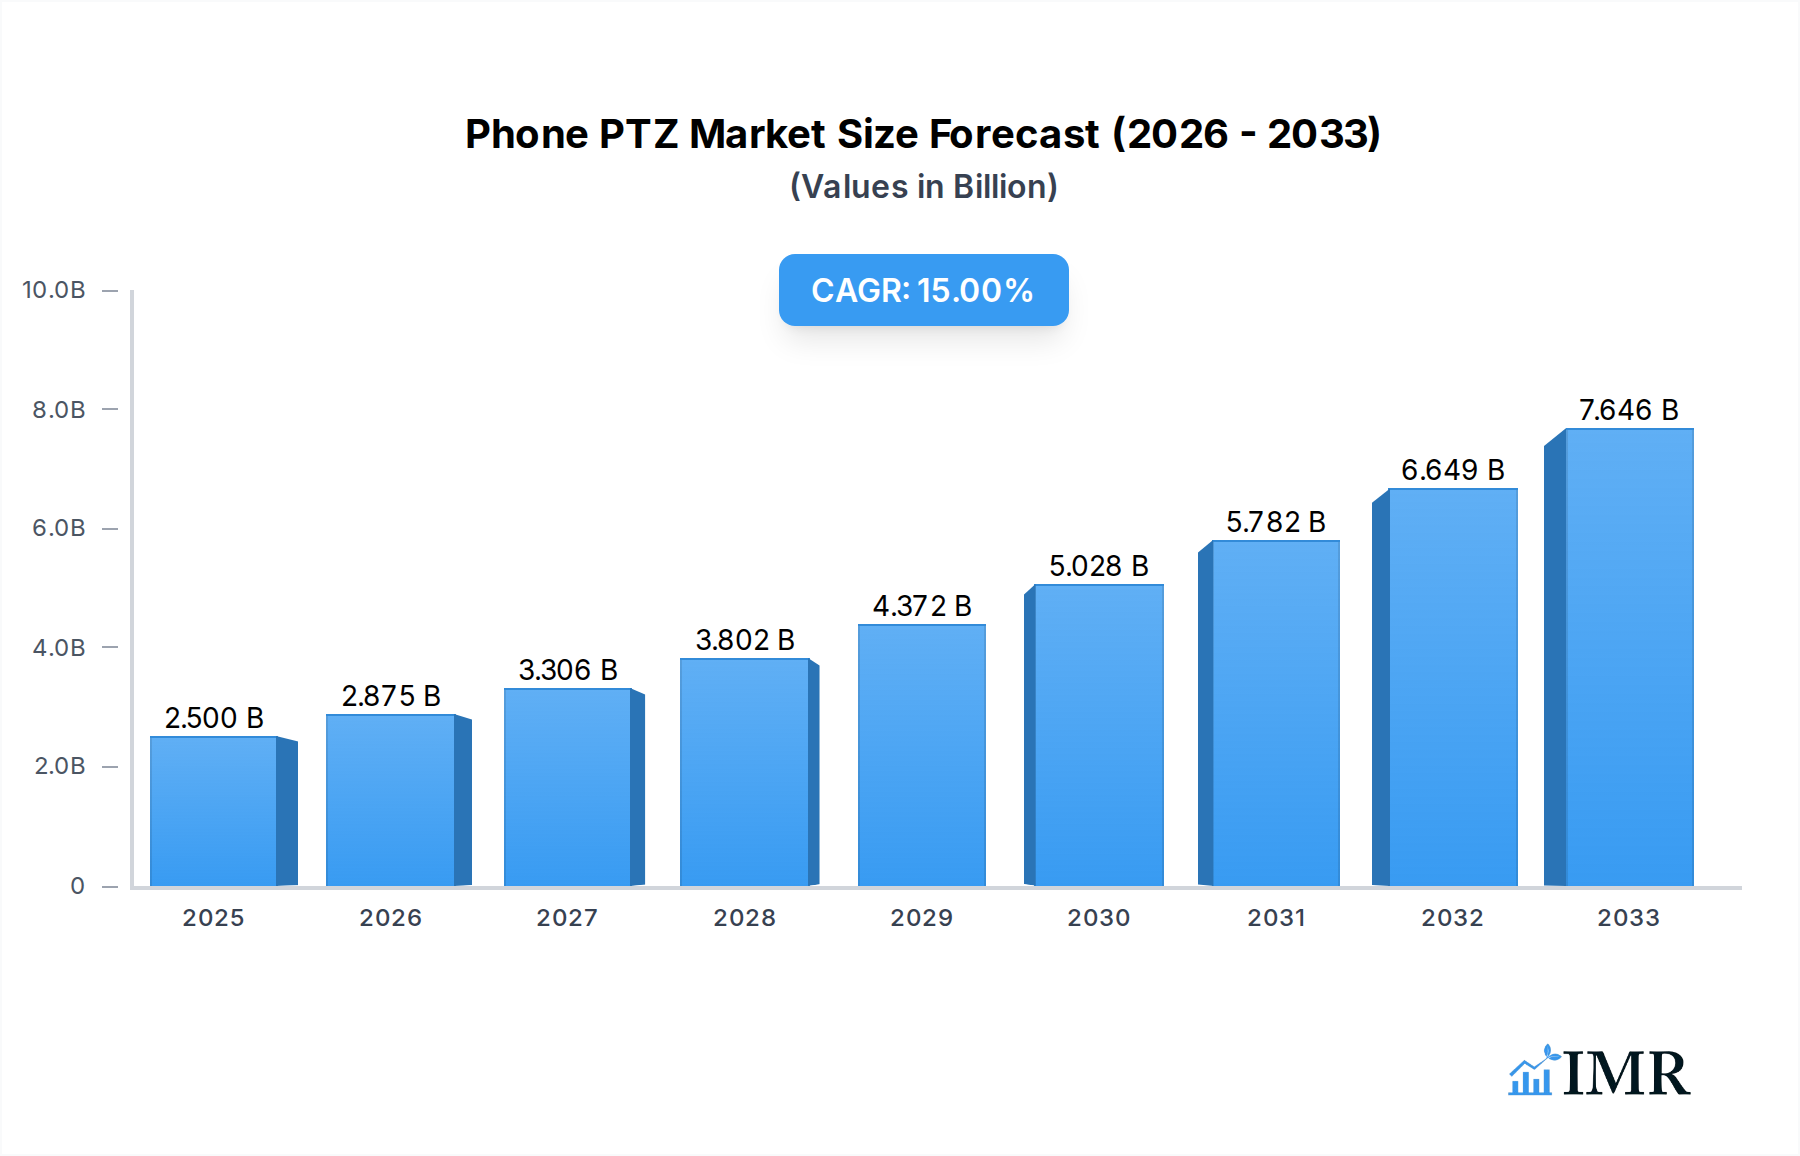
The global Phone PTZ (Pan-Tilt-Zoom) gimbal market is poised for significant expansion, projected to reach $2.5 billion in 2025. This robust growth trajectory is underpinned by an impressive Compound Annual Growth Rate (CAGR) of 15%, indicating a dynamic and rapidly evolving industry. The primary drivers fueling this surge are the escalating demand for high-quality mobile content creation, the proliferation of smartphones with advanced camera capabilities, and the increasing popularity of vlogging, social media content, and professional mobile videography. As consumers and professionals alike seek smoother, more stabilized, and dynamic video footage, PTZ gimbals have become indispensable accessories, enhancing the creative potential of mobile filmmaking. The market's expansion is further propelled by continuous technological advancements, with manufacturers introducing lighter, more intelligent, and feature-rich devices that cater to a broader user base, from casual users to seasoned content creators.

Phone PTZ Market Size (In Billion)
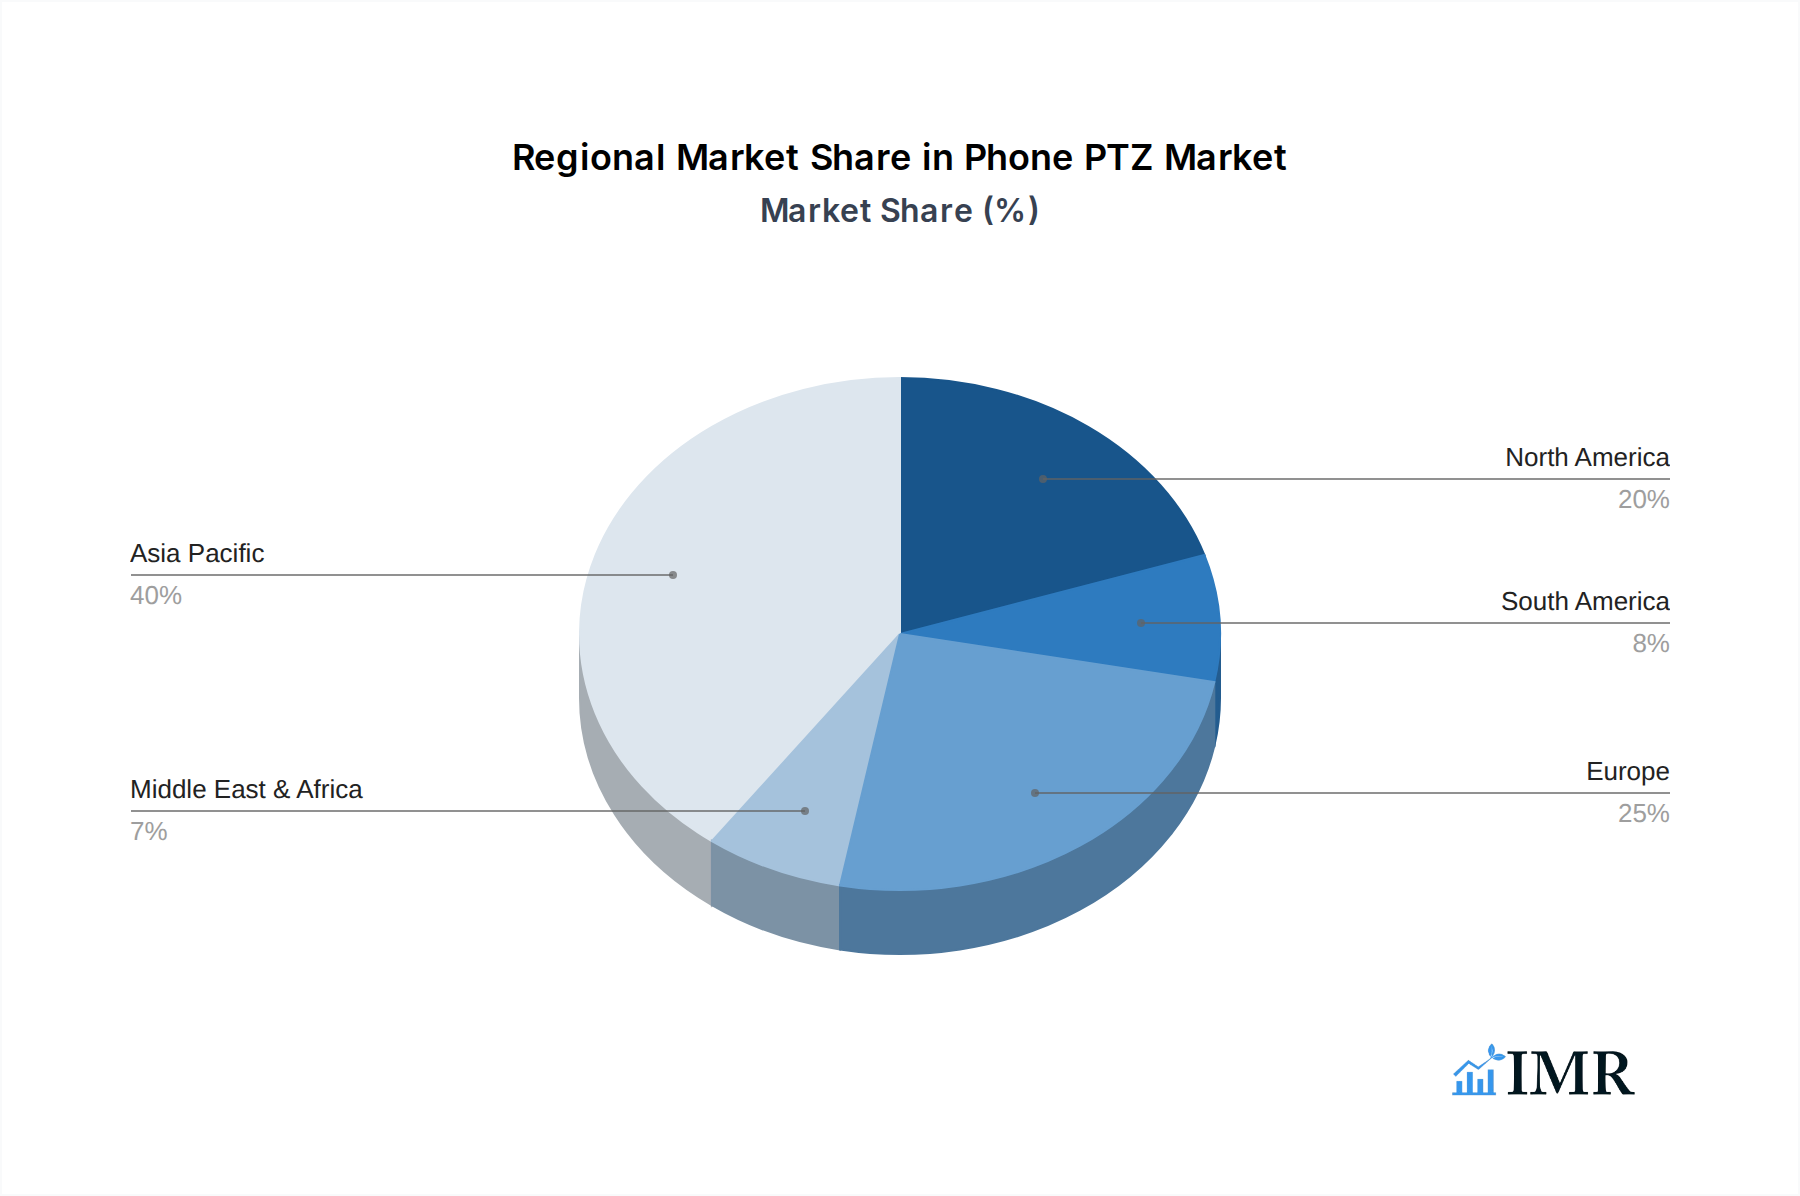
The market is segmented by application into iOS and Android phones, reflecting the ubiquitous nature of these platforms. In terms of type, single-axis and triaxial gimbals offer varied levels of stabilization and control, catering to different user needs and budgets. Leading companies such as DJI, Zhiyun, Hohem Tech, Gudsen MOZA, FeiyuTech, SIRUI, and HUAWEI are actively innovating, introducing products that offer superior stabilization, intelligent tracking features, and enhanced portability. Geographically, the Asia Pacific region, particularly China, is expected to dominate the market due to its large smartphone user base and a thriving content creation ecosystem. North America and Europe also represent substantial markets, driven by high disposable incomes and a strong culture of digital content consumption and creation. Despite the positive outlook, potential restraints such as the increasing cost of advanced technology and a highly competitive landscape necessitate ongoing innovation and strategic pricing from market players to maintain growth momentum.
Phone PTZ Company Market Share
This in-depth report provides a comprehensive analysis of the global Phone PTZ market, encompassing its dynamics, growth trends, regional dominance, product landscape, key drivers, challenges, and future outlook. With an extensive study period from 2019 to 2033 and a base year of 2025, this report delves into the intricate workings of the market, offering actionable insights for industry professionals, investors, and stakeholders.
Phone PTZ Market Dynamics & Structure
The global Phone PTZ market is characterized by a moderate concentration, with leading players like DJI and Zhiyun dominating a significant portion of the market share. Technological innovation remains a primary driver, fueled by advancements in gimbal stabilization, AI-powered object tracking, and enhanced portability. Regulatory frameworks, while nascent in some regions, are beginning to influence product development, particularly concerning drone integration and data privacy. Competitive product substitutes, such as advanced smartphone camera features and traditional camera stabilizers, present a constant challenge, requiring continuous innovation from Phone PTZ manufacturers. End-user demographics are diverse, ranging from amateur content creators to professional videographers and enterprise users in sectors like real estate and event management. Mergers and Acquisitions (M&A) have been observed, with smaller innovative companies being acquired by larger players to expand their product portfolios and technological capabilities. For instance, the historical period saw approximately 3-5 strategic acquisitions annually. Barriers to innovation include the high cost of research and development for advanced stabilization algorithms and the need for robust, durable designs that can withstand various environmental conditions.
- Market Concentration: Moderate, with top 3 players holding ~55% market share.
- Technological Innovation Drivers: AI object tracking, advanced stabilization, compact designs, long battery life.
- Regulatory Frameworks: Evolving, with a focus on drone integration and data security.
- Competitive Product Substitutes: Advanced smartphone camera features, traditional camera stabilizers.
- End-User Demographics: Content creators, professional videographers, enterprise users (real estate, events).
- M&A Trends: Steady acquisition of smaller tech firms by larger players.
- Innovation Barriers: R&D costs, design durability, software integration complexity.
Phone PTZ Growth Trends & Insights
The global Phone PTZ market is projected for substantial growth, driven by the ubiquitous adoption of smartphones and the escalating demand for high-quality mobile video content. The market size, estimated at $3.8 billion in 2025, is anticipated to witness a Compound Annual Growth Rate (CAGR) of 12.5% from 2025 to 2033, reaching an estimated $9.8 billion by 2033. Adoption rates are soaring, particularly among content creators and social media influencers who rely on stable, professional-looking footage for platforms like TikTok, YouTube, and Instagram. Technological disruptions, such as the integration of AI for intelligent framing and scene recognition, are further enhancing user experience and expanding the application scope of Phone PTZs. Consumer behavior shifts towards more dynamic and engaging visual storytelling are also fueling demand. The penetration of advanced smartphone cameras, capable of 8K recording, necessitates complementary stabilization solutions to unlock their full potential, thereby driving the growth of the Phone PTZ market. Emerging applications in virtual and augmented reality content creation are also poised to contribute significantly to future market expansion.
Dominant Regions, Countries, or Segments in Phone PTZ
The Asia Pacific region is emerging as a dominant force in the global Phone PTZ market, primarily driven by the massive smartphone user base in countries like China and India, coupled with a thriving ecosystem of content creators and e-commerce platforms. The Android Phone segment is expected to lead this dominance, accounting for over 65% of the market share by 2025, owing to its widespread adoption across a broad spectrum of price points and device capabilities. Within the Types segment, Triaxial gimbals are leading the charge, representing approximately 70% of the market by 2025. This is attributed to their superior stabilization capabilities, offering smoother footage and enhanced creative control, essential for professional-grade mobile videography.
Key drivers for this regional and segmental dominance include:
- Economic Policies: Favorable government initiatives promoting digital content creation and e-commerce in emerging economies within Asia Pacific.
- Infrastructure: Widespread availability of high-speed internet and mobile networks enabling seamless content sharing and consumption.
- Manufacturing Prowess: Asia Pacific's robust manufacturing capabilities allow for cost-effective production, making Phone PTZ devices more accessible.
- Growing Creator Economy: A burgeoning population of social media influencers and content creators actively seeking tools to enhance their video production quality.
- Technological Adoption: Rapid adoption of advanced mobile technologies and a willingness to invest in accessories that elevate mobile content.
- IOS Phone Segment Growth: While Android leads, the iOS Phone segment is also witnessing significant growth, driven by the premium user base and Apple's ecosystem integration.
- Single Axis Growth: While Triaxial dominates, Single Axis PTZs cater to a more budget-conscious segment and specific use cases, ensuring continued market presence.
The market share of the Asia Pacific region is projected to exceed 40% by 2025, with a projected CAGR of 13.2% during the forecast period. The Android Phone segment's market value is estimated to reach $2.6 billion in 2025, with Triaxial gimbals contributing a significant portion to the overall market value.
Phone PTZ Product Landscape
The Phone PTZ product landscape is characterized by a relentless pursuit of innovation, focusing on enhanced stabilization algorithms, compact and lightweight designs, and intelligent features. Manufacturers are integrating advanced AI for object tracking, facial recognition, and intelligent scene framing, allowing users to capture professional-quality shots effortlessly. Performance metrics like stabilization accuracy (e.g., ±0.01° jitter), battery life (e.g., 10-15 hours of continuous use), and payload capacity (e.g., up to 300 grams for smartphones) are key differentiators. Unique selling propositions include gesture control, built-in LED lighting, modular accessories for extended functionality, and seamless integration with mobile editing applications. Technological advancements are geared towards making these devices more intuitive and accessible to a wider audience, blurring the lines between amateur and professional mobile filmmaking.
Key Drivers, Barriers & Challenges in Phone PTZ
Key Drivers:
- Explosion of Mobile Content Creation: The ever-increasing demand for high-quality video content on social media platforms and video-sharing sites.
- Advancements in Smartphone Cameras: Powerful built-in cameras in smartphones necessitate advanced stabilization solutions.
- Technological Innovation: Continuous development of AI-powered features, improved stabilization technology, and more compact designs.
- Growth of the Creator Economy: A booming segment of individuals and businesses relying on video content for income and engagement.
Key Barriers & Challenges:
- Price Sensitivity: While demand is high, a segment of the market remains price-sensitive, impacting adoption of premium models.
- Technological Obsolescence: Rapid advancements can quickly render older models less competitive.
- Supply Chain Disruptions: Global supply chain issues can impact production and availability.
- Competition from Integrated Solutions: Advancements in smartphone stabilization software may reduce the need for external hardware for some users.
- Learning Curve: While improving, some advanced features may still present a learning curve for novice users. The estimated impact of supply chain disruptions on market growth in the short term is approximately 3-5%.
Emerging Opportunities in Phone PTZ
Emerging opportunities lie in the integration of Phone PTZs with emerging technologies like 5G and AIoT (Artificial Intelligence of Things). This could unlock new use cases in live streaming, remote surveillance, and augmented reality experiences. The enterprise segment, particularly for applications in field service, inspections, and security, represents a significant untapped market. Furthermore, the development of specialized Phone PTZs tailored for specific niches, such as vlogging with specific camera angles or underwater videography, presents a growth avenue. Evolving consumer preferences for cinematic-style mobile videos also create opportunities for manufacturers to offer more sophisticated, yet user-friendly, stabilization solutions.
Growth Accelerators in the Phone PTZ Industry
Key catalysts driving long-term growth in the Phone PTZ industry include continued miniaturization and power efficiency improvements, making devices more portable and enabling longer operation times. Strategic partnerships between Phone PTZ manufacturers and smartphone companies can accelerate integration and co-development of innovative features. Furthermore, market expansion into developing economies with growing digital literacy and content creation aspirations will be crucial. The increasing adoption of virtual production techniques utilizing mobile devices will also serve as a significant growth accelerator, demanding advanced stabilization for immersive content creation.
Key Players Shaping the Phone PTZ Market
- DJI
- Zhiyun
- Hohem Tech
- Gudsen MOZA
- FeiyuTech
- SIRUI
- HUAWEI
Notable Milestones in Phone PTZ Sector
- 2019: Introduction of advanced AI object tracking capabilities in select models, enhancing user experience.
- 2020: Increased focus on compact and foldable designs, improving portability.
- 2021: Enhanced battery life and faster charging technologies become standard features.
- 2022: Integration of advanced stabilization algorithms offering near-zero jitter.
- 2023: Emergence of smart gesture control and automated shooting modes.
- 2024: Increased adoption of USB-C connectivity and wider compatibility with iOS and Android devices.
In-Depth Phone PTZ Market Outlook
The future outlook for the Phone PTZ market is exceptionally bright, fueled by the sustained growth of the mobile content creation ecosystem and relentless technological advancements. Growth accelerators such as enhanced AI integration for smarter shooting, continued miniaturization for ultimate portability, and strategic alliances with smartphone manufacturers will propel the market forward. Strategic opportunities exist in catering to the burgeoning enterprise sector with specialized solutions and expanding into nascent markets with tailored product offerings. The market is poised for continued innovation, offering enhanced user experiences and unlocking new creative possibilities for mobile videographers worldwide.
Phone PTZ Segmentation
-
1. Application
- 1.1. IOS Phone
- 1.2. Andriod Phone
-
2. Types
- 2.1. Single Axis
- 2.2. Triaxial
Phone PTZ Segmentation By Geography
-
1. North America
- 1.1. United States
- 1.2. Canada
- 1.3. Mexico
-
2. South America
- 2.1. Brazil
- 2.2. Argentina
- 2.3. Rest of South America
-
3. Europe
- 3.1. United Kingdom
- 3.2. Germany
- 3.3. France
- 3.4. Italy
- 3.5. Spain
- 3.6. Russia
- 3.7. Benelux
- 3.8. Nordics
- 3.9. Rest of Europe
-
4. Middle East & Africa
- 4.1. Turkey
- 4.2. Israel
- 4.3. GCC
- 4.4. North Africa
- 4.5. South Africa
- 4.6. Rest of Middle East & Africa
-
5. Asia Pacific
- 5.1. China
- 5.2. India
- 5.3. Japan
- 5.4. South Korea
- 5.5. ASEAN
- 5.6. Oceania
- 5.7. Rest of Asia Pacific
Phone PTZ Regional Market Share
Geographic Coverage of Phone PTZ
Phone PTZ REPORT HIGHLIGHTS
| Aspects | Details |
|---|---|
| Study Period | 2020-2034 |
| Base Year | 2025 |
| Estimated Year | 2026 |
| Forecast Period | 2026-2034 |
| Historical Period | 2020-2025 |
| Growth Rate | CAGR of 15% from 2020-2034 |
| Segmentation |
|
Table of Contents
- 1. Introduction
- 1.1. Research Scope
- 1.2. Market Segmentation
- 1.3. Research Objective
- 1.4. Definitions and Assumptions
- 2. Executive Summary
- 2.1. Market Snapshot
- 3. Market Dynamics
- 3.1. Market Drivers
- 3.2. Market Restrains
- 3.3. Market Trends
- 3.4. Market Opportunities
- 4. Market Factor Analysis
- 4.1. Porters Five Forces
- 4.1.1. Bargaining Power of Suppliers
- 4.1.2. Bargaining Power of Buyers
- 4.1.3. Threat of New Entrants
- 4.1.4. Threat of Substitutes
- 4.1.5. Competitive Rivalry
- 4.2. PESTEL analysis
- 4.3. BCG Analysis
- 4.3.1. Stars (High Growth, High Market Share)
- 4.3.2. Cash Cows (Low Growth, High Market Share)
- 4.3.3. Question Mark (High Growth, Low Market Share)
- 4.3.4. Dogs (Low Growth, Low Market Share)
- 4.4. Ansoff Matrix Analysis
- 4.5. Supply Chain Analysis
- 4.6. Regulatory Landscape
- 4.7. Current Market Potential and Opportunity Assessment (TAM–SAM–SOM Framework)
- 4.8. IMR Analyst Note
- 4.1. Porters Five Forces
- 5. Market Analysis, Insights and Forecast 2021-2033
- 5.1. Market Analysis, Insights and Forecast - by Application
- 5.1.1. IOS Phone
- 5.1.2. Andriod Phone
- 5.2. Market Analysis, Insights and Forecast - by Types
- 5.2.1. Single Axis
- 5.2.2. Triaxial
- 5.3. Market Analysis, Insights and Forecast - by Region
- 5.3.1. North America
- 5.3.2. South America
- 5.3.3. Europe
- 5.3.4. Middle East & Africa
- 5.3.5. Asia Pacific
- 5.1. Market Analysis, Insights and Forecast - by Application
- 6. Global Phone PTZ Analysis, Insights and Forecast, 2021-2033
- 6.1. Market Analysis, Insights and Forecast - by Application
- 6.1.1. IOS Phone
- 6.1.2. Andriod Phone
- 6.2. Market Analysis, Insights and Forecast - by Types
- 6.2.1. Single Axis
- 6.2.2. Triaxial
- 6.1. Market Analysis, Insights and Forecast - by Application
- 7. North America Phone PTZ Analysis, Insights and Forecast, 2020-2032
- 7.1. Market Analysis, Insights and Forecast - by Application
- 7.1.1. IOS Phone
- 7.1.2. Andriod Phone
- 7.2. Market Analysis, Insights and Forecast - by Types
- 7.2.1. Single Axis
- 7.2.2. Triaxial
- 7.1. Market Analysis, Insights and Forecast - by Application
- 8. South America Phone PTZ Analysis, Insights and Forecast, 2020-2032
- 8.1. Market Analysis, Insights and Forecast - by Application
- 8.1.1. IOS Phone
- 8.1.2. Andriod Phone
- 8.2. Market Analysis, Insights and Forecast - by Types
- 8.2.1. Single Axis
- 8.2.2. Triaxial
- 8.1. Market Analysis, Insights and Forecast - by Application
- 9. Europe Phone PTZ Analysis, Insights and Forecast, 2020-2032
- 9.1. Market Analysis, Insights and Forecast - by Application
- 9.1.1. IOS Phone
- 9.1.2. Andriod Phone
- 9.2. Market Analysis, Insights and Forecast - by Types
- 9.2.1. Single Axis
- 9.2.2. Triaxial
- 9.1. Market Analysis, Insights and Forecast - by Application
- 10. Middle East & Africa Phone PTZ Analysis, Insights and Forecast, 2020-2032
- 10.1. Market Analysis, Insights and Forecast - by Application
- 10.1.1. IOS Phone
- 10.1.2. Andriod Phone
- 10.2. Market Analysis, Insights and Forecast - by Types
- 10.2.1. Single Axis
- 10.2.2. Triaxial
- 10.1. Market Analysis, Insights and Forecast - by Application
- 11. Asia Pacific Phone PTZ Analysis, Insights and Forecast, 2020-2032
- 11.1. Market Analysis, Insights and Forecast - by Application
- 11.1.1. IOS Phone
- 11.1.2. Andriod Phone
- 11.2. Market Analysis, Insights and Forecast - by Types
- 11.2.1. Single Axis
- 11.2.2. Triaxial
- 11.1. Market Analysis, Insights and Forecast - by Application
- 12. Competitive Analysis
- 12.1. Company Profiles
- 12.1.1 DJI
- 12.1.1.1. Company Overview
- 12.1.1.2. Products
- 12.1.1.3. Company Financials
- 12.1.1.4. SWOT Analysis
- 12.1.2 Zhiyun
- 12.1.2.1. Company Overview
- 12.1.2.2. Products
- 12.1.2.3. Company Financials
- 12.1.2.4. SWOT Analysis
- 12.1.3 Hohem Tech
- 12.1.3.1. Company Overview
- 12.1.3.2. Products
- 12.1.3.3. Company Financials
- 12.1.3.4. SWOT Analysis
- 12.1.4 Gudsen MOZA
- 12.1.4.1. Company Overview
- 12.1.4.2. Products
- 12.1.4.3. Company Financials
- 12.1.4.4. SWOT Analysis
- 12.1.5 FeiyuTech
- 12.1.5.1. Company Overview
- 12.1.5.2. Products
- 12.1.5.3. Company Financials
- 12.1.5.4. SWOT Analysis
- 12.1.6 SIRUI
- 12.1.6.1. Company Overview
- 12.1.6.2. Products
- 12.1.6.3. Company Financials
- 12.1.6.4. SWOT Analysis
- 12.1.7 HUAWEI
- 12.1.7.1. Company Overview
- 12.1.7.2. Products
- 12.1.7.3. Company Financials
- 12.1.7.4. SWOT Analysis
- 12.1.1 DJI
- 12.2. Market Entropy
- 12.2.1 Company's Key Areas Served
- 12.2.2 Recent Developments
- 12.3. Company Market Share Analysis 2025
- 12.3.1 Top 5 Companies Market Share Analysis
- 12.3.2 Top 3 Companies Market Share Analysis
- 12.4. List of Potential Customers
- 13. Research Methodology
List of Figures
- Figure 1: Global Phone PTZ Revenue Breakdown (billion, %) by Region 2025 & 2033
- Figure 2: Global Phone PTZ Volume Breakdown (K, %) by Region 2025 & 2033
- Figure 3: North America Phone PTZ Revenue (billion), by Application 2025 & 2033
- Figure 4: North America Phone PTZ Volume (K), by Application 2025 & 2033
- Figure 5: North America Phone PTZ Revenue Share (%), by Application 2025 & 2033
- Figure 6: North America Phone PTZ Volume Share (%), by Application 2025 & 2033
- Figure 7: North America Phone PTZ Revenue (billion), by Types 2025 & 2033
- Figure 8: North America Phone PTZ Volume (K), by Types 2025 & 2033
- Figure 9: North America Phone PTZ Revenue Share (%), by Types 2025 & 2033
- Figure 10: North America Phone PTZ Volume Share (%), by Types 2025 & 2033
- Figure 11: North America Phone PTZ Revenue (billion), by Country 2025 & 2033
- Figure 12: North America Phone PTZ Volume (K), by Country 2025 & 2033
- Figure 13: North America Phone PTZ Revenue Share (%), by Country 2025 & 2033
- Figure 14: North America Phone PTZ Volume Share (%), by Country 2025 & 2033
- Figure 15: South America Phone PTZ Revenue (billion), by Application 2025 & 2033
- Figure 16: South America Phone PTZ Volume (K), by Application 2025 & 2033
- Figure 17: South America Phone PTZ Revenue Share (%), by Application 2025 & 2033
- Figure 18: South America Phone PTZ Volume Share (%), by Application 2025 & 2033
- Figure 19: South America Phone PTZ Revenue (billion), by Types 2025 & 2033
- Figure 20: South America Phone PTZ Volume (K), by Types 2025 & 2033
- Figure 21: South America Phone PTZ Revenue Share (%), by Types 2025 & 2033
- Figure 22: South America Phone PTZ Volume Share (%), by Types 2025 & 2033
- Figure 23: South America Phone PTZ Revenue (billion), by Country 2025 & 2033
- Figure 24: South America Phone PTZ Volume (K), by Country 2025 & 2033
- Figure 25: South America Phone PTZ Revenue Share (%), by Country 2025 & 2033
- Figure 26: South America Phone PTZ Volume Share (%), by Country 2025 & 2033
- Figure 27: Europe Phone PTZ Revenue (billion), by Application 2025 & 2033
- Figure 28: Europe Phone PTZ Volume (K), by Application 2025 & 2033
- Figure 29: Europe Phone PTZ Revenue Share (%), by Application 2025 & 2033
- Figure 30: Europe Phone PTZ Volume Share (%), by Application 2025 & 2033
- Figure 31: Europe Phone PTZ Revenue (billion), by Types 2025 & 2033
- Figure 32: Europe Phone PTZ Volume (K), by Types 2025 & 2033
- Figure 33: Europe Phone PTZ Revenue Share (%), by Types 2025 & 2033
- Figure 34: Europe Phone PTZ Volume Share (%), by Types 2025 & 2033
- Figure 35: Europe Phone PTZ Revenue (billion), by Country 2025 & 2033
- Figure 36: Europe Phone PTZ Volume (K), by Country 2025 & 2033
- Figure 37: Europe Phone PTZ Revenue Share (%), by Country 2025 & 2033
- Figure 38: Europe Phone PTZ Volume Share (%), by Country 2025 & 2033
- Figure 39: Middle East & Africa Phone PTZ Revenue (billion), by Application 2025 & 2033
- Figure 40: Middle East & Africa Phone PTZ Volume (K), by Application 2025 & 2033
- Figure 41: Middle East & Africa Phone PTZ Revenue Share (%), by Application 2025 & 2033
- Figure 42: Middle East & Africa Phone PTZ Volume Share (%), by Application 2025 & 2033
- Figure 43: Middle East & Africa Phone PTZ Revenue (billion), by Types 2025 & 2033
- Figure 44: Middle East & Africa Phone PTZ Volume (K), by Types 2025 & 2033
- Figure 45: Middle East & Africa Phone PTZ Revenue Share (%), by Types 2025 & 2033
- Figure 46: Middle East & Africa Phone PTZ Volume Share (%), by Types 2025 & 2033
- Figure 47: Middle East & Africa Phone PTZ Revenue (billion), by Country 2025 & 2033
- Figure 48: Middle East & Africa Phone PTZ Volume (K), by Country 2025 & 2033
- Figure 49: Middle East & Africa Phone PTZ Revenue Share (%), by Country 2025 & 2033
- Figure 50: Middle East & Africa Phone PTZ Volume Share (%), by Country 2025 & 2033
- Figure 51: Asia Pacific Phone PTZ Revenue (billion), by Application 2025 & 2033
- Figure 52: Asia Pacific Phone PTZ Volume (K), by Application 2025 & 2033
- Figure 53: Asia Pacific Phone PTZ Revenue Share (%), by Application 2025 & 2033
- Figure 54: Asia Pacific Phone PTZ Volume Share (%), by Application 2025 & 2033
- Figure 55: Asia Pacific Phone PTZ Revenue (billion), by Types 2025 & 2033
- Figure 56: Asia Pacific Phone PTZ Volume (K), by Types 2025 & 2033
- Figure 57: Asia Pacific Phone PTZ Revenue Share (%), by Types 2025 & 2033
- Figure 58: Asia Pacific Phone PTZ Volume Share (%), by Types 2025 & 2033
- Figure 59: Asia Pacific Phone PTZ Revenue (billion), by Country 2025 & 2033
- Figure 60: Asia Pacific Phone PTZ Volume (K), by Country 2025 & 2033
- Figure 61: Asia Pacific Phone PTZ Revenue Share (%), by Country 2025 & 2033
- Figure 62: Asia Pacific Phone PTZ Volume Share (%), by Country 2025 & 2033
List of Tables
- Table 1: Global Phone PTZ Revenue billion Forecast, by Application 2020 & 2033
- Table 2: Global Phone PTZ Volume K Forecast, by Application 2020 & 2033
- Table 3: Global Phone PTZ Revenue billion Forecast, by Types 2020 & 2033
- Table 4: Global Phone PTZ Volume K Forecast, by Types 2020 & 2033
- Table 5: Global Phone PTZ Revenue billion Forecast, by Region 2020 & 2033
- Table 6: Global Phone PTZ Volume K Forecast, by Region 2020 & 2033
- Table 7: Global Phone PTZ Revenue billion Forecast, by Application 2020 & 2033
- Table 8: Global Phone PTZ Volume K Forecast, by Application 2020 & 2033
- Table 9: Global Phone PTZ Revenue billion Forecast, by Types 2020 & 2033
- Table 10: Global Phone PTZ Volume K Forecast, by Types 2020 & 2033
- Table 11: Global Phone PTZ Revenue billion Forecast, by Country 2020 & 2033
- Table 12: Global Phone PTZ Volume K Forecast, by Country 2020 & 2033
- Table 13: United States Phone PTZ Revenue (billion) Forecast, by Application 2020 & 2033
- Table 14: United States Phone PTZ Volume (K) Forecast, by Application 2020 & 2033
- Table 15: Canada Phone PTZ Revenue (billion) Forecast, by Application 2020 & 2033
- Table 16: Canada Phone PTZ Volume (K) Forecast, by Application 2020 & 2033
- Table 17: Mexico Phone PTZ Revenue (billion) Forecast, by Application 2020 & 2033
- Table 18: Mexico Phone PTZ Volume (K) Forecast, by Application 2020 & 2033
- Table 19: Global Phone PTZ Revenue billion Forecast, by Application 2020 & 2033
- Table 20: Global Phone PTZ Volume K Forecast, by Application 2020 & 2033
- Table 21: Global Phone PTZ Revenue billion Forecast, by Types 2020 & 2033
- Table 22: Global Phone PTZ Volume K Forecast, by Types 2020 & 2033
- Table 23: Global Phone PTZ Revenue billion Forecast, by Country 2020 & 2033
- Table 24: Global Phone PTZ Volume K Forecast, by Country 2020 & 2033
- Table 25: Brazil Phone PTZ Revenue (billion) Forecast, by Application 2020 & 2033
- Table 26: Brazil Phone PTZ Volume (K) Forecast, by Application 2020 & 2033
- Table 27: Argentina Phone PTZ Revenue (billion) Forecast, by Application 2020 & 2033
- Table 28: Argentina Phone PTZ Volume (K) Forecast, by Application 2020 & 2033
- Table 29: Rest of South America Phone PTZ Revenue (billion) Forecast, by Application 2020 & 2033
- Table 30: Rest of South America Phone PTZ Volume (K) Forecast, by Application 2020 & 2033
- Table 31: Global Phone PTZ Revenue billion Forecast, by Application 2020 & 2033
- Table 32: Global Phone PTZ Volume K Forecast, by Application 2020 & 2033
- Table 33: Global Phone PTZ Revenue billion Forecast, by Types 2020 & 2033
- Table 34: Global Phone PTZ Volume K Forecast, by Types 2020 & 2033
- Table 35: Global Phone PTZ Revenue billion Forecast, by Country 2020 & 2033
- Table 36: Global Phone PTZ Volume K Forecast, by Country 2020 & 2033
- Table 37: United Kingdom Phone PTZ Revenue (billion) Forecast, by Application 2020 & 2033
- Table 38: United Kingdom Phone PTZ Volume (K) Forecast, by Application 2020 & 2033
- Table 39: Germany Phone PTZ Revenue (billion) Forecast, by Application 2020 & 2033
- Table 40: Germany Phone PTZ Volume (K) Forecast, by Application 2020 & 2033
- Table 41: France Phone PTZ Revenue (billion) Forecast, by Application 2020 & 2033
- Table 42: France Phone PTZ Volume (K) Forecast, by Application 2020 & 2033
- Table 43: Italy Phone PTZ Revenue (billion) Forecast, by Application 2020 & 2033
- Table 44: Italy Phone PTZ Volume (K) Forecast, by Application 2020 & 2033
- Table 45: Spain Phone PTZ Revenue (billion) Forecast, by Application 2020 & 2033
- Table 46: Spain Phone PTZ Volume (K) Forecast, by Application 2020 & 2033
- Table 47: Russia Phone PTZ Revenue (billion) Forecast, by Application 2020 & 2033
- Table 48: Russia Phone PTZ Volume (K) Forecast, by Application 2020 & 2033
- Table 49: Benelux Phone PTZ Revenue (billion) Forecast, by Application 2020 & 2033
- Table 50: Benelux Phone PTZ Volume (K) Forecast, by Application 2020 & 2033
- Table 51: Nordics Phone PTZ Revenue (billion) Forecast, by Application 2020 & 2033
- Table 52: Nordics Phone PTZ Volume (K) Forecast, by Application 2020 & 2033
- Table 53: Rest of Europe Phone PTZ Revenue (billion) Forecast, by Application 2020 & 2033
- Table 54: Rest of Europe Phone PTZ Volume (K) Forecast, by Application 2020 & 2033
- Table 55: Global Phone PTZ Revenue billion Forecast, by Application 2020 & 2033
- Table 56: Global Phone PTZ Volume K Forecast, by Application 2020 & 2033
- Table 57: Global Phone PTZ Revenue billion Forecast, by Types 2020 & 2033
- Table 58: Global Phone PTZ Volume K Forecast, by Types 2020 & 2033
- Table 59: Global Phone PTZ Revenue billion Forecast, by Country 2020 & 2033
- Table 60: Global Phone PTZ Volume K Forecast, by Country 2020 & 2033
- Table 61: Turkey Phone PTZ Revenue (billion) Forecast, by Application 2020 & 2033
- Table 62: Turkey Phone PTZ Volume (K) Forecast, by Application 2020 & 2033
- Table 63: Israel Phone PTZ Revenue (billion) Forecast, by Application 2020 & 2033
- Table 64: Israel Phone PTZ Volume (K) Forecast, by Application 2020 & 2033
- Table 65: GCC Phone PTZ Revenue (billion) Forecast, by Application 2020 & 2033
- Table 66: GCC Phone PTZ Volume (K) Forecast, by Application 2020 & 2033
- Table 67: North Africa Phone PTZ Revenue (billion) Forecast, by Application 2020 & 2033
- Table 68: North Africa Phone PTZ Volume (K) Forecast, by Application 2020 & 2033
- Table 69: South Africa Phone PTZ Revenue (billion) Forecast, by Application 2020 & 2033
- Table 70: South Africa Phone PTZ Volume (K) Forecast, by Application 2020 & 2033
- Table 71: Rest of Middle East & Africa Phone PTZ Revenue (billion) Forecast, by Application 2020 & 2033
- Table 72: Rest of Middle East & Africa Phone PTZ Volume (K) Forecast, by Application 2020 & 2033
- Table 73: Global Phone PTZ Revenue billion Forecast, by Application 2020 & 2033
- Table 74: Global Phone PTZ Volume K Forecast, by Application 2020 & 2033
- Table 75: Global Phone PTZ Revenue billion Forecast, by Types 2020 & 2033
- Table 76: Global Phone PTZ Volume K Forecast, by Types 2020 & 2033
- Table 77: Global Phone PTZ Revenue billion Forecast, by Country 2020 & 2033
- Table 78: Global Phone PTZ Volume K Forecast, by Country 2020 & 2033
- Table 79: China Phone PTZ Revenue (billion) Forecast, by Application 2020 & 2033
- Table 80: China Phone PTZ Volume (K) Forecast, by Application 2020 & 2033
- Table 81: India Phone PTZ Revenue (billion) Forecast, by Application 2020 & 2033
- Table 82: India Phone PTZ Volume (K) Forecast, by Application 2020 & 2033
- Table 83: Japan Phone PTZ Revenue (billion) Forecast, by Application 2020 & 2033
- Table 84: Japan Phone PTZ Volume (K) Forecast, by Application 2020 & 2033
- Table 85: South Korea Phone PTZ Revenue (billion) Forecast, by Application 2020 & 2033
- Table 86: South Korea Phone PTZ Volume (K) Forecast, by Application 2020 & 2033
- Table 87: ASEAN Phone PTZ Revenue (billion) Forecast, by Application 2020 & 2033
- Table 88: ASEAN Phone PTZ Volume (K) Forecast, by Application 2020 & 2033
- Table 89: Oceania Phone PTZ Revenue (billion) Forecast, by Application 2020 & 2033
- Table 90: Oceania Phone PTZ Volume (K) Forecast, by Application 2020 & 2033
- Table 91: Rest of Asia Pacific Phone PTZ Revenue (billion) Forecast, by Application 2020 & 2033
- Table 92: Rest of Asia Pacific Phone PTZ Volume (K) Forecast, by Application 2020 & 2033
Frequently Asked Questions
1. What is the projected Compound Annual Growth Rate (CAGR) of the Phone PTZ?
The projected CAGR is approximately 15%.
2. Which companies are prominent players in the Phone PTZ?
Key companies in the market include DJI, Zhiyun, Hohem Tech, Gudsen MOZA, FeiyuTech, SIRUI, HUAWEI.
3. What are the main segments of the Phone PTZ?
The market segments include Application, Types.
4. Can you provide details about the market size?
The market size is estimated to be USD 2.5 billion as of 2022.
5. What are some drivers contributing to market growth?
N/A
6. What are the notable trends driving market growth?
N/A
7. Are there any restraints impacting market growth?
N/A
8. Can you provide examples of recent developments in the market?
N/A
9. What pricing options are available for accessing the report?
Pricing options include single-user, multi-user, and enterprise licenses priced at USD 3950.00, USD 5925.00, and USD 7900.00 respectively.
10. Is the market size provided in terms of value or volume?
The market size is provided in terms of value, measured in billion and volume, measured in K.
11. Are there any specific market keywords associated with the report?
Yes, the market keyword associated with the report is "Phone PTZ," which aids in identifying and referencing the specific market segment covered.
12. How do I determine which pricing option suits my needs best?
The pricing options vary based on user requirements and access needs. Individual users may opt for single-user licenses, while businesses requiring broader access may choose multi-user or enterprise licenses for cost-effective access to the report.
13. Are there any additional resources or data provided in the Phone PTZ report?
While the report offers comprehensive insights, it's advisable to review the specific contents or supplementary materials provided to ascertain if additional resources or data are available.
14. How can I stay updated on further developments or reports in the Phone PTZ?
To stay informed about further developments, trends, and reports in the Phone PTZ, consider subscribing to industry newsletters, following relevant companies and organizations, or regularly checking reputable industry news sources and publications.
Methodology
Step 1 - Identification of Relevant Samples Size from Population Database


Step 2 - Approaches for Defining Global Market Size (Value, Volume* & Price*)

Note*: In applicable scenarios
Step 3 - Data Sources
Primary Research
- Web Analytics
- Survey Reports
- Research Institute
- Latest Research Reports
- Opinion Leaders
Secondary Research
- Annual Reports
- White Paper
- Latest Press Release
- Industry Association
- Paid Database
- Investor Presentations

Step 4 - Data Triangulation
Involves using different sources of information in order to increase the validity of a study
These sources are likely to be stakeholders in a program - participants, other researchers, program staff, other community members, and so on.
Then we put all data in single framework & apply various statistical tools to find out the dynamic on the market.
During the analysis stage, feedback from the stakeholder groups would be compared to determine areas of agreement as well as areas of divergence