

Key Insights
The global power meters for cycling market is poised for robust expansion, projected to reach $437 million by 2025, driven by an anticipated 5.1% CAGR. This growth trajectory is largely fueled by the increasing adoption of performance-enhancing technology among both professional athletes and dedicated cycling enthusiasts. Cyclists are increasingly recognizing the tangible benefits of power meter data for optimizing training regimens, preventing overtraining, and achieving peak performance. The market is witnessing a pronounced shift towards more sophisticated and user-friendly power meter solutions, including advanced crank-based and pedal-based systems that offer greater accuracy and ease of installation. Furthermore, the growing popularity of cycling as a recreational activity and a competitive sport, coupled with rising disposable incomes, especially in emerging economies, are significant contributors to this market's upward momentum. The integration of power meters with smart training platforms and cycling computers further enhances their appeal, providing a seamless and data-rich experience for riders.
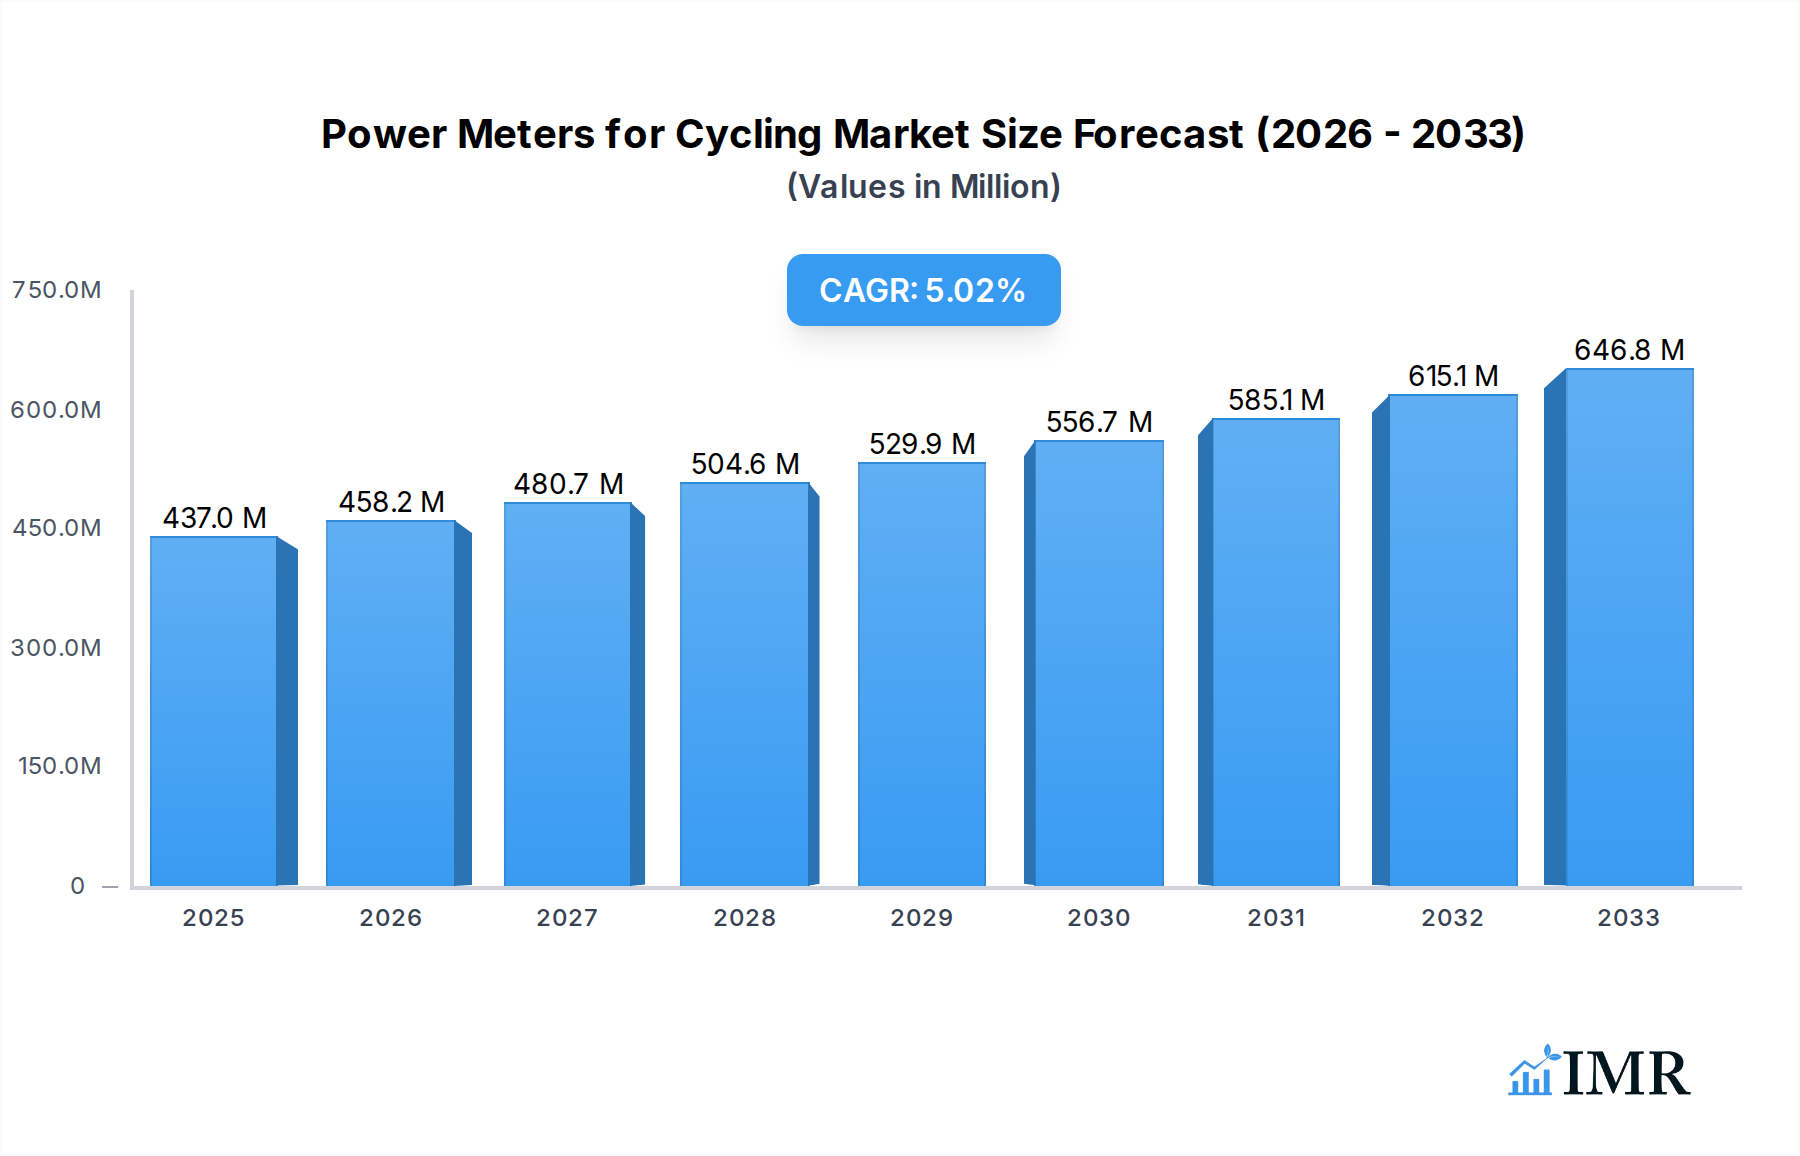
Power Meters for Cycling Market Size (In Million)
The competitive landscape is dynamic, featuring established players like Garmin, Stages Cycling, and Quarq, alongside innovative entrants focusing on specific market niches and advanced technologies. The market is segmented across various applications, including road bikes and mountain bikes, with a growing demand for versatile "other" applications catering to diverse cycling disciplines. Trends such as the miniaturization of sensors, improved battery life, and enhanced connectivity through Bluetooth and ANT+ are shaping product development. While the market shows strong growth potential, certain restraints, such as the relatively high cost of advanced power meters for some consumer segments and the need for ongoing technological innovation to stay ahead of competitors, will need to be addressed. However, the continuous pursuit of marginal gains in cycling performance and the expanding ecosystem of cycling-related technologies are expected to propel the power meters for cycling market forward.

Power Meters for Cycling Company Market Share
Power Meters for Cycling Market Dynamics & Structure
The global power meters for cycling market is characterized by a moderate concentration, with key players like SRM (Schoberer Rad Messtechnik), Quarq (SRAM), and Stages Cycling holding significant market share. Technological innovation is a primary driver, fueled by advancements in sensor accuracy, data analytics, and ANT+/Bluetooth connectivity, enabling cyclists to optimize training and performance. Regulatory frameworks are generally supportive, with a focus on product safety and data privacy, though some regions may introduce specific certification requirements. Competitive product substitutes include heart rate monitors and GPS devices, but power meters offer unparalleled precision in measuring rider output. End-user demographics span professional athletes, serious amateurs, and a growing segment of fitness enthusiasts seeking data-driven training. Merger and acquisition (M&A) trends are expected to continue as larger entities acquire innovative startups to expand their product portfolios and market reach. For instance, approximately 10-15 M&A deals were observed between 2019-2024, indicating consolidation. Innovation barriers primarily revolve around the high cost of R&D, manufacturing complexities, and the need for continuous software updates to support evolving training methodologies.
- Market Concentration: Moderate, with top players holding a combined ~60-70% market share.
- Technological Innovation Drivers: Enhanced sensor accuracy (e.g., strain gauges, accelerometers), improved data processing algorithms, seamless connectivity (ANT+, Bluetooth), and integration with cycling computers and apps.
- Regulatory Frameworks: Generally favorable, focusing on product standards and data security.
- Competitive Product Substitutes: Heart rate monitors, GPS devices, perceived exertion metrics.
- End-User Demographics: Professional cyclists, amateur athletes, fitness enthusiasts, triathletes.
- M&A Trends: Anticipated to continue, driven by market consolidation and technology acquisition.
Power Meters for Cycling Growth Trends & Insights
The power meters for cycling market is poised for robust growth, driven by increasing awareness of data-driven training methodologies and the democratization of advanced performance tracking technology. The global power meters for cycling market size was valued at approximately $550 million in 2024 and is projected to reach over $1,200 million by 2033, exhibiting a Compound Annual Growth Rate (CAGR) of approximately 9.5% during the forecast period of 2025–2033. This expansion is propelled by several key factors. Firstly, the adoption rate among amateur cyclists has significantly increased, moving power meters from a professional-only tool to a more accessible performance enhancer. This shift is facilitated by more affordable price points and a wider variety of product types.
Technological disruptions are continuously reshaping the market. The evolution from solely crank-based systems to more versatile spider-mounted and pedal-based power meters has broadened consumer choice and improved ease of installation. Furthermore, the integration of power meters with advanced analytics platforms and AI-powered coaching apps provides actionable insights that were previously unavailable to the average cyclist. This has led to a paradigm shift in how training is approached, with a greater emphasis on precise power output measurement for targeted improvements.
Consumer behavior is also evolving. Cyclists are becoming more data-literate and are actively seeking tools that can help them understand their physiological responses to training stimuli. The desire to quantify effort, track progress accurately, and prevent overtraining is a significant motivator for purchasing power meters. This is further amplified by the growing popularity of cycling as a sport and a fitness activity, leading to a larger potential customer base. The market penetration of power meters, while still growing, is steadily increasing, particularly in developed regions where disposable income and a culture of performance enhancement are prevalent. The development of more compact, lightweight, and battery-efficient power meters is also contributing to wider adoption, addressing previous concerns about bulkiness and maintenance.
Dominant Regions, Countries, or Segments in Power Meters for Cycling
The Road Bikes segment, within the Application category, is a dominant force driving growth in the global power meters for cycling market. This dominance is underpinned by several interconnected factors, including the professional cycling circuit, the sheer volume of road cycling enthusiasts worldwide, and the inherent need for precise performance metrics in road racing and endurance events. Road cycling, with its emphasis on speed, efficiency, and sustained power output, makes power measurement an indispensable tool for athletes seeking to optimize their aerodynamics, pacing strategies, and overall performance. The market share of road bikes in the power meter segment is estimated to be around 55-60% of the total market value.
- Dominant Segment: Road Bikes (Application)
- Market Share: Approximately 55-60% of the total power meter market value.
- Growth Potential: High, driven by professional racing, large amateur base, and demand for performance optimization.
Within the Types of power meters, Crank-based Power Meters continue to hold a significant market share, estimated at 45-50%, due to their established reliability, accuracy, and wide compatibility across various bicycle models. However, Pedal Power Meters are experiencing the most rapid growth, projected to capture a substantial portion of the market share in the coming years, with an estimated CAGR of over 12%. This surge is attributed to their ease of installation, transferability between bikes, and increasingly competitive pricing. The market for pedal power meters is projected to reach approximately $300 million by 2033.
- Dominant Type (Historically): Crank-based Power Meters (Market Share: ~45-50%)
- Fastest Growing Type: Pedal Power Meters (Projected Market Share Growth: High, CAGR >12%)
- Key Drivers for Pedal Power Meters: Ease of use, transferability, falling prices, and improved accuracy.
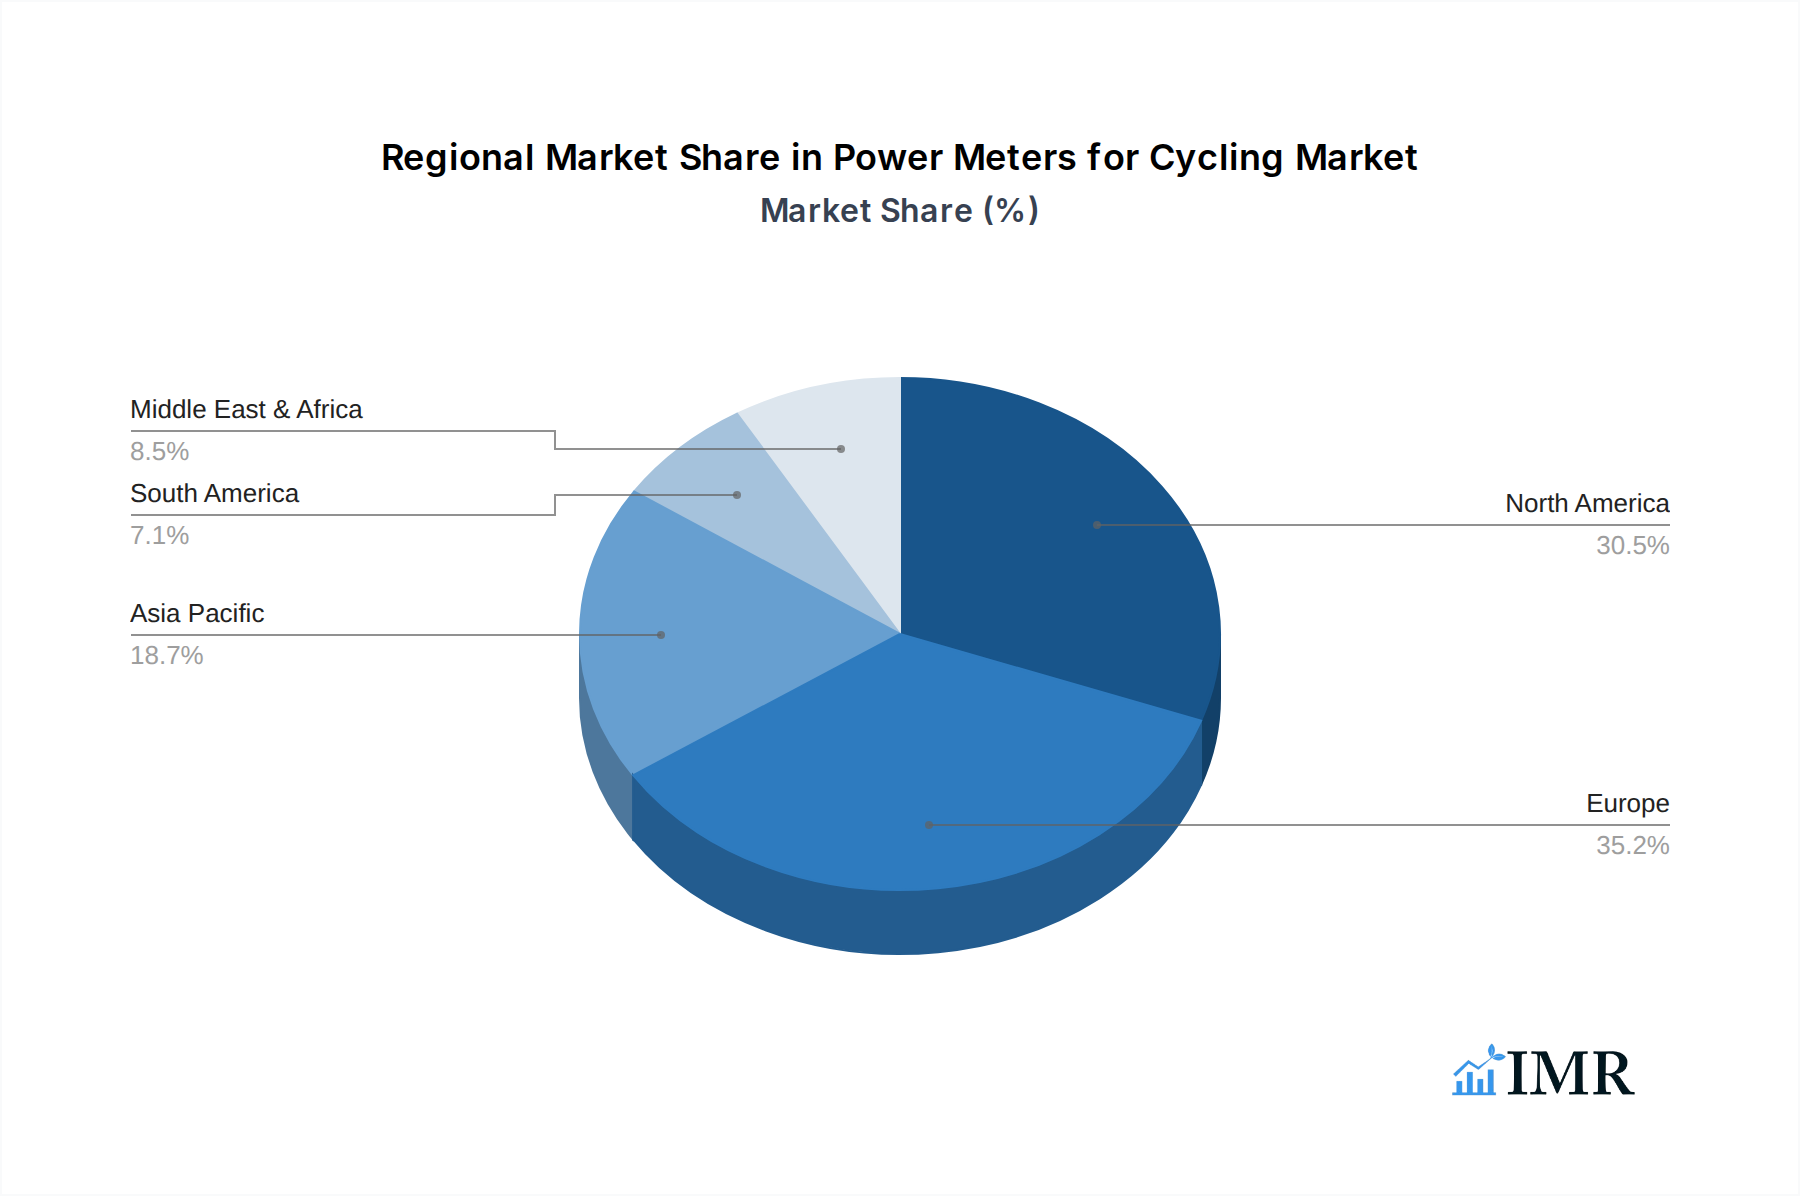
Geographically, North America currently leads the power meters for cycling market, driven by a mature cycling culture, high disposable incomes, and a strong presence of professional and amateur cycling events. The United States, in particular, is a key market, with a substantial number of cyclists actively investing in performance-enhancing technology. Europe, especially countries like the UK, France, and Italy, follows closely, owing to a rich heritage in professional cycling and a growing segment of health-conscious individuals. Asia-Pacific is emerging as a significant growth region, with increasing disposable incomes, a burgeoning cycling community, and rising interest in fitness and outdoor activities.
- Leading Region: North America (with the USA as a key country)
- Second Leading Region: Europe (UK, France, Italy prominent)
- Emerging Growth Region: Asia-Pacific
- Key Drivers for Regional Dominance: Cycling culture, disposable income, event presence, health awareness.
Power Meters for Cycling Product Landscape
The power meters for cycling product landscape is defined by continuous innovation, offering cyclists precise and actionable performance data. Innovations focus on enhanced accuracy through advanced sensor technology (e.g., strain gauges, accelerometers) and improved algorithms for real-time power output measurement. Applications span across road bikes, mountain bikes, and other cycling disciplines, providing critical insights for training optimization, race strategy, and injury prevention. Performance metrics are increasingly sophisticated, with features like cadence measurement, left/right leg power balance, and integrated temperature compensation. Unique selling propositions often revolve around lightweight designs, long battery life, ANT+/Bluetooth connectivity for seamless integration with head units and apps, and user-friendly installation. Technological advancements are also leading to more robust and weatherproof designs, catering to diverse riding conditions.
Key Drivers, Barriers & Challenges in Power Meters for Cycling
Key Drivers:
- Growing Demand for Data-Driven Training: Cyclists at all levels are increasingly recognizing the benefits of quantifying effort to optimize performance and prevent overtraining.
- Technological Advancements: Continuous improvements in sensor accuracy, data processing, and wireless connectivity enhance usability and value.
- Increased Accessibility and Affordability: The introduction of more cost-effective models and a wider variety of power meter types (e.g., pedal-based) are broadening the market.
- Rise of Cycling as a Fitness and Lifestyle Activity: A growing global participation in cycling for health and recreation fuels the demand for performance-enhancing tools.
- Professional Cycling Influence: The widespread use of power meters by professional athletes sets a benchmark and inspires amateur adoption.
Key Barriers & Challenges:
- High Initial Cost: Despite price reductions, power meters can still represent a significant investment for many consumers, limiting market penetration in price-sensitive segments. For example, the average price point for a quality power meter can range from $400 to $1000+, impacting adoption in emerging markets.
- Complexity of Installation and Calibration: Some power meter types can be challenging to install and require precise calibration, deterring less mechanically inclined users.
- Data Overload and Interpretation: For novice users, the sheer volume of data generated can be overwhelming, requiring education and accessible interpretation tools.
- Battery Life and Maintenance: While improving, battery life remains a concern for some users, and occasional recalibration or maintenance may be required.
- Supply Chain Disruptions: Global events can impact the availability of components and the timely delivery of finished products, potentially affecting market growth and pricing.
Emerging Opportunities in Power Meters for Cycling
Emerging opportunities in the power meters for cycling market lie in the expansion of smart training ecosystems and the development of more accessible and integrated solutions. The growing trend of direct-to-consumer (DTC) sales channels offers a pathway to reach a wider audience and potentially reduce costs. Innovations in AI-powered coaching platforms that leverage power meter data to provide personalized training plans are a significant growth area. Furthermore, the integration of power meters into entry-level cycling computers and even directly into bicycle frames presents an opportunity to lower the barrier to entry for new users. There's also a growing demand for power meters specifically designed for niche cycling segments like gravel riding and e-bikes, requiring specialized features and durability.
Growth Accelerators in the Power Meters for Cycling Industry
Several catalysts are accelerating long-term growth in the power meters for cycling industry. Technological breakthroughs in miniaturization and power efficiency are enabling the development of lighter, more integrated, and longer-lasting power meter systems. Strategic partnerships between power meter manufacturers and cycling computer brands, as well as fitness app developers, are creating seamless user experiences and expanding the reach of these devices. Market expansion strategies focusing on emerging economies, where cycling participation is rapidly growing, will be crucial for sustained growth. The increasing focus on sports science research and its validation of power-based training will continue to drive demand and justify the investment in these advanced tools.
Key Players Shaping the Power Meters for Cycling Market
- SRM (Schoberer Rad Messtechnik)
- Quarq (SRAM)
- Stages Cycling
- Garmin
- Favero Electronics
- 4iiii Innovations
- Power2Max
- Rotor Bike Components
- Easton Cycling
- Wahoo Fitness
- Shimano
- Verve
- Velocomp
- Magene
- iQsquare
- Pioneer
Notable Milestones in Power Meters for Cycling Sector
- 2019: SRM releases its updated SRM PC-D (Duo) power meter, enhancing accuracy and connectivity.
- 2020: Quarq introduces its DZero Power Meter, offering improved durability and wider crank compatibility.
- 2021: Stages Cycling launches the Stages SB20 smart bike, integrating its power meter technology into a complete indoor training solution.
- 2022: Favero Electronics expands its Assioma pedal-based power meter line with new models offering enhanced features and wider cleat compatibility.
- 2023: Garmin integrates its Rally power meter pedals into its broader cycling ecosystem, emphasizing seamless data flow with its head units and software.
- 2024: 4iiii Innovations continues to innovate with its modular power meter designs, making them more accessible and adaptable for various cranksets.
In-Depth Power Meters for Cycling Market Outlook
The in-depth market outlook for power meters for cycling is highly optimistic, driven by an unyielding commitment to performance optimization and the increasing integration of smart technology into the cycling experience. Growth accelerators, including ongoing technological innovation in sensor accuracy and power efficiency, coupled with strategic market expansion into burgeoning regions, are set to fuel sustained expansion. The development of more user-friendly interfaces and the deep integration of power data into AI-driven coaching platforms will further democratize advanced training, making power meters an indispensable tool for a broader spectrum of cyclists. The future promises not only more accurate and reliable devices but also a more holistic understanding of rider performance, solidifying power meters as a cornerstone of modern cycling.
Power Meters for Cycling Segmentation
-
1. Application
- 1.1. Road Bikes
- 1.2. Mountain Bikes
- 1.3. Others
-
2. Types
- 2.1. Crank-based Power Meters
- 2.2. Apider-mounted Power Meters
- 2.3. Pedal Power Meters
Power Meters for Cycling Segmentation By Geography
-
1. North America
- 1.1. United States
- 1.2. Canada
- 1.3. Mexico
-
2. South America
- 2.1. Brazil
- 2.2. Argentina
- 2.3. Rest of South America
-
3. Europe
- 3.1. United Kingdom
- 3.2. Germany
- 3.3. France
- 3.4. Italy
- 3.5. Spain
- 3.6. Russia
- 3.7. Benelux
- 3.8. Nordics
- 3.9. Rest of Europe
-
4. Middle East & Africa
- 4.1. Turkey
- 4.2. Israel
- 4.3. GCC
- 4.4. North Africa
- 4.5. South Africa
- 4.6. Rest of Middle East & Africa
-
5. Asia Pacific
- 5.1. China
- 5.2. India
- 5.3. Japan
- 5.4. South Korea
- 5.5. ASEAN
- 5.6. Oceania
- 5.7. Rest of Asia Pacific
Power Meters for Cycling Regional Market Share
Geographic Coverage of Power Meters for Cycling
Power Meters for Cycling REPORT HIGHLIGHTS
| Aspects | Details |
|---|---|
| Study Period | 2020-2034 |
| Base Year | 2025 |
| Estimated Year | 2026 |
| Forecast Period | 2026-2034 |
| Historical Period | 2020-2025 |
| Growth Rate | CAGR of 5.1% from 2020-2034 |
| Segmentation |
|
Table of Contents
- 1. Introduction
- 1.1. Research Scope
- 1.2. Market Segmentation
- 1.3. Research Objective
- 1.4. Definitions and Assumptions
- 2. Executive Summary
- 2.1. Market Snapshot
- 3. Market Dynamics
- 3.1. Market Drivers
- 3.2. Market Restrains
- 3.3. Market Trends
- 3.4. Market Opportunities
- 4. Market Factor Analysis
- 4.1. Porters Five Forces
- 4.1.1. Bargaining Power of Suppliers
- 4.1.2. Bargaining Power of Buyers
- 4.1.3. Threat of New Entrants
- 4.1.4. Threat of Substitutes
- 4.1.5. Competitive Rivalry
- 4.2. PESTEL analysis
- 4.3. BCG Analysis
- 4.3.1. Stars (High Growth, High Market Share)
- 4.3.2. Cash Cows (Low Growth, High Market Share)
- 4.3.3. Question Mark (High Growth, Low Market Share)
- 4.3.4. Dogs (Low Growth, Low Market Share)
- 4.4. Ansoff Matrix Analysis
- 4.5. Supply Chain Analysis
- 4.6. Regulatory Landscape
- 4.7. Current Market Potential and Opportunity Assessment (TAM–SAM–SOM Framework)
- 4.8. IMR Analyst Note
- 4.1. Porters Five Forces
- 5. Market Analysis, Insights and Forecast 2021-2033
- 5.1. Market Analysis, Insights and Forecast - by Application
- 5.1.1. Road Bikes
- 5.1.2. Mountain Bikes
- 5.1.3. Others
- 5.2. Market Analysis, Insights and Forecast - by Types
- 5.2.1. Crank-based Power Meters
- 5.2.2. Apider-mounted Power Meters
- 5.2.3. Pedal Power Meters
- 5.3. Market Analysis, Insights and Forecast - by Region
- 5.3.1. North America
- 5.3.2. South America
- 5.3.3. Europe
- 5.3.4. Middle East & Africa
- 5.3.5. Asia Pacific
- 5.1. Market Analysis, Insights and Forecast - by Application
- 6. Global Power Meters for Cycling Analysis, Insights and Forecast, 2021-2033
- 6.1. Market Analysis, Insights and Forecast - by Application
- 6.1.1. Road Bikes
- 6.1.2. Mountain Bikes
- 6.1.3. Others
- 6.2. Market Analysis, Insights and Forecast - by Types
- 6.2.1. Crank-based Power Meters
- 6.2.2. Apider-mounted Power Meters
- 6.2.3. Pedal Power Meters
- 6.1. Market Analysis, Insights and Forecast - by Application
- 7. North America Power Meters for Cycling Analysis, Insights and Forecast, 2020-2032
- 7.1. Market Analysis, Insights and Forecast - by Application
- 7.1.1. Road Bikes
- 7.1.2. Mountain Bikes
- 7.1.3. Others
- 7.2. Market Analysis, Insights and Forecast - by Types
- 7.2.1. Crank-based Power Meters
- 7.2.2. Apider-mounted Power Meters
- 7.2.3. Pedal Power Meters
- 7.1. Market Analysis, Insights and Forecast - by Application
- 8. South America Power Meters for Cycling Analysis, Insights and Forecast, 2020-2032
- 8.1. Market Analysis, Insights and Forecast - by Application
- 8.1.1. Road Bikes
- 8.1.2. Mountain Bikes
- 8.1.3. Others
- 8.2. Market Analysis, Insights and Forecast - by Types
- 8.2.1. Crank-based Power Meters
- 8.2.2. Apider-mounted Power Meters
- 8.2.3. Pedal Power Meters
- 8.1. Market Analysis, Insights and Forecast - by Application
- 9. Europe Power Meters for Cycling Analysis, Insights and Forecast, 2020-2032
- 9.1. Market Analysis, Insights and Forecast - by Application
- 9.1.1. Road Bikes
- 9.1.2. Mountain Bikes
- 9.1.3. Others
- 9.2. Market Analysis, Insights and Forecast - by Types
- 9.2.1. Crank-based Power Meters
- 9.2.2. Apider-mounted Power Meters
- 9.2.3. Pedal Power Meters
- 9.1. Market Analysis, Insights and Forecast - by Application
- 10. Middle East & Africa Power Meters for Cycling Analysis, Insights and Forecast, 2020-2032
- 10.1. Market Analysis, Insights and Forecast - by Application
- 10.1.1. Road Bikes
- 10.1.2. Mountain Bikes
- 10.1.3. Others
- 10.2. Market Analysis, Insights and Forecast - by Types
- 10.2.1. Crank-based Power Meters
- 10.2.2. Apider-mounted Power Meters
- 10.2.3. Pedal Power Meters
- 10.1. Market Analysis, Insights and Forecast - by Application
- 11. Asia Pacific Power Meters for Cycling Analysis, Insights and Forecast, 2020-2032
- 11.1. Market Analysis, Insights and Forecast - by Application
- 11.1.1. Road Bikes
- 11.1.2. Mountain Bikes
- 11.1.3. Others
- 11.2. Market Analysis, Insights and Forecast - by Types
- 11.2.1. Crank-based Power Meters
- 11.2.2. Apider-mounted Power Meters
- 11.2.3. Pedal Power Meters
- 11.1. Market Analysis, Insights and Forecast - by Application
- 12. Competitive Analysis
- 12.1. Company Profiles
- 12.1.1 SRM (Schoberer Rad Messtechnik)
- 12.1.1.1. Company Overview
- 12.1.1.2. Products
- 12.1.1.3. Company Financials
- 12.1.1.4. SWOT Analysis
- 12.1.2 Quarq (SRAM)
- 12.1.2.1. Company Overview
- 12.1.2.2. Products
- 12.1.2.3. Company Financials
- 12.1.2.4. SWOT Analysis
- 12.1.3 Stages Cycling
- 12.1.3.1. Company Overview
- 12.1.3.2. Products
- 12.1.3.3. Company Financials
- 12.1.3.4. SWOT Analysis
- 12.1.4 Garmin
- 12.1.4.1. Company Overview
- 12.1.4.2. Products
- 12.1.4.3. Company Financials
- 12.1.4.4. SWOT Analysis
- 12.1.5 Favero Electronics
- 12.1.5.1. Company Overview
- 12.1.5.2. Products
- 12.1.5.3. Company Financials
- 12.1.5.4. SWOT Analysis
- 12.1.6 4iiii Innovations
- 12.1.6.1. Company Overview
- 12.1.6.2. Products
- 12.1.6.3. Company Financials
- 12.1.6.4. SWOT Analysis
- 12.1.7 Power2Max
- 12.1.7.1. Company Overview
- 12.1.7.2. Products
- 12.1.7.3. Company Financials
- 12.1.7.4. SWOT Analysis
- 12.1.8 Rotor Bike Components
- 12.1.8.1. Company Overview
- 12.1.8.2. Products
- 12.1.8.3. Company Financials
- 12.1.8.4. SWOT Analysis
- 12.1.9 Easton Cycling
- 12.1.9.1. Company Overview
- 12.1.9.2. Products
- 12.1.9.3. Company Financials
- 12.1.9.4. SWOT Analysis
- 12.1.10 Wahoo Fitness
- 12.1.10.1. Company Overview
- 12.1.10.2. Products
- 12.1.10.3. Company Financials
- 12.1.10.4. SWOT Analysis
- 12.1.11 Shimano
- 12.1.11.1. Company Overview
- 12.1.11.2. Products
- 12.1.11.3. Company Financials
- 12.1.11.4. SWOT Analysis
- 12.1.12 Verve
- 12.1.12.1. Company Overview
- 12.1.12.2. Products
- 12.1.12.3. Company Financials
- 12.1.12.4. SWOT Analysis
- 12.1.13 Velocomp
- 12.1.13.1. Company Overview
- 12.1.13.2. Products
- 12.1.13.3. Company Financials
- 12.1.13.4. SWOT Analysis
- 12.1.14 Magene
- 12.1.14.1. Company Overview
- 12.1.14.2. Products
- 12.1.14.3. Company Financials
- 12.1.14.4. SWOT Analysis
- 12.1.15 iQsquare
- 12.1.15.1. Company Overview
- 12.1.15.2. Products
- 12.1.15.3. Company Financials
- 12.1.15.4. SWOT Analysis
- 12.1.16 Pioneer
- 12.1.16.1. Company Overview
- 12.1.16.2. Products
- 12.1.16.3. Company Financials
- 12.1.16.4. SWOT Analysis
- 12.1.1 SRM (Schoberer Rad Messtechnik)
- 12.2. Market Entropy
- 12.2.1 Company's Key Areas Served
- 12.2.2 Recent Developments
- 12.3. Company Market Share Analysis 2025
- 12.3.1 Top 5 Companies Market Share Analysis
- 12.3.2 Top 3 Companies Market Share Analysis
- 12.4. List of Potential Customers
- 13. Research Methodology
List of Figures
- Figure 1: Global Power Meters for Cycling Revenue Breakdown (undefined, %) by Region 2025 & 2033
- Figure 2: Global Power Meters for Cycling Volume Breakdown (K, %) by Region 2025 & 2033
- Figure 3: North America Power Meters for Cycling Revenue (undefined), by Application 2025 & 2033
- Figure 4: North America Power Meters for Cycling Volume (K), by Application 2025 & 2033
- Figure 5: North America Power Meters for Cycling Revenue Share (%), by Application 2025 & 2033
- Figure 6: North America Power Meters for Cycling Volume Share (%), by Application 2025 & 2033
- Figure 7: North America Power Meters for Cycling Revenue (undefined), by Types 2025 & 2033
- Figure 8: North America Power Meters for Cycling Volume (K), by Types 2025 & 2033
- Figure 9: North America Power Meters for Cycling Revenue Share (%), by Types 2025 & 2033
- Figure 10: North America Power Meters for Cycling Volume Share (%), by Types 2025 & 2033
- Figure 11: North America Power Meters for Cycling Revenue (undefined), by Country 2025 & 2033
- Figure 12: North America Power Meters for Cycling Volume (K), by Country 2025 & 2033
- Figure 13: North America Power Meters for Cycling Revenue Share (%), by Country 2025 & 2033
- Figure 14: North America Power Meters for Cycling Volume Share (%), by Country 2025 & 2033
- Figure 15: South America Power Meters for Cycling Revenue (undefined), by Application 2025 & 2033
- Figure 16: South America Power Meters for Cycling Volume (K), by Application 2025 & 2033
- Figure 17: South America Power Meters for Cycling Revenue Share (%), by Application 2025 & 2033
- Figure 18: South America Power Meters for Cycling Volume Share (%), by Application 2025 & 2033
- Figure 19: South America Power Meters for Cycling Revenue (undefined), by Types 2025 & 2033
- Figure 20: South America Power Meters for Cycling Volume (K), by Types 2025 & 2033
- Figure 21: South America Power Meters for Cycling Revenue Share (%), by Types 2025 & 2033
- Figure 22: South America Power Meters for Cycling Volume Share (%), by Types 2025 & 2033
- Figure 23: South America Power Meters for Cycling Revenue (undefined), by Country 2025 & 2033
- Figure 24: South America Power Meters for Cycling Volume (K), by Country 2025 & 2033
- Figure 25: South America Power Meters for Cycling Revenue Share (%), by Country 2025 & 2033
- Figure 26: South America Power Meters for Cycling Volume Share (%), by Country 2025 & 2033
- Figure 27: Europe Power Meters for Cycling Revenue (undefined), by Application 2025 & 2033
- Figure 28: Europe Power Meters for Cycling Volume (K), by Application 2025 & 2033
- Figure 29: Europe Power Meters for Cycling Revenue Share (%), by Application 2025 & 2033
- Figure 30: Europe Power Meters for Cycling Volume Share (%), by Application 2025 & 2033
- Figure 31: Europe Power Meters for Cycling Revenue (undefined), by Types 2025 & 2033
- Figure 32: Europe Power Meters for Cycling Volume (K), by Types 2025 & 2033
- Figure 33: Europe Power Meters for Cycling Revenue Share (%), by Types 2025 & 2033
- Figure 34: Europe Power Meters for Cycling Volume Share (%), by Types 2025 & 2033
- Figure 35: Europe Power Meters for Cycling Revenue (undefined), by Country 2025 & 2033
- Figure 36: Europe Power Meters for Cycling Volume (K), by Country 2025 & 2033
- Figure 37: Europe Power Meters for Cycling Revenue Share (%), by Country 2025 & 2033
- Figure 38: Europe Power Meters for Cycling Volume Share (%), by Country 2025 & 2033
- Figure 39: Middle East & Africa Power Meters for Cycling Revenue (undefined), by Application 2025 & 2033
- Figure 40: Middle East & Africa Power Meters for Cycling Volume (K), by Application 2025 & 2033
- Figure 41: Middle East & Africa Power Meters for Cycling Revenue Share (%), by Application 2025 & 2033
- Figure 42: Middle East & Africa Power Meters for Cycling Volume Share (%), by Application 2025 & 2033
- Figure 43: Middle East & Africa Power Meters for Cycling Revenue (undefined), by Types 2025 & 2033
- Figure 44: Middle East & Africa Power Meters for Cycling Volume (K), by Types 2025 & 2033
- Figure 45: Middle East & Africa Power Meters for Cycling Revenue Share (%), by Types 2025 & 2033
- Figure 46: Middle East & Africa Power Meters for Cycling Volume Share (%), by Types 2025 & 2033
- Figure 47: Middle East & Africa Power Meters for Cycling Revenue (undefined), by Country 2025 & 2033
- Figure 48: Middle East & Africa Power Meters for Cycling Volume (K), by Country 2025 & 2033
- Figure 49: Middle East & Africa Power Meters for Cycling Revenue Share (%), by Country 2025 & 2033
- Figure 50: Middle East & Africa Power Meters for Cycling Volume Share (%), by Country 2025 & 2033
- Figure 51: Asia Pacific Power Meters for Cycling Revenue (undefined), by Application 2025 & 2033
- Figure 52: Asia Pacific Power Meters for Cycling Volume (K), by Application 2025 & 2033
- Figure 53: Asia Pacific Power Meters for Cycling Revenue Share (%), by Application 2025 & 2033
- Figure 54: Asia Pacific Power Meters for Cycling Volume Share (%), by Application 2025 & 2033
- Figure 55: Asia Pacific Power Meters for Cycling Revenue (undefined), by Types 2025 & 2033
- Figure 56: Asia Pacific Power Meters for Cycling Volume (K), by Types 2025 & 2033
- Figure 57: Asia Pacific Power Meters for Cycling Revenue Share (%), by Types 2025 & 2033
- Figure 58: Asia Pacific Power Meters for Cycling Volume Share (%), by Types 2025 & 2033
- Figure 59: Asia Pacific Power Meters for Cycling Revenue (undefined), by Country 2025 & 2033
- Figure 60: Asia Pacific Power Meters for Cycling Volume (K), by Country 2025 & 2033
- Figure 61: Asia Pacific Power Meters for Cycling Revenue Share (%), by Country 2025 & 2033
- Figure 62: Asia Pacific Power Meters for Cycling Volume Share (%), by Country 2025 & 2033
List of Tables
- Table 1: Global Power Meters for Cycling Revenue undefined Forecast, by Application 2020 & 2033
- Table 2: Global Power Meters for Cycling Volume K Forecast, by Application 2020 & 2033
- Table 3: Global Power Meters for Cycling Revenue undefined Forecast, by Types 2020 & 2033
- Table 4: Global Power Meters for Cycling Volume K Forecast, by Types 2020 & 2033
- Table 5: Global Power Meters for Cycling Revenue undefined Forecast, by Region 2020 & 2033
- Table 6: Global Power Meters for Cycling Volume K Forecast, by Region 2020 & 2033
- Table 7: Global Power Meters for Cycling Revenue undefined Forecast, by Application 2020 & 2033
- Table 8: Global Power Meters for Cycling Volume K Forecast, by Application 2020 & 2033
- Table 9: Global Power Meters for Cycling Revenue undefined Forecast, by Types 2020 & 2033
- Table 10: Global Power Meters for Cycling Volume K Forecast, by Types 2020 & 2033
- Table 11: Global Power Meters for Cycling Revenue undefined Forecast, by Country 2020 & 2033
- Table 12: Global Power Meters for Cycling Volume K Forecast, by Country 2020 & 2033
- Table 13: United States Power Meters for Cycling Revenue (undefined) Forecast, by Application 2020 & 2033
- Table 14: United States Power Meters for Cycling Volume (K) Forecast, by Application 2020 & 2033
- Table 15: Canada Power Meters for Cycling Revenue (undefined) Forecast, by Application 2020 & 2033
- Table 16: Canada Power Meters for Cycling Volume (K) Forecast, by Application 2020 & 2033
- Table 17: Mexico Power Meters for Cycling Revenue (undefined) Forecast, by Application 2020 & 2033
- Table 18: Mexico Power Meters for Cycling Volume (K) Forecast, by Application 2020 & 2033
- Table 19: Global Power Meters for Cycling Revenue undefined Forecast, by Application 2020 & 2033
- Table 20: Global Power Meters for Cycling Volume K Forecast, by Application 2020 & 2033
- Table 21: Global Power Meters for Cycling Revenue undefined Forecast, by Types 2020 & 2033
- Table 22: Global Power Meters for Cycling Volume K Forecast, by Types 2020 & 2033
- Table 23: Global Power Meters for Cycling Revenue undefined Forecast, by Country 2020 & 2033
- Table 24: Global Power Meters for Cycling Volume K Forecast, by Country 2020 & 2033
- Table 25: Brazil Power Meters for Cycling Revenue (undefined) Forecast, by Application 2020 & 2033
- Table 26: Brazil Power Meters for Cycling Volume (K) Forecast, by Application 2020 & 2033
- Table 27: Argentina Power Meters for Cycling Revenue (undefined) Forecast, by Application 2020 & 2033
- Table 28: Argentina Power Meters for Cycling Volume (K) Forecast, by Application 2020 & 2033
- Table 29: Rest of South America Power Meters for Cycling Revenue (undefined) Forecast, by Application 2020 & 2033
- Table 30: Rest of South America Power Meters for Cycling Volume (K) Forecast, by Application 2020 & 2033
- Table 31: Global Power Meters for Cycling Revenue undefined Forecast, by Application 2020 & 2033
- Table 32: Global Power Meters for Cycling Volume K Forecast, by Application 2020 & 2033
- Table 33: Global Power Meters for Cycling Revenue undefined Forecast, by Types 2020 & 2033
- Table 34: Global Power Meters for Cycling Volume K Forecast, by Types 2020 & 2033
- Table 35: Global Power Meters for Cycling Revenue undefined Forecast, by Country 2020 & 2033
- Table 36: Global Power Meters for Cycling Volume K Forecast, by Country 2020 & 2033
- Table 37: United Kingdom Power Meters for Cycling Revenue (undefined) Forecast, by Application 2020 & 2033
- Table 38: United Kingdom Power Meters for Cycling Volume (K) Forecast, by Application 2020 & 2033
- Table 39: Germany Power Meters for Cycling Revenue (undefined) Forecast, by Application 2020 & 2033
- Table 40: Germany Power Meters for Cycling Volume (K) Forecast, by Application 2020 & 2033
- Table 41: France Power Meters for Cycling Revenue (undefined) Forecast, by Application 2020 & 2033
- Table 42: France Power Meters for Cycling Volume (K) Forecast, by Application 2020 & 2033
- Table 43: Italy Power Meters for Cycling Revenue (undefined) Forecast, by Application 2020 & 2033
- Table 44: Italy Power Meters for Cycling Volume (K) Forecast, by Application 2020 & 2033
- Table 45: Spain Power Meters for Cycling Revenue (undefined) Forecast, by Application 2020 & 2033
- Table 46: Spain Power Meters for Cycling Volume (K) Forecast, by Application 2020 & 2033
- Table 47: Russia Power Meters for Cycling Revenue (undefined) Forecast, by Application 2020 & 2033
- Table 48: Russia Power Meters for Cycling Volume (K) Forecast, by Application 2020 & 2033
- Table 49: Benelux Power Meters for Cycling Revenue (undefined) Forecast, by Application 2020 & 2033
- Table 50: Benelux Power Meters for Cycling Volume (K) Forecast, by Application 2020 & 2033
- Table 51: Nordics Power Meters for Cycling Revenue (undefined) Forecast, by Application 2020 & 2033
- Table 52: Nordics Power Meters for Cycling Volume (K) Forecast, by Application 2020 & 2033
- Table 53: Rest of Europe Power Meters for Cycling Revenue (undefined) Forecast, by Application 2020 & 2033
- Table 54: Rest of Europe Power Meters for Cycling Volume (K) Forecast, by Application 2020 & 2033
- Table 55: Global Power Meters for Cycling Revenue undefined Forecast, by Application 2020 & 2033
- Table 56: Global Power Meters for Cycling Volume K Forecast, by Application 2020 & 2033
- Table 57: Global Power Meters for Cycling Revenue undefined Forecast, by Types 2020 & 2033
- Table 58: Global Power Meters for Cycling Volume K Forecast, by Types 2020 & 2033
- Table 59: Global Power Meters for Cycling Revenue undefined Forecast, by Country 2020 & 2033
- Table 60: Global Power Meters for Cycling Volume K Forecast, by Country 2020 & 2033
- Table 61: Turkey Power Meters for Cycling Revenue (undefined) Forecast, by Application 2020 & 2033
- Table 62: Turkey Power Meters for Cycling Volume (K) Forecast, by Application 2020 & 2033
- Table 63: Israel Power Meters for Cycling Revenue (undefined) Forecast, by Application 2020 & 2033
- Table 64: Israel Power Meters for Cycling Volume (K) Forecast, by Application 2020 & 2033
- Table 65: GCC Power Meters for Cycling Revenue (undefined) Forecast, by Application 2020 & 2033
- Table 66: GCC Power Meters for Cycling Volume (K) Forecast, by Application 2020 & 2033
- Table 67: North Africa Power Meters for Cycling Revenue (undefined) Forecast, by Application 2020 & 2033
- Table 68: North Africa Power Meters for Cycling Volume (K) Forecast, by Application 2020 & 2033
- Table 69: South Africa Power Meters for Cycling Revenue (undefined) Forecast, by Application 2020 & 2033
- Table 70: South Africa Power Meters for Cycling Volume (K) Forecast, by Application 2020 & 2033
- Table 71: Rest of Middle East & Africa Power Meters for Cycling Revenue (undefined) Forecast, by Application 2020 & 2033
- Table 72: Rest of Middle East & Africa Power Meters for Cycling Volume (K) Forecast, by Application 2020 & 2033
- Table 73: Global Power Meters for Cycling Revenue undefined Forecast, by Application 2020 & 2033
- Table 74: Global Power Meters for Cycling Volume K Forecast, by Application 2020 & 2033
- Table 75: Global Power Meters for Cycling Revenue undefined Forecast, by Types 2020 & 2033
- Table 76: Global Power Meters for Cycling Volume K Forecast, by Types 2020 & 2033
- Table 77: Global Power Meters for Cycling Revenue undefined Forecast, by Country 2020 & 2033
- Table 78: Global Power Meters for Cycling Volume K Forecast, by Country 2020 & 2033
- Table 79: China Power Meters for Cycling Revenue (undefined) Forecast, by Application 2020 & 2033
- Table 80: China Power Meters for Cycling Volume (K) Forecast, by Application 2020 & 2033
- Table 81: India Power Meters for Cycling Revenue (undefined) Forecast, by Application 2020 & 2033
- Table 82: India Power Meters for Cycling Volume (K) Forecast, by Application 2020 & 2033
- Table 83: Japan Power Meters for Cycling Revenue (undefined) Forecast, by Application 2020 & 2033
- Table 84: Japan Power Meters for Cycling Volume (K) Forecast, by Application 2020 & 2033
- Table 85: South Korea Power Meters for Cycling Revenue (undefined) Forecast, by Application 2020 & 2033
- Table 86: South Korea Power Meters for Cycling Volume (K) Forecast, by Application 2020 & 2033
- Table 87: ASEAN Power Meters for Cycling Revenue (undefined) Forecast, by Application 2020 & 2033
- Table 88: ASEAN Power Meters for Cycling Volume (K) Forecast, by Application 2020 & 2033
- Table 89: Oceania Power Meters for Cycling Revenue (undefined) Forecast, by Application 2020 & 2033
- Table 90: Oceania Power Meters for Cycling Volume (K) Forecast, by Application 2020 & 2033
- Table 91: Rest of Asia Pacific Power Meters for Cycling Revenue (undefined) Forecast, by Application 2020 & 2033
- Table 92: Rest of Asia Pacific Power Meters for Cycling Volume (K) Forecast, by Application 2020 & 2033
Frequently Asked Questions
1. What is the projected Compound Annual Growth Rate (CAGR) of the Power Meters for Cycling?
The projected CAGR is approximately 5.1%.
2. Which companies are prominent players in the Power Meters for Cycling?
Key companies in the market include SRM (Schoberer Rad Messtechnik), Quarq (SRAM), Stages Cycling, Garmin, Favero Electronics, 4iiii Innovations, Power2Max, Rotor Bike Components, Easton Cycling, Wahoo Fitness, Shimano, Verve, Velocomp, Magene, iQsquare, Pioneer.
3. What are the main segments of the Power Meters for Cycling?
The market segments include Application, Types.
4. Can you provide details about the market size?
The market size is estimated to be USD XXX N/A as of 2022.
5. What are some drivers contributing to market growth?
N/A
6. What are the notable trends driving market growth?
N/A
7. Are there any restraints impacting market growth?
N/A
8. Can you provide examples of recent developments in the market?
N/A
9. What pricing options are available for accessing the report?
Pricing options include single-user, multi-user, and enterprise licenses priced at USD 3350.00, USD 5025.00, and USD 6700.00 respectively.
10. Is the market size provided in terms of value or volume?
The market size is provided in terms of value, measured in N/A and volume, measured in K.
11. Are there any specific market keywords associated with the report?
Yes, the market keyword associated with the report is "Power Meters for Cycling," which aids in identifying and referencing the specific market segment covered.
12. How do I determine which pricing option suits my needs best?
The pricing options vary based on user requirements and access needs. Individual users may opt for single-user licenses, while businesses requiring broader access may choose multi-user or enterprise licenses for cost-effective access to the report.
13. Are there any additional resources or data provided in the Power Meters for Cycling report?
While the report offers comprehensive insights, it's advisable to review the specific contents or supplementary materials provided to ascertain if additional resources or data are available.
14. How can I stay updated on further developments or reports in the Power Meters for Cycling?
To stay informed about further developments, trends, and reports in the Power Meters for Cycling, consider subscribing to industry newsletters, following relevant companies and organizations, or regularly checking reputable industry news sources and publications.
Methodology
Step 1 - Identification of Relevant Samples Size from Population Database


Step 2 - Approaches for Defining Global Market Size (Value, Volume* & Price*)

Note*: In applicable scenarios
Step 3 - Data Sources
Primary Research
- Web Analytics
- Survey Reports
- Research Institute
- Latest Research Reports
- Opinion Leaders
Secondary Research
- Annual Reports
- White Paper
- Latest Press Release
- Industry Association
- Paid Database
- Investor Presentations

Step 4 - Data Triangulation
Involves using different sources of information in order to increase the validity of a study
These sources are likely to be stakeholders in a program - participants, other researchers, program staff, other community members, and so on.
Then we put all data in single framework & apply various statistical tools to find out the dynamic on the market.
During the analysis stage, feedback from the stakeholder groups would be compared to determine areas of agreement as well as areas of divergence