

Key Insights
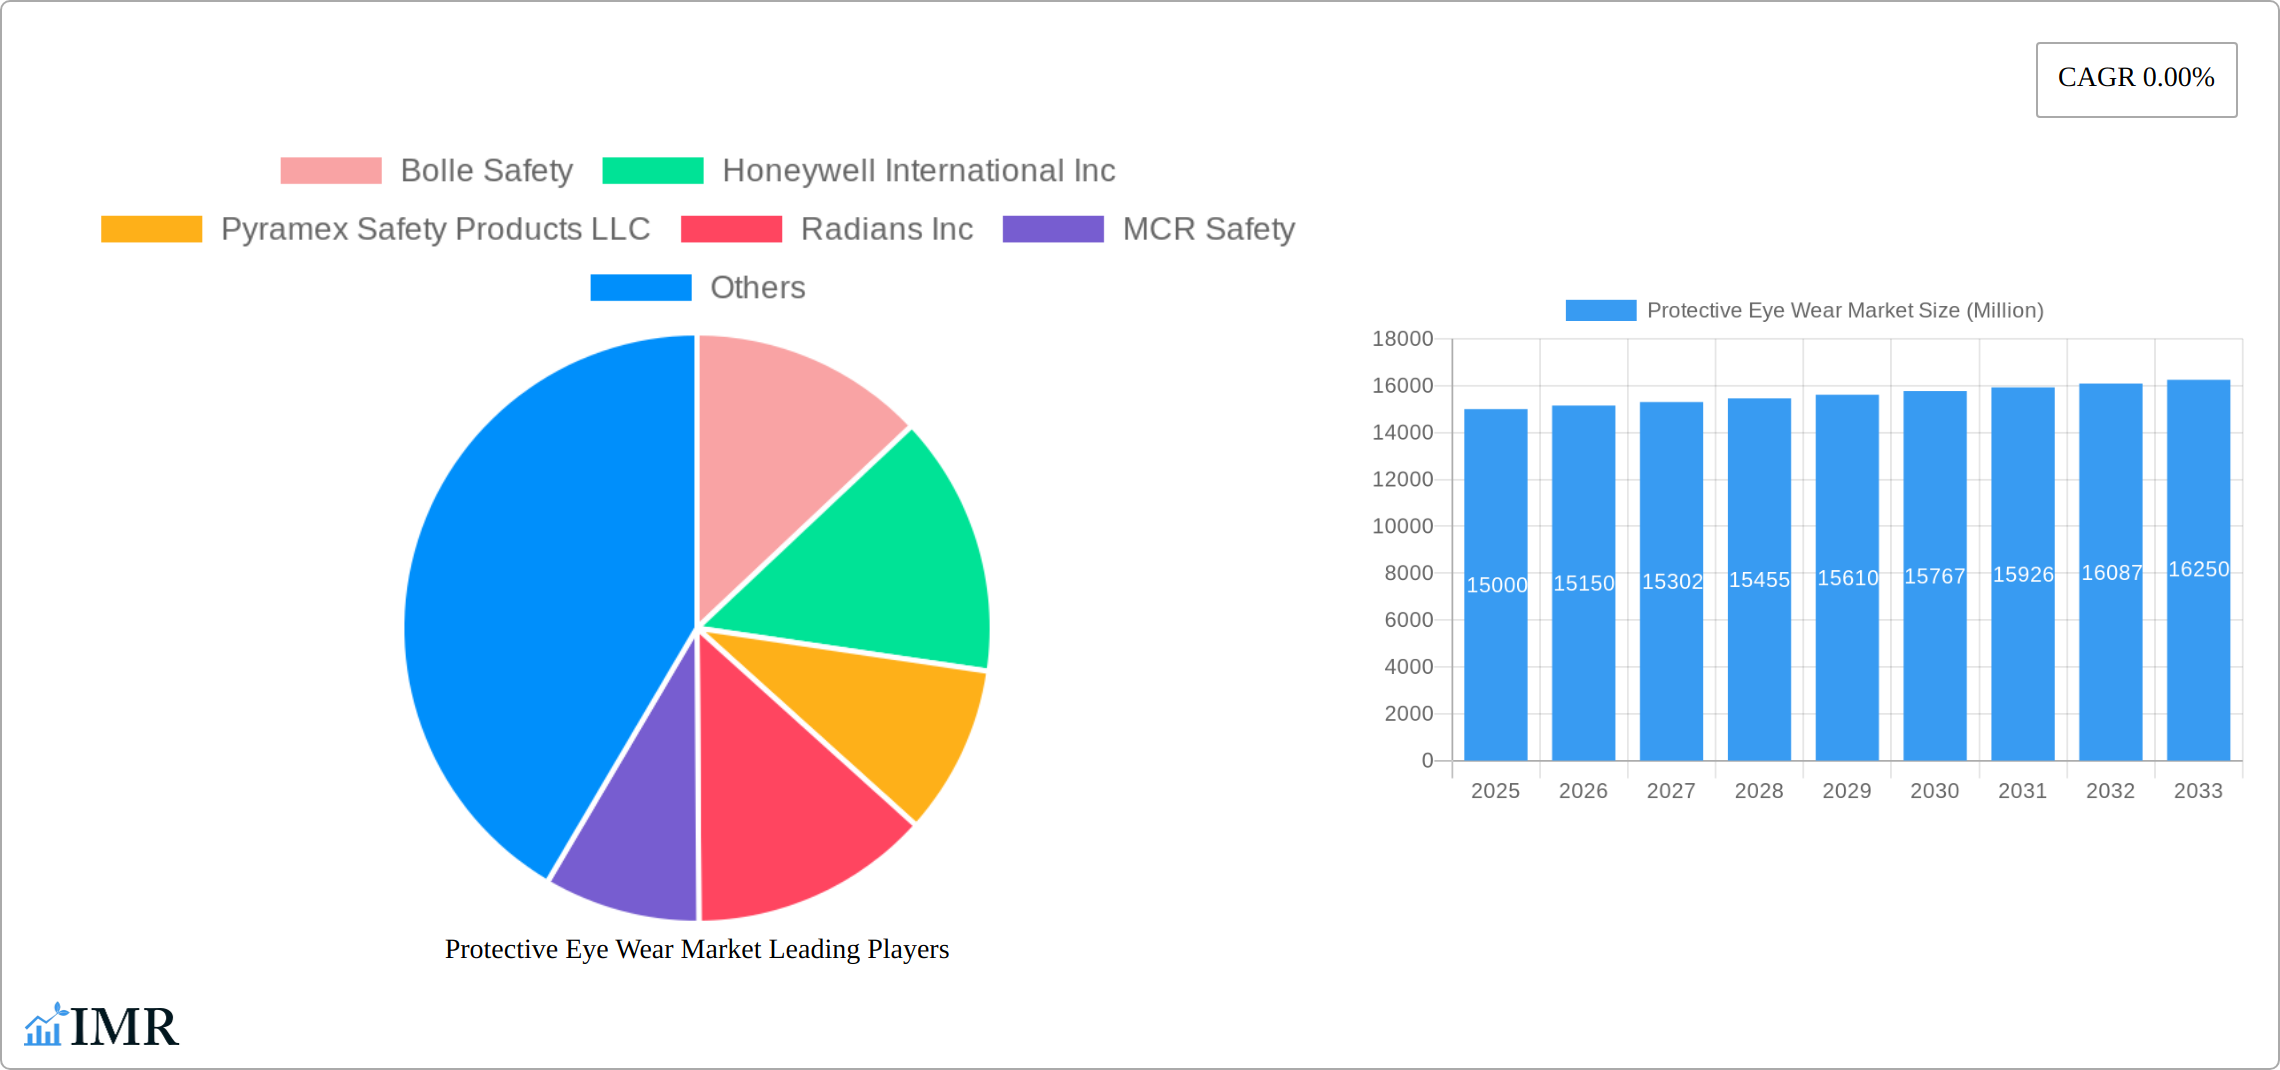
The global protective eyewear market, including spectacles, welding glasses, overspecs, and goggles, is a mature yet dynamic sector exhibiting consistent growth. This expansion is fueled by escalating industrialization and rigorous safety mandates across various end-user industries. Despite a reported historical CAGR of 4.54%, this period likely represents market maturation and consolidation prior to anticipated future acceleration. Key growth drivers include the increasing incidence of workplace eye injuries, particularly within construction and manufacturing sectors, alongside technological innovations in lens materials that enhance clarity, impact resistance, and UV protection. Demand for specialized eyewear, such as prescription integrated lenses and anti-fog coatings, is also growing to meet the specific requirements of professionals. The market is segmented by product type and end-user industry, with automotive, construction, and manufacturing sectors being significant contributors. Leading companies like Bolle Safety, Honeywell, and 3M are committed to continuous innovation and portfolio expansion to maintain competitive market positions. While North America and Europe currently dominate market share, the Asia-Pacific region is projected for substantial growth due to expanding industrial activities. The estimated market size for the base year 2025 is 4.38 billion.
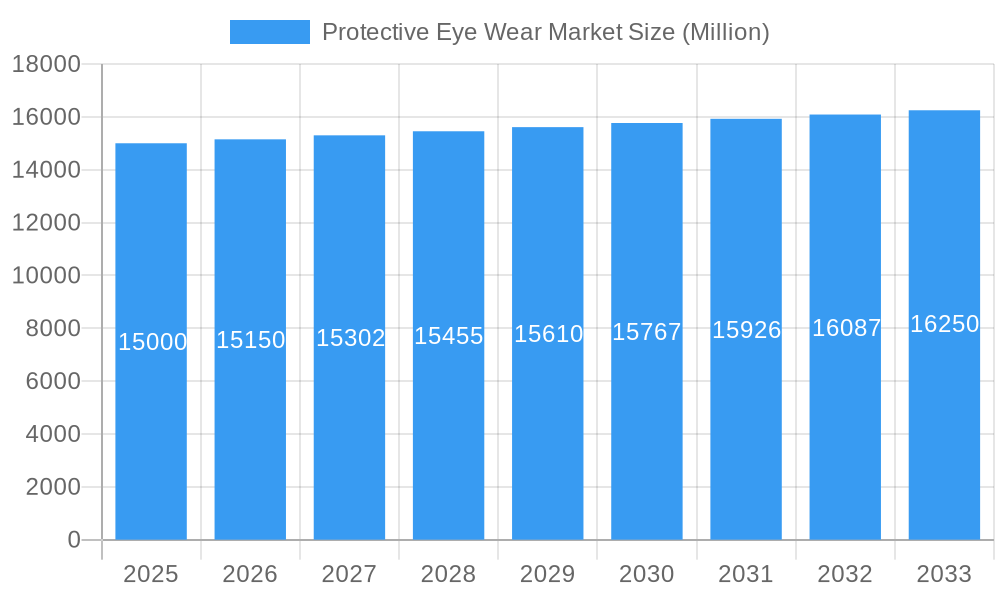
Protective Eye Wear Market Market Size (In Billion)
Future projections indicate moderate yet steady growth for the protective eyewear market. This is underpinned by the global implementation of stricter safety standards and heightened awareness of the long-term impact of eye injuries. Technological advancements focusing on enhanced comfort, durability, and specialized features, such as integrated Bluetooth for improved safety communications, will further stimulate demand. Potential challenges include price sensitivity in certain emerging markets and the risk of substitution by lower-quality alternatives. Nevertheless, the protective eyewear market's outlook remains positive, driven by the fundamental requirement for robust safety solutions in diverse industrial environments.
Protective Eye Wear Market Company Market Share
Protective Eye Wear Market: A Comprehensive Report (2019-2033)
This in-depth report provides a comprehensive analysis of the Protective Eye Wear Market, encompassing market dynamics, growth trends, regional segmentation, product landscape, key players, and future outlook. The study period covers 2019-2033, with 2025 as the base and estimated year. The report segments the market by Product Type (Spectacles, Welding Protection Glasses, Overspecs, Goggles) and End-User Industry (Automotive, Construction, Food Industry, Pharmaceutical, Mining, Oil and Gas, Other End-User Industries), offering granular insights for strategic decision-making. The market size is valued in Million Units.
Protective Eye Wear Market Market Dynamics & Structure
The protective eyewear market is characterized by a moderately concentrated landscape, with several major players holding significant market share. Technological innovation, driven by advancements in lens materials, coatings, and frame designs, plays a crucial role in shaping market dynamics. Stringent safety regulations across various industries influence product development and adoption. The market faces competition from substitutes like contact lenses in certain applications, though the demand for specialized protective eyewear remains robust. End-user demographics, particularly the growth of industries like construction and manufacturing, significantly impact market size. M&A activity is moderate, primarily focused on enhancing product portfolios and expanding geographical reach.
- Market Concentration: Moderately concentrated, with top 5 players holding approximately xx% market share in 2025 (estimated).
- Technological Innovation: Focus on lightweight materials, enhanced UV protection, anti-fog coatings, and integrated features like Bluetooth connectivity.
- Regulatory Framework: Compliance with OSHA and ANSI standards drives product development and market growth.
- Competitive Substitutes: Limited substitutes exist for specialized applications; competition is primarily among manufacturers.
- End-User Demographics: Growth in construction, manufacturing, and healthcare sectors drives market demand.
- M&A Trends: Moderate activity focused on expansion and diversification; xx M&A deals recorded between 2019-2024.
Protective Eye Wear Market Growth Trends & Insights
The protective eyewear market witnessed consistent growth during the historical period (2019-2024), driven by increasing industrialization, rising safety awareness, and stringent regulations. The market is projected to experience a CAGR of xx% during the forecast period (2025-2033), fueled by technological advancements, increasing adoption rates in emerging economies, and the expansion of end-user industries. Technological disruptions, such as the integration of smart features and advanced materials, are reshaping consumer preferences and driving premiumization. Changes in consumer behavior, particularly an increased focus on comfort and style, are also influencing product design and market segmentation. Market penetration remains relatively high in developed countries but shows significant growth potential in developing regions.
- Market Size Evolution: From xx Million Units in 2019 to xx Million Units in 2024, projected to reach xx Million Units by 2033.
- Adoption Rates: High in developed nations, with significant growth opportunities in emerging markets.
- Technological Disruptions: Integration of smart features and advanced lens materials driving market innovation.
- Consumer Behavior Shifts: Growing preference for comfortable, stylish, and technologically advanced eyewear.
Dominant Regions, Countries, or Segments in Protective Eye Wear Market
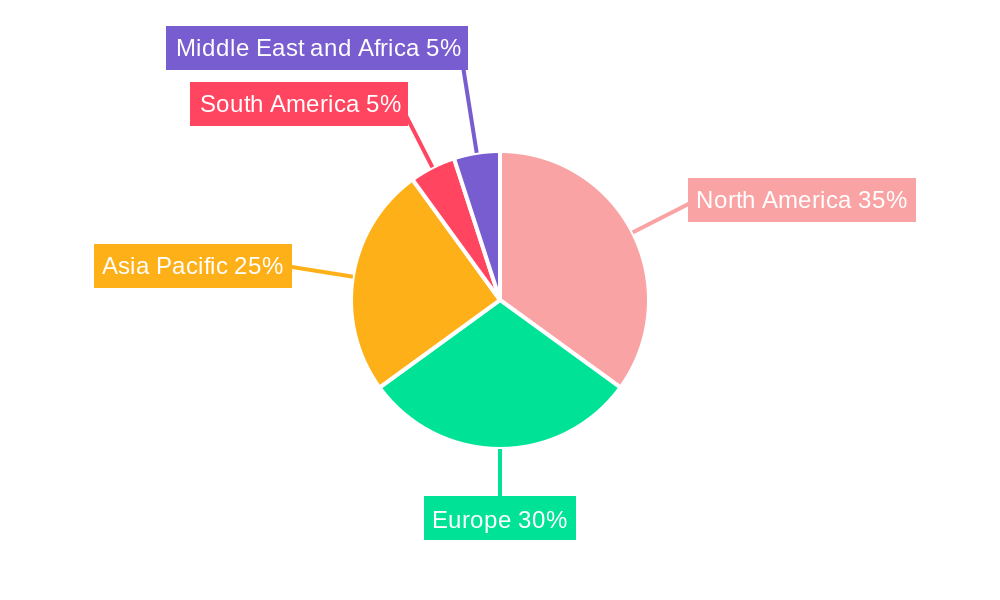
North America and Europe currently hold the largest share of the protective eyewear market, fueled by stringent safety regulations, advanced industrial sectors, and a strong emphasis on occupational safety. However, the Asia-Pacific region is projected to experience substantial growth throughout the forecast period, driven by rapid industrialization, a booming construction sector, and increasing disposable incomes. While spectacles and goggles maintain the largest market share in terms of product type, segments like welding protection glasses and specialized eyewear for niche applications (e.g., high-intensity UV environments, chemical splash protection) are exhibiting robust growth potential due to increased activity in manufacturing, construction, and other specialized industries. Key end-user segments include automotive, construction, oil & gas, healthcare, and manufacturing, collectively contributing significantly to overall market demand. The market is further segmented by lens material (polycarbonate, glass, etc.), frame material (plastic, metal), and features (anti-fog, anti-scratch coatings). Regional variations in safety standards and regulations also contribute to market segmentation.
- Key Drivers: Stringent safety regulations and enforcement, robust industrial growth across various sectors, rising disposable incomes (especially in APAC), increasing awareness of eye health and safety.
- Dominance Factors: High safety awareness, established industrial base, and advanced manufacturing capabilities in North America and Europe; early adoption of advanced technologies.
- Growth Potential: Significant growth opportunities in Asia-Pacific, Latin America, and other developing regions driven by infrastructure development and industrial expansion.
- Market Share: A detailed breakdown of market share by region and product type is available in the full report. (Note: replace this with actual data if available)
Protective Eye Wear Market Product Landscape
The protective eyewear market showcases a diverse range of products, from basic safety spectacles to advanced welding goggles with specialized coatings and features. Innovation focuses on enhancing protection levels, improving comfort, and integrating smart technologies. Unique selling propositions often include enhanced UV protection, anti-fog and anti-scratch coatings, lightweight designs, and ergonomic features. Technological advancements like the use of polycarbonate and other high-impact materials are improving the durability and performance of protective eyewear.
Key Drivers, Barriers & Challenges in Protective Eye Wear Market
Key Drivers:
- Increasing industrialization and construction activity globally, particularly in emerging economies.
- Stringent safety regulations and enforcement, creating a mandatory demand for protective eyewear.
- Rising awareness of workplace safety and the potential for eye injuries.
- Technological advancements leading to improved product features (e.g., lighter weight, enhanced clarity, better impact resistance), and functionalities (integrated smart sensors).
- Growing demand for specialized eyewear catering to niche applications and industries.
Key Challenges & Restraints:
- Fluctuations in raw material prices, impacting production costs.
- Intense competition among established and emerging players leading to price pressures.
- Supply chain disruptions impacting production and timely delivery.
- Regulatory compliance costs and the need to adapt to evolving safety standards.
- Counterfeit products undermining market integrity and potentially compromising safety.
Emerging Opportunities in Protective Eye Wear Market
- Expansion into untapped markets in developing economies through strategic partnerships and localized distribution networks.
- Development of specialized eyewear for niche applications (e.g., laser protection, extreme temperature environments, chemical splash protection).
- Integration of smart technologies (e.g., sensors for impact detection, connectivity features) for enhanced safety monitoring and data collection.
- Growing demand for customized and personalized eyewear to meet specific needs and preferences.
- Focus on sustainable and eco-friendly materials and manufacturing processes.
Growth Accelerators in the Protective Eye Wear Market Industry
Technological breakthroughs in materials science and lens coatings are major growth catalysts, enabling the development of lighter, stronger, and more comfortable eyewear. Strategic partnerships between eyewear manufacturers and industrial safety companies expand market reach and access to new technologies. Market expansion strategies, including increased investment in research & development and entry into new geographical regions, further accelerate growth.
Key Players Shaping the Protective Eye Wear Market Market
Notable Milestones in Protective Eye Wear Market Sector
- June 2021: MCR Safety launched the new Memphis safety glass series, featuring anti-fog lenses and UV cured coating for enhanced protection.
- October 2021: Uvex Group launched the Uvex i-range, offering three varieties of safety eyewear with UV 400 protection.
- October 2021: Uvex Group launched Uvex-Purefit, 100% recyclable safety spectacles made from polycarbonate.
In-Depth Protective Eye Wear Market Market Outlook
The protective eyewear market is poised for continued robust growth, driven by a confluence of factors: the increasing adoption of stringent safety regulations globally, the expansion of industrial sectors in both developed and developing economies, and a heightened awareness among workers and employers regarding the importance of eye protection. Strategic opportunities for market participants include developing innovative products with enhanced features and functionalities, targeting niche markets with specialized eyewear solutions, and forging strategic partnerships to expand distribution networks and market penetration. The continued emphasis on safety, technological innovation, and sustainable manufacturing practices will be critical drivers of future growth, ensuring the sustained expansion of this crucial market segment. The market is expected to witness considerable innovation in materials, designs, and integrated technologies in the coming years.
Protective Eye Wear Market Segmentation
-
1. Product Type
- 1.1. Spectacles
- 1.2. Welding Protection Glasses
- 1.3. Overspecs
- 1.4. Goggles
-
2. End-User Industry
- 2.1. Automotive
- 2.2. Construction
- 2.3. Food Industry
- 2.4. Pharmaceutical
- 2.5. Mining
- 2.6. Oil and Gas
- 2.7. Other End-User Industries
Protective Eye Wear Market Segmentation By Geography
-
1. North America
- 1.1. United States
- 1.2. Canada
- 1.3. Mexico
- 1.4. Rest of North America
-
2. Europe
- 2.1. Spain
- 2.2. United Kingdom
- 2.3. Germany
- 2.4. France
- 2.5. Italy
- 2.6. Russia
- 2.7. Rest of Europe
-
3. Asia Pacific
- 3.1. China
- 3.2. Japan
- 3.3. India
- 3.4. Australia
- 3.5. Rest of Asia Pacific
-
4. South America
- 4.1. Brazil
- 4.2. Argentina
- 4.3. Rest of South America
-
5. Middle East and Africa
- 5.1. South Africa
- 5.2. United Arab Emirates
- 5.3. Rest of Middle East and Africa
Protective Eye Wear Market Regional Market Share
Geographic Coverage of Protective Eye Wear Market
Protective Eye Wear Market REPORT HIGHLIGHTS
| Aspects | Details |
|---|---|
| Study Period | 2020-2034 |
| Base Year | 2025 |
| Estimated Year | 2026 |
| Forecast Period | 2026-2034 |
| Historical Period | 2020-2025 |
| Growth Rate | CAGR of 4.54% from 2020-2034 |
| Segmentation |
|
Table of Contents
- 1. Introduction
- 1.1. Research Scope
- 1.2. Market Segmentation
- 1.3. Research Objective
- 1.4. Definitions and Assumptions
- 2. Executive Summary
- 2.1. Market Snapshot
- 3. Market Dynamics
- 3.1. Market Drivers
- 3.2. Market Restrains
- 3.3. Market Trends
- 3.4. Market Opportunities
- 4. Market Factor Analysis
- 4.1. Porters Five Forces
- 4.1.1. Bargaining Power of Suppliers
- 4.1.2. Bargaining Power of Buyers
- 4.1.3. Threat of New Entrants
- 4.1.4. Threat of Substitutes
- 4.1.5. Competitive Rivalry
- 4.2. PESTEL analysis
- 4.3. BCG Analysis
- 4.3.1. Stars (High Growth, High Market Share)
- 4.3.2. Cash Cows (Low Growth, High Market Share)
- 4.3.3. Question Mark (High Growth, Low Market Share)
- 4.3.4. Dogs (Low Growth, Low Market Share)
- 4.4. Ansoff Matrix Analysis
- 4.5. Supply Chain Analysis
- 4.6. Regulatory Landscape
- 4.7. Current Market Potential and Opportunity Assessment (TAM–SAM–SOM Framework)
- 4.8. IMR Analyst Note
- 4.1. Porters Five Forces
- 5. Market Analysis, Insights and Forecast 2021-2033
- 5.1. Market Analysis, Insights and Forecast - by Product Type
- 5.1.1. Spectacles
- 5.1.2. Welding Protection Glasses
- 5.1.3. Overspecs
- 5.1.4. Goggles
- 5.2. Market Analysis, Insights and Forecast - by End-User Industry
- 5.2.1. Automotive
- 5.2.2. Construction
- 5.2.3. Food Industry
- 5.2.4. Pharmaceutical
- 5.2.5. Mining
- 5.2.6. Oil and Gas
- 5.2.7. Other End-User Industries
- 5.3. Market Analysis, Insights and Forecast - by Region
- 5.3.1. North America
- 5.3.2. Europe
- 5.3.3. Asia Pacific
- 5.3.4. South America
- 5.3.5. Middle East and Africa
- 5.1. Market Analysis, Insights and Forecast - by Product Type
- 6. Global Protective Eye Wear Market Analysis, Insights and Forecast, 2021-2033
- 6.1. Market Analysis, Insights and Forecast - by Product Type
- 6.1.1. Spectacles
- 6.1.2. Welding Protection Glasses
- 6.1.3. Overspecs
- 6.1.4. Goggles
- 6.2. Market Analysis, Insights and Forecast - by End-User Industry
- 6.2.1. Automotive
- 6.2.2. Construction
- 6.2.3. Food Industry
- 6.2.4. Pharmaceutical
- 6.2.5. Mining
- 6.2.6. Oil and Gas
- 6.2.7. Other End-User Industries
- 6.1. Market Analysis, Insights and Forecast - by Product Type
- 7. North America Protective Eye Wear Market Analysis, Insights and Forecast, 2020-2032
- 7.1. Market Analysis, Insights and Forecast - by Product Type
- 7.1.1. Spectacles
- 7.1.2. Welding Protection Glasses
- 7.1.3. Overspecs
- 7.1.4. Goggles
- 7.2. Market Analysis, Insights and Forecast - by End-User Industry
- 7.2.1. Automotive
- 7.2.2. Construction
- 7.2.3. Food Industry
- 7.2.4. Pharmaceutical
- 7.2.5. Mining
- 7.2.6. Oil and Gas
- 7.2.7. Other End-User Industries
- 7.1. Market Analysis, Insights and Forecast - by Product Type
- 8. Europe Protective Eye Wear Market Analysis, Insights and Forecast, 2020-2032
- 8.1. Market Analysis, Insights and Forecast - by Product Type
- 8.1.1. Spectacles
- 8.1.2. Welding Protection Glasses
- 8.1.3. Overspecs
- 8.1.4. Goggles
- 8.2. Market Analysis, Insights and Forecast - by End-User Industry
- 8.2.1. Automotive
- 8.2.2. Construction
- 8.2.3. Food Industry
- 8.2.4. Pharmaceutical
- 8.2.5. Mining
- 8.2.6. Oil and Gas
- 8.2.7. Other End-User Industries
- 8.1. Market Analysis, Insights and Forecast - by Product Type
- 9. Asia Pacific Protective Eye Wear Market Analysis, Insights and Forecast, 2020-2032
- 9.1. Market Analysis, Insights and Forecast - by Product Type
- 9.1.1. Spectacles
- 9.1.2. Welding Protection Glasses
- 9.1.3. Overspecs
- 9.1.4. Goggles
- 9.2. Market Analysis, Insights and Forecast - by End-User Industry
- 9.2.1. Automotive
- 9.2.2. Construction
- 9.2.3. Food Industry
- 9.2.4. Pharmaceutical
- 9.2.5. Mining
- 9.2.6. Oil and Gas
- 9.2.7. Other End-User Industries
- 9.1. Market Analysis, Insights and Forecast - by Product Type
- 10. South America Protective Eye Wear Market Analysis, Insights and Forecast, 2020-2032
- 10.1. Market Analysis, Insights and Forecast - by Product Type
- 10.1.1. Spectacles
- 10.1.2. Welding Protection Glasses
- 10.1.3. Overspecs
- 10.1.4. Goggles
- 10.2. Market Analysis, Insights and Forecast - by End-User Industry
- 10.2.1. Automotive
- 10.2.2. Construction
- 10.2.3. Food Industry
- 10.2.4. Pharmaceutical
- 10.2.5. Mining
- 10.2.6. Oil and Gas
- 10.2.7. Other End-User Industries
- 10.1. Market Analysis, Insights and Forecast - by Product Type
- 11. Middle East and Africa Protective Eye Wear Market Analysis, Insights and Forecast, 2020-2032
- 11.1. Market Analysis, Insights and Forecast - by Product Type
- 11.1.1. Spectacles
- 11.1.2. Welding Protection Glasses
- 11.1.3. Overspecs
- 11.1.4. Goggles
- 11.2. Market Analysis, Insights and Forecast - by End-User Industry
- 11.2.1. Automotive
- 11.2.2. Construction
- 11.2.3. Food Industry
- 11.2.4. Pharmaceutical
- 11.2.5. Mining
- 11.2.6. Oil and Gas
- 11.2.7. Other End-User Industries
- 11.1. Market Analysis, Insights and Forecast - by Product Type
- 12. Competitive Analysis
- 12.1. Company Profiles
- 12.1.1 Bolle Safety
- 12.1.1.1. Company Overview
- 12.1.1.2. Products
- 12.1.1.3. Company Financials
- 12.1.1.4. SWOT Analysis
- 12.1.2 Honeywell International Inc
- 12.1.2.1. Company Overview
- 12.1.2.2. Products
- 12.1.2.3. Company Financials
- 12.1.2.4. SWOT Analysis
- 12.1.3 Pyramex Safety Products LLC
- 12.1.3.1. Company Overview
- 12.1.3.2. Products
- 12.1.3.3. Company Financials
- 12.1.3.4. SWOT Analysis
- 12.1.4 Radians Inc
- 12.1.4.1. Company Overview
- 12.1.4.2. Products
- 12.1.4.3. Company Financials
- 12.1.4.4. SWOT Analysis
- 12.1.5 MCR Safety
- 12.1.5.1. Company Overview
- 12.1.5.2. Products
- 12.1.5.3. Company Financials
- 12.1.5.4. SWOT Analysis
- 12.1.6 uvex group
- 12.1.6.1. Company Overview
- 12.1.6.2. Products
- 12.1.6.3. Company Financials
- 12.1.6.4. SWOT Analysis
- 12.1.7 3M Company
- 12.1.7.1. Company Overview
- 12.1.7.2. Products
- 12.1.7.3. Company Financials
- 12.1.7.4. SWOT Analysis
- 12.1.8 Phillips Safety Products In
- 12.1.8.1. Company Overview
- 12.1.8.2. Products
- 12.1.8.3. Company Financials
- 12.1.8.4. SWOT Analysis
- 12.1.9 Gateway Safety Inc
- 12.1.9.1. Company Overview
- 12.1.9.2. Products
- 12.1.9.3. Company Financials
- 12.1.9.4. SWOT Analysis
- 12.1.10 SSP Eyewear
- 12.1.10.1. Company Overview
- 12.1.10.2. Products
- 12.1.10.3. Company Financials
- 12.1.10.4. SWOT Analysis
- 12.1.1 Bolle Safety
- 12.2. Market Entropy
- 12.2.1 Company's Key Areas Served
- 12.2.2 Recent Developments
- 12.3. Company Market Share Analysis 2025
- 12.3.1 Top 5 Companies Market Share Analysis
- 12.3.2 Top 3 Companies Market Share Analysis
- 12.4. List of Potential Customers
- 13. Research Methodology
List of Figures
- Figure 1: Global Protective Eye Wear Market Revenue Breakdown (billion, %) by Region 2025 & 2033
- Figure 2: Global Protective Eye Wear Market Volume Breakdown (K Units, %) by Region 2025 & 2033
- Figure 3: North America Protective Eye Wear Market Revenue (billion), by Product Type 2025 & 2033
- Figure 4: North America Protective Eye Wear Market Volume (K Units), by Product Type 2025 & 2033
- Figure 5: North America Protective Eye Wear Market Revenue Share (%), by Product Type 2025 & 2033
- Figure 6: North America Protective Eye Wear Market Volume Share (%), by Product Type 2025 & 2033
- Figure 7: North America Protective Eye Wear Market Revenue (billion), by End-User Industry 2025 & 2033
- Figure 8: North America Protective Eye Wear Market Volume (K Units), by End-User Industry 2025 & 2033
- Figure 9: North America Protective Eye Wear Market Revenue Share (%), by End-User Industry 2025 & 2033
- Figure 10: North America Protective Eye Wear Market Volume Share (%), by End-User Industry 2025 & 2033
- Figure 11: North America Protective Eye Wear Market Revenue (billion), by Country 2025 & 2033
- Figure 12: North America Protective Eye Wear Market Volume (K Units), by Country 2025 & 2033
- Figure 13: North America Protective Eye Wear Market Revenue Share (%), by Country 2025 & 2033
- Figure 14: North America Protective Eye Wear Market Volume Share (%), by Country 2025 & 2033
- Figure 15: Europe Protective Eye Wear Market Revenue (billion), by Product Type 2025 & 2033
- Figure 16: Europe Protective Eye Wear Market Volume (K Units), by Product Type 2025 & 2033
- Figure 17: Europe Protective Eye Wear Market Revenue Share (%), by Product Type 2025 & 2033
- Figure 18: Europe Protective Eye Wear Market Volume Share (%), by Product Type 2025 & 2033
- Figure 19: Europe Protective Eye Wear Market Revenue (billion), by End-User Industry 2025 & 2033
- Figure 20: Europe Protective Eye Wear Market Volume (K Units), by End-User Industry 2025 & 2033
- Figure 21: Europe Protective Eye Wear Market Revenue Share (%), by End-User Industry 2025 & 2033
- Figure 22: Europe Protective Eye Wear Market Volume Share (%), by End-User Industry 2025 & 2033
- Figure 23: Europe Protective Eye Wear Market Revenue (billion), by Country 2025 & 2033
- Figure 24: Europe Protective Eye Wear Market Volume (K Units), by Country 2025 & 2033
- Figure 25: Europe Protective Eye Wear Market Revenue Share (%), by Country 2025 & 2033
- Figure 26: Europe Protective Eye Wear Market Volume Share (%), by Country 2025 & 2033
- Figure 27: Asia Pacific Protective Eye Wear Market Revenue (billion), by Product Type 2025 & 2033
- Figure 28: Asia Pacific Protective Eye Wear Market Volume (K Units), by Product Type 2025 & 2033
- Figure 29: Asia Pacific Protective Eye Wear Market Revenue Share (%), by Product Type 2025 & 2033
- Figure 30: Asia Pacific Protective Eye Wear Market Volume Share (%), by Product Type 2025 & 2033
- Figure 31: Asia Pacific Protective Eye Wear Market Revenue (billion), by End-User Industry 2025 & 2033
- Figure 32: Asia Pacific Protective Eye Wear Market Volume (K Units), by End-User Industry 2025 & 2033
- Figure 33: Asia Pacific Protective Eye Wear Market Revenue Share (%), by End-User Industry 2025 & 2033
- Figure 34: Asia Pacific Protective Eye Wear Market Volume Share (%), by End-User Industry 2025 & 2033
- Figure 35: Asia Pacific Protective Eye Wear Market Revenue (billion), by Country 2025 & 2033
- Figure 36: Asia Pacific Protective Eye Wear Market Volume (K Units), by Country 2025 & 2033
- Figure 37: Asia Pacific Protective Eye Wear Market Revenue Share (%), by Country 2025 & 2033
- Figure 38: Asia Pacific Protective Eye Wear Market Volume Share (%), by Country 2025 & 2033
- Figure 39: South America Protective Eye Wear Market Revenue (billion), by Product Type 2025 & 2033
- Figure 40: South America Protective Eye Wear Market Volume (K Units), by Product Type 2025 & 2033
- Figure 41: South America Protective Eye Wear Market Revenue Share (%), by Product Type 2025 & 2033
- Figure 42: South America Protective Eye Wear Market Volume Share (%), by Product Type 2025 & 2033
- Figure 43: South America Protective Eye Wear Market Revenue (billion), by End-User Industry 2025 & 2033
- Figure 44: South America Protective Eye Wear Market Volume (K Units), by End-User Industry 2025 & 2033
- Figure 45: South America Protective Eye Wear Market Revenue Share (%), by End-User Industry 2025 & 2033
- Figure 46: South America Protective Eye Wear Market Volume Share (%), by End-User Industry 2025 & 2033
- Figure 47: South America Protective Eye Wear Market Revenue (billion), by Country 2025 & 2033
- Figure 48: South America Protective Eye Wear Market Volume (K Units), by Country 2025 & 2033
- Figure 49: South America Protective Eye Wear Market Revenue Share (%), by Country 2025 & 2033
- Figure 50: South America Protective Eye Wear Market Volume Share (%), by Country 2025 & 2033
- Figure 51: Middle East and Africa Protective Eye Wear Market Revenue (billion), by Product Type 2025 & 2033
- Figure 52: Middle East and Africa Protective Eye Wear Market Volume (K Units), by Product Type 2025 & 2033
- Figure 53: Middle East and Africa Protective Eye Wear Market Revenue Share (%), by Product Type 2025 & 2033
- Figure 54: Middle East and Africa Protective Eye Wear Market Volume Share (%), by Product Type 2025 & 2033
- Figure 55: Middle East and Africa Protective Eye Wear Market Revenue (billion), by End-User Industry 2025 & 2033
- Figure 56: Middle East and Africa Protective Eye Wear Market Volume (K Units), by End-User Industry 2025 & 2033
- Figure 57: Middle East and Africa Protective Eye Wear Market Revenue Share (%), by End-User Industry 2025 & 2033
- Figure 58: Middle East and Africa Protective Eye Wear Market Volume Share (%), by End-User Industry 2025 & 2033
- Figure 59: Middle East and Africa Protective Eye Wear Market Revenue (billion), by Country 2025 & 2033
- Figure 60: Middle East and Africa Protective Eye Wear Market Volume (K Units), by Country 2025 & 2033
- Figure 61: Middle East and Africa Protective Eye Wear Market Revenue Share (%), by Country 2025 & 2033
- Figure 62: Middle East and Africa Protective Eye Wear Market Volume Share (%), by Country 2025 & 2033
List of Tables
- Table 1: Global Protective Eye Wear Market Revenue billion Forecast, by Product Type 2020 & 2033
- Table 2: Global Protective Eye Wear Market Volume K Units Forecast, by Product Type 2020 & 2033
- Table 3: Global Protective Eye Wear Market Revenue billion Forecast, by End-User Industry 2020 & 2033
- Table 4: Global Protective Eye Wear Market Volume K Units Forecast, by End-User Industry 2020 & 2033
- Table 5: Global Protective Eye Wear Market Revenue billion Forecast, by Region 2020 & 2033
- Table 6: Global Protective Eye Wear Market Volume K Units Forecast, by Region 2020 & 2033
- Table 7: Global Protective Eye Wear Market Revenue billion Forecast, by Product Type 2020 & 2033
- Table 8: Global Protective Eye Wear Market Volume K Units Forecast, by Product Type 2020 & 2033
- Table 9: Global Protective Eye Wear Market Revenue billion Forecast, by End-User Industry 2020 & 2033
- Table 10: Global Protective Eye Wear Market Volume K Units Forecast, by End-User Industry 2020 & 2033
- Table 11: Global Protective Eye Wear Market Revenue billion Forecast, by Country 2020 & 2033
- Table 12: Global Protective Eye Wear Market Volume K Units Forecast, by Country 2020 & 2033
- Table 13: United States Protective Eye Wear Market Revenue (billion) Forecast, by Application 2020 & 2033
- Table 14: United States Protective Eye Wear Market Volume (K Units) Forecast, by Application 2020 & 2033
- Table 15: Canada Protective Eye Wear Market Revenue (billion) Forecast, by Application 2020 & 2033
- Table 16: Canada Protective Eye Wear Market Volume (K Units) Forecast, by Application 2020 & 2033
- Table 17: Mexico Protective Eye Wear Market Revenue (billion) Forecast, by Application 2020 & 2033
- Table 18: Mexico Protective Eye Wear Market Volume (K Units) Forecast, by Application 2020 & 2033
- Table 19: Rest of North America Protective Eye Wear Market Revenue (billion) Forecast, by Application 2020 & 2033
- Table 20: Rest of North America Protective Eye Wear Market Volume (K Units) Forecast, by Application 2020 & 2033
- Table 21: Global Protective Eye Wear Market Revenue billion Forecast, by Product Type 2020 & 2033
- Table 22: Global Protective Eye Wear Market Volume K Units Forecast, by Product Type 2020 & 2033
- Table 23: Global Protective Eye Wear Market Revenue billion Forecast, by End-User Industry 2020 & 2033
- Table 24: Global Protective Eye Wear Market Volume K Units Forecast, by End-User Industry 2020 & 2033
- Table 25: Global Protective Eye Wear Market Revenue billion Forecast, by Country 2020 & 2033
- Table 26: Global Protective Eye Wear Market Volume K Units Forecast, by Country 2020 & 2033
- Table 27: Spain Protective Eye Wear Market Revenue (billion) Forecast, by Application 2020 & 2033
- Table 28: Spain Protective Eye Wear Market Volume (K Units) Forecast, by Application 2020 & 2033
- Table 29: United Kingdom Protective Eye Wear Market Revenue (billion) Forecast, by Application 2020 & 2033
- Table 30: United Kingdom Protective Eye Wear Market Volume (K Units) Forecast, by Application 2020 & 2033
- Table 31: Germany Protective Eye Wear Market Revenue (billion) Forecast, by Application 2020 & 2033
- Table 32: Germany Protective Eye Wear Market Volume (K Units) Forecast, by Application 2020 & 2033
- Table 33: France Protective Eye Wear Market Revenue (billion) Forecast, by Application 2020 & 2033
- Table 34: France Protective Eye Wear Market Volume (K Units) Forecast, by Application 2020 & 2033
- Table 35: Italy Protective Eye Wear Market Revenue (billion) Forecast, by Application 2020 & 2033
- Table 36: Italy Protective Eye Wear Market Volume (K Units) Forecast, by Application 2020 & 2033
- Table 37: Russia Protective Eye Wear Market Revenue (billion) Forecast, by Application 2020 & 2033
- Table 38: Russia Protective Eye Wear Market Volume (K Units) Forecast, by Application 2020 & 2033
- Table 39: Rest of Europe Protective Eye Wear Market Revenue (billion) Forecast, by Application 2020 & 2033
- Table 40: Rest of Europe Protective Eye Wear Market Volume (K Units) Forecast, by Application 2020 & 2033
- Table 41: Global Protective Eye Wear Market Revenue billion Forecast, by Product Type 2020 & 2033
- Table 42: Global Protective Eye Wear Market Volume K Units Forecast, by Product Type 2020 & 2033
- Table 43: Global Protective Eye Wear Market Revenue billion Forecast, by End-User Industry 2020 & 2033
- Table 44: Global Protective Eye Wear Market Volume K Units Forecast, by End-User Industry 2020 & 2033
- Table 45: Global Protective Eye Wear Market Revenue billion Forecast, by Country 2020 & 2033
- Table 46: Global Protective Eye Wear Market Volume K Units Forecast, by Country 2020 & 2033
- Table 47: China Protective Eye Wear Market Revenue (billion) Forecast, by Application 2020 & 2033
- Table 48: China Protective Eye Wear Market Volume (K Units) Forecast, by Application 2020 & 2033
- Table 49: Japan Protective Eye Wear Market Revenue (billion) Forecast, by Application 2020 & 2033
- Table 50: Japan Protective Eye Wear Market Volume (K Units) Forecast, by Application 2020 & 2033
- Table 51: India Protective Eye Wear Market Revenue (billion) Forecast, by Application 2020 & 2033
- Table 52: India Protective Eye Wear Market Volume (K Units) Forecast, by Application 2020 & 2033
- Table 53: Australia Protective Eye Wear Market Revenue (billion) Forecast, by Application 2020 & 2033
- Table 54: Australia Protective Eye Wear Market Volume (K Units) Forecast, by Application 2020 & 2033
- Table 55: Rest of Asia Pacific Protective Eye Wear Market Revenue (billion) Forecast, by Application 2020 & 2033
- Table 56: Rest of Asia Pacific Protective Eye Wear Market Volume (K Units) Forecast, by Application 2020 & 2033
- Table 57: Global Protective Eye Wear Market Revenue billion Forecast, by Product Type 2020 & 2033
- Table 58: Global Protective Eye Wear Market Volume K Units Forecast, by Product Type 2020 & 2033
- Table 59: Global Protective Eye Wear Market Revenue billion Forecast, by End-User Industry 2020 & 2033
- Table 60: Global Protective Eye Wear Market Volume K Units Forecast, by End-User Industry 2020 & 2033
- Table 61: Global Protective Eye Wear Market Revenue billion Forecast, by Country 2020 & 2033
- Table 62: Global Protective Eye Wear Market Volume K Units Forecast, by Country 2020 & 2033
- Table 63: Brazil Protective Eye Wear Market Revenue (billion) Forecast, by Application 2020 & 2033
- Table 64: Brazil Protective Eye Wear Market Volume (K Units) Forecast, by Application 2020 & 2033
- Table 65: Argentina Protective Eye Wear Market Revenue (billion) Forecast, by Application 2020 & 2033
- Table 66: Argentina Protective Eye Wear Market Volume (K Units) Forecast, by Application 2020 & 2033
- Table 67: Rest of South America Protective Eye Wear Market Revenue (billion) Forecast, by Application 2020 & 2033
- Table 68: Rest of South America Protective Eye Wear Market Volume (K Units) Forecast, by Application 2020 & 2033
- Table 69: Global Protective Eye Wear Market Revenue billion Forecast, by Product Type 2020 & 2033
- Table 70: Global Protective Eye Wear Market Volume K Units Forecast, by Product Type 2020 & 2033
- Table 71: Global Protective Eye Wear Market Revenue billion Forecast, by End-User Industry 2020 & 2033
- Table 72: Global Protective Eye Wear Market Volume K Units Forecast, by End-User Industry 2020 & 2033
- Table 73: Global Protective Eye Wear Market Revenue billion Forecast, by Country 2020 & 2033
- Table 74: Global Protective Eye Wear Market Volume K Units Forecast, by Country 2020 & 2033
- Table 75: South Africa Protective Eye Wear Market Revenue (billion) Forecast, by Application 2020 & 2033
- Table 76: South Africa Protective Eye Wear Market Volume (K Units) Forecast, by Application 2020 & 2033
- Table 77: United Arab Emirates Protective Eye Wear Market Revenue (billion) Forecast, by Application 2020 & 2033
- Table 78: United Arab Emirates Protective Eye Wear Market Volume (K Units) Forecast, by Application 2020 & 2033
- Table 79: Rest of Middle East and Africa Protective Eye Wear Market Revenue (billion) Forecast, by Application 2020 & 2033
- Table 80: Rest of Middle East and Africa Protective Eye Wear Market Volume (K Units) Forecast, by Application 2020 & 2033
Frequently Asked Questions
1. What is the projected Compound Annual Growth Rate (CAGR) of the Protective Eye Wear Market?
The projected CAGR is approximately 4.54%.
2. Which companies are prominent players in the Protective Eye Wear Market?
Key companies in the market include Bolle Safety, Honeywell International Inc, Pyramex Safety Products LLC, Radians Inc, MCR Safety, uvex group, 3M Company, Phillips Safety Products In, Gateway Safety Inc, SSP Eyewear.
3. What are the main segments of the Protective Eye Wear Market?
The market segments include Product Type, End-User Industry.
4. Can you provide details about the market size?
The market size is estimated to be USD 4.38 billion as of 2022.
5. What are some drivers contributing to market growth?
Shift in Shopping Mode Preferences of the people; Increasing Urbanization; Growing Disposable Income.
6. What are the notable trends driving market growth?
Increasing Prevalence of Eye Injuries at Workplace.
7. Are there any restraints impacting market growth?
High-priced products and additional delivery charges; Inconsistency in product quality.
8. Can you provide examples of recent developments in the market?
October 2021: Uvex Group launched the Uvex i-range, an innovative safety eyewear for multiple applications. The products comprise 3 different varieties uvex i-lite, uvex i-guard, and uvex i-guard plus. The products are coated with UV 400 protection.
9. What pricing options are available for accessing the report?
Pricing options include single-user, multi-user, and enterprise licenses priced at USD 4750, USD 5250, and USD 8750 respectively.
10. Is the market size provided in terms of value or volume?
The market size is provided in terms of value, measured in billion and volume, measured in K Units.
11. Are there any specific market keywords associated with the report?
Yes, the market keyword associated with the report is "Protective Eye Wear Market," which aids in identifying and referencing the specific market segment covered.
12. How do I determine which pricing option suits my needs best?
The pricing options vary based on user requirements and access needs. Individual users may opt for single-user licenses, while businesses requiring broader access may choose multi-user or enterprise licenses for cost-effective access to the report.
13. Are there any additional resources or data provided in the Protective Eye Wear Market report?
While the report offers comprehensive insights, it's advisable to review the specific contents or supplementary materials provided to ascertain if additional resources or data are available.
14. How can I stay updated on further developments or reports in the Protective Eye Wear Market?
To stay informed about further developments, trends, and reports in the Protective Eye Wear Market, consider subscribing to industry newsletters, following relevant companies and organizations, or regularly checking reputable industry news sources and publications.
Methodology
Step 1 - Identification of Relevant Samples Size from Population Database


Step 2 - Approaches for Defining Global Market Size (Value, Volume* & Price*)

Note*: In applicable scenarios
Step 3 - Data Sources
Primary Research
- Web Analytics
- Survey Reports
- Research Institute
- Latest Research Reports
- Opinion Leaders
Secondary Research
- Annual Reports
- White Paper
- Latest Press Release
- Industry Association
- Paid Database
- Investor Presentations

Step 4 - Data Triangulation
Involves using different sources of information in order to increase the validity of a study
These sources are likely to be stakeholders in a program - participants, other researchers, program staff, other community members, and so on.
Then we put all data in single framework & apply various statistical tools to find out the dynamic on the market.
During the analysis stage, feedback from the stakeholder groups would be compared to determine areas of agreement as well as areas of divergence