

Key Insights
The remote sensing technology market is poised for substantial growth, driven by the escalating demand for high-resolution imagery and data across diverse sectors. Projections indicate a robust Compound Annual Growth Rate (CAGR) of 11.59%. This expansion is propelled by increasing adoption in commercial applications such as agriculture, urban planning, and environmental monitoring, enabling efficient resource management and informed decision-making. Concurrently, defense and government entities leverage remote sensing for critical intelligence, surveillance, and national security operations. Technological advancements, including satellite miniaturization and sophisticated sensor development, alongside the proliferation of affordable high-performance computing, are accelerating data processing and analysis, further fueling market momentum. The market's segmentation by satellite mass and orbit class underscores its varied capabilities. The Low Earth Orbit (LEO) segment is anticipated to experience significant growth due to its capacity for high-resolution imaging and frequent revisits.
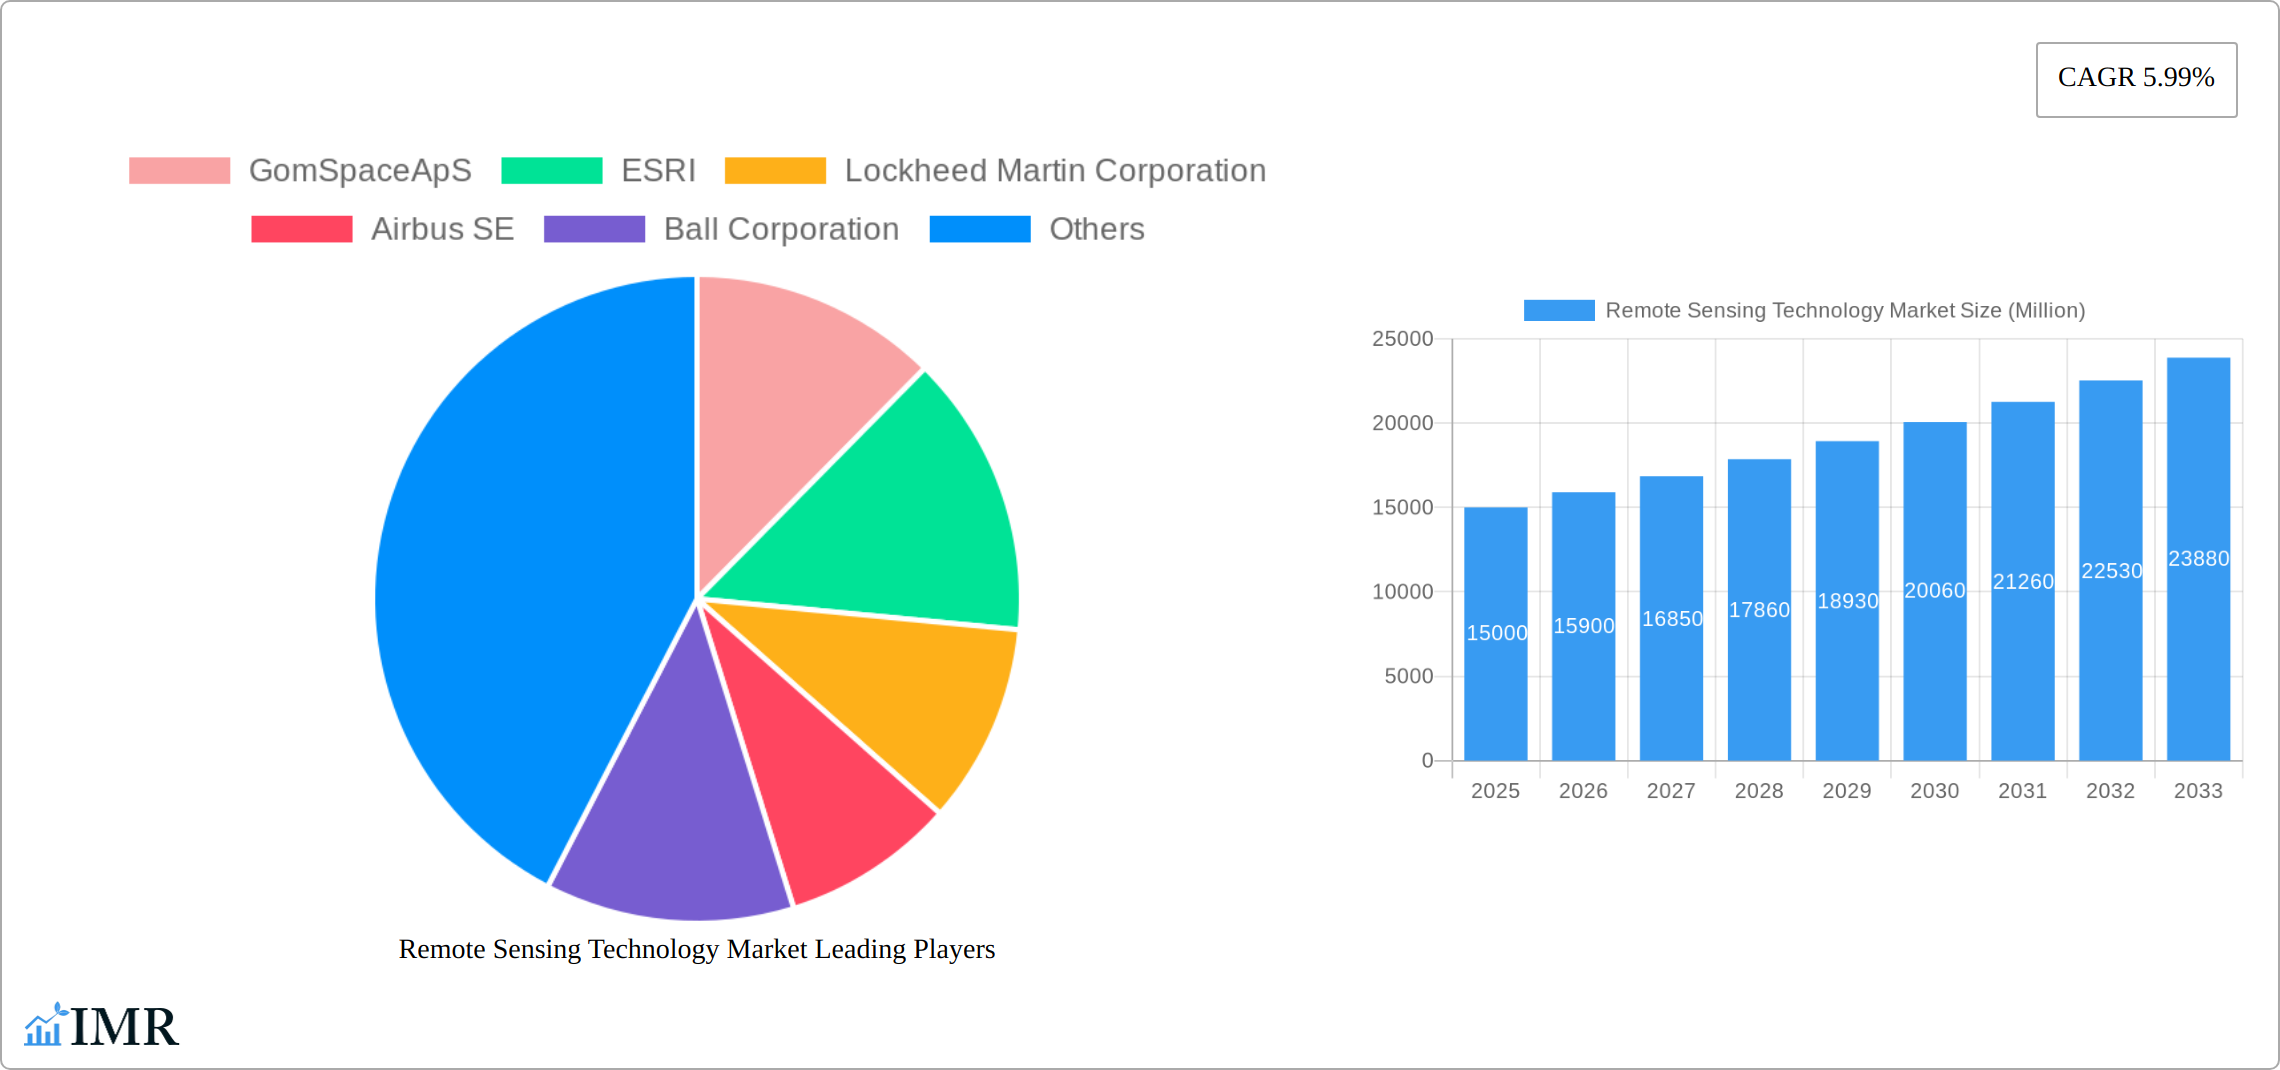
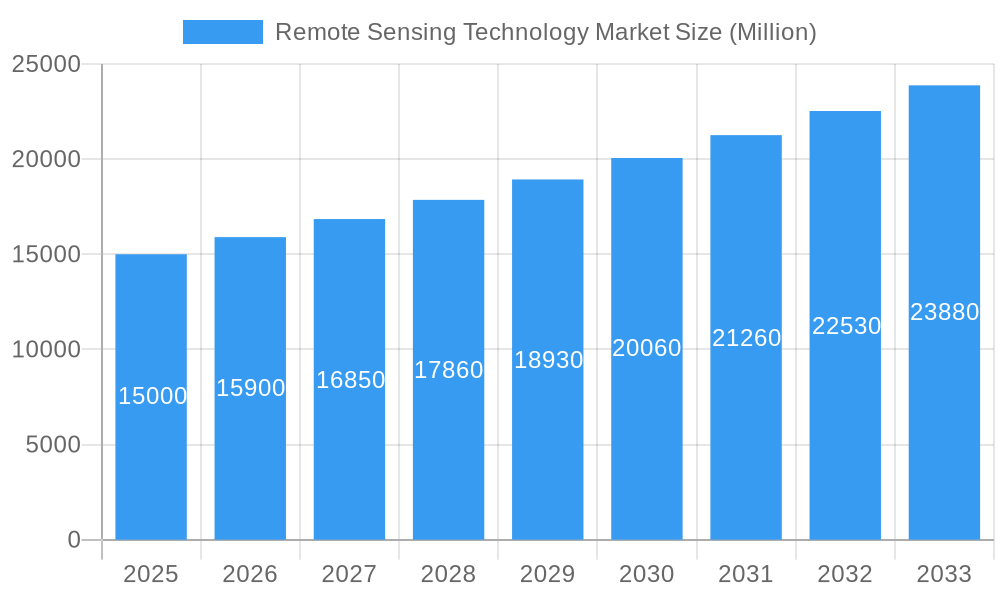
Remote Sensing Technology Market Market Size (In Billion)
The market is segmented by end-user (commercial, military & government), satellite mass, and orbit class (GEO, LEO, MEO). While specific regional data is not detailed, key contributing regions are anticipated to include North America, Europe, and Asia-Pacific. Primary market restraints involve high upfront investment costs for satellite development and launch, alongside regulatory complexities and data privacy concerns. Despite these challenges, the inherent benefits and extensive applications of remote sensing technology are expected to ensure sustained market expansion through the forecast period, with a projected market size of $25.37 billion by the base year 2025. Leading market participants comprise established aerospace corporations and innovative startups specializing in small satellite technology and data analytics. Intensifying competition is expected to drive further innovation and cost efficiencies.
Remote Sensing Technology Market Company Market Share
Remote Sensing Technology Market: A Comprehensive Report (2019-2033)
This in-depth report provides a comprehensive analysis of the Remote Sensing Technology market, encompassing market dynamics, growth trends, regional dominance, product landscape, key players, and future outlook. The study period spans from 2019 to 2033, with 2025 serving as the base and estimated year. The forecast period is 2025-2033, and the historical period covers 2019-2024. The market is segmented by end-user (Commercial, Military & Government, Other), satellite mass (Below 10 Kg, 10-100kg, 100-500kg, 500-1000kg, above 1000kg), orbit class (LEO, MEO, GEO), and satellite subsystem (Propulsion Hardware and Propellant, Satellite Bus & Subsystems, Solar Array & Power Hardware, Structures, Harness & Mechanisms). Key players analyzed include GomSpace ApS, ESRI, Lockheed Martin Corporation, Airbus SE, Ball Corporation, Japan Aerospace Exploration Agency (JAXA), China Aerospace Science and Technology Corporation (CASC), Maxar Technologies Inc, ROSCOSMOS, Thale, Planet Labs Inc, Northrop Grumman Corporation, Indian Space Research Organisation (ISRO), IHI Corporation, and Spire Global Inc. The total market value is predicted to reach xx Million by 2033.
Remote Sensing Technology Market Dynamics & Structure
The remote sensing technology market is characterized by a moderately concentrated landscape with a few major players holding significant market share. Technological innovation, particularly in miniaturization, improved sensor technology, and data analytics, is a primary growth driver. Stringent regulatory frameworks governing satellite launches and data usage impact market dynamics. The market faces competition from alternative data acquisition methods, but the unique advantages of remote sensing, such as wide-area coverage and high spatial resolution, maintain its relevance. Mergers and acquisitions (M&A) activity has been moderate, with larger players consolidating their positions and smaller companies seeking strategic partnerships.
- Market Concentration: The top 5 players hold approximately xx% of the market share in 2025.
- Technological Innovation: Advancements in sensor technology (e.g., hyperspectral imaging) and data processing capabilities are driving market expansion.
- Regulatory Landscape: International space laws and national regulations influence satellite deployment and data access.
- Competitive Substitutes: Aerial photography and ground-based data collection present competitive challenges.
- M&A Activity: An estimated xx M&A deals were recorded between 2019 and 2024, primarily focusing on technology integration and market expansion.
- Innovation Barriers: High development costs and complex regulatory compliance pose significant challenges to market entry.
Remote Sensing Technology Market Growth Trends & Insights
The remote sensing technology market has witnessed significant growth over the past five years, driven by increasing demand across various sectors. The market size expanded from xx Million in 2019 to xx Million in 2024, exhibiting a Compound Annual Growth Rate (CAGR) of xx%. Market penetration is particularly high in developed countries, with adoption rates steadily increasing in emerging economies. Technological disruptions, such as the emergence of CubeSats and nanosatellites, have lowered entry barriers and spurred innovation. Consumer behavior shifts towards real-time data and cloud-based solutions are shaping market demand. The forecast period (2025-2033) projects continued growth, driven by increasing investment in space infrastructure, expanding applications in various industries, and ongoing technological advancements. The market is expected to reach xx Million by 2033, with a projected CAGR of xx%.
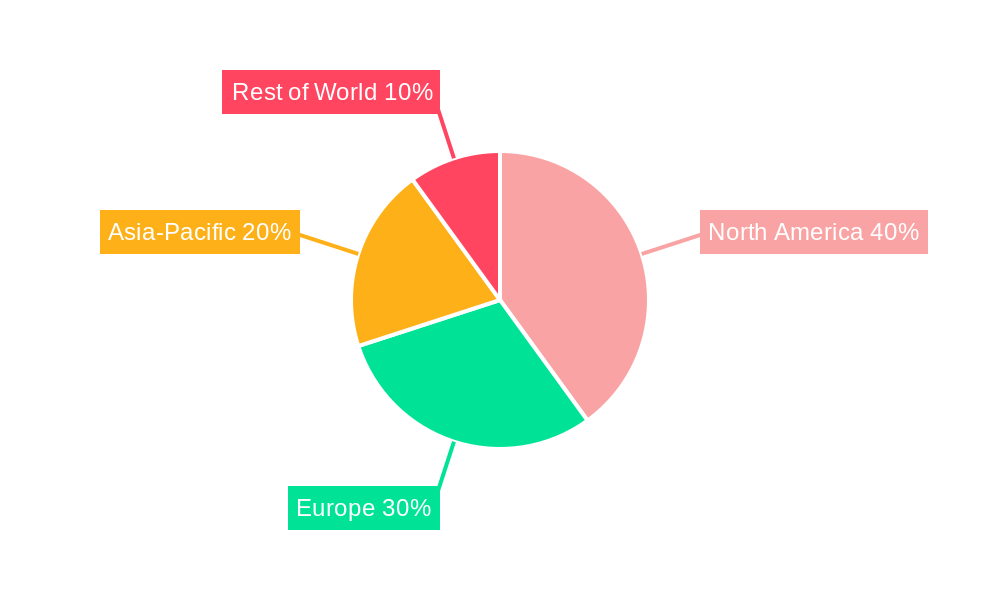
Dominant Regions, Countries, or Segments in Remote Sensing Technology Market
North America currently dominates the remote sensing technology market, followed by Europe and Asia-Pacific. The strong presence of major players, significant investments in space technology, and high demand from various sectors contribute to North America's dominance. Within specific segments, the Commercial sector exhibits the highest growth rate, driven by increasing applications in agriculture, urban planning, and environmental monitoring. The LEO (Low Earth Orbit) satellite segment holds the largest market share due to its cost-effectiveness and suitability for various applications. The "Satellite Bus & Subsystems" segment represents a major share of the satellite subsystem market owing to its importance in overall satellite functionality.
- Key Drivers:
- Government investments in space programs.
- Growing demand for geospatial data across various sectors.
- Technological advancements, particularly in sensor and data processing technologies.
- Expanding applications in agriculture, environmental monitoring, and disaster management.
- Regional Dominance Factors:
- Presence of major players and research institutions.
- Strong government support for space technology development.
- High investment in infrastructure and technology.
Remote Sensing Technology Market Product Landscape
The remote sensing technology market presents a dynamic and expanding ecosystem of products, encompassing everything from highly specialized individual sensors and critical satellite subsystems to complete, integrated satellite systems and sophisticated data analytics platforms. Recent product innovations are continuously pushing the boundaries of what's possible, with notable advancements including the development of increasingly miniaturized and cost-effective sensors, sophisticated multi-spectral and hyperspectral imaging capabilities that capture richer data, and the refinement of advanced data processing algorithms that significantly enhance the speed and accuracy of analysis. These breakthroughs are paramount in improving the overall quality, resolution, and efficiency of data acquisition and subsequent interpretation. Unique selling propositions within this market frequently hinge on delivering superior image quality, accelerated data processing speeds, and seamless integration with existing or emerging digital infrastructure. The overarching trajectory of technological advancements is predominantly focused on enhancing sensor performance, leveraging miniaturization to drive down costs, and developing more powerful and insightful data analytics capabilities.
Key Drivers, Barriers & Challenges in Remote Sensing Technology Market
Key Drivers:
- Increasing demand for precise geospatial data across various sectors (e.g., agriculture, urban planning, environmental monitoring).
- Technological advancements in sensor technology, satellite platforms, and data processing capabilities.
- Government initiatives and investments in space exploration and remote sensing technologies.
Challenges and Restraints:
- High initial investment costs associated with developing and launching satellites.
- Data security and privacy concerns related to sensitive geospatial information.
- Regulatory hurdles and complex licensing requirements for satellite operations.
- The impact of space debris on satellite operations and the need for efficient mitigation strategies.
Emerging Opportunities in Remote Sensing Technology Market
- Growth in demand for high-resolution imagery in various application domains.
- Expansion of applications in emerging economies, particularly in sectors like infrastructure development and resource management.
- Growing demand for cloud-based data processing and analysis services.
- Development of novel sensor technologies and miniaturization to increase accessibility.
Growth Accelerators in the Remote Sensing Technology Market Industry
The sustained and significant long-term growth trajectory of the remote sensing technology market will be underpinned by a confluence of powerful propelling factors. Foremost among these are continued, rapid technological breakthroughs in sensor technology, which are instrumental in delivering progressively higher data quality and resolution, thereby unlocking new analytical possibilities. Furthermore, the formation of strategic partnerships and collaborative ventures between leading satellite operators and specialized data analytics companies is pivotal in creating comprehensive, end-to-end integrated solutions that address complex user needs. The relentless expansion into novel and emerging application areas, such as the optimization of precision agriculture practices and the development of intelligent smart city initiatives, will also serve as substantial drivers for market growth. Finally, the ever-increasing affordability of satellite technologies, largely facilitated by advancements in miniaturization and mass production, will democratize access and contribute significantly to broader market expansion across diverse geographical regions and user segments.
Key Players Shaping the Remote Sensing Technology Market Market
- GomSpace ApS
- ESRI
- Lockheed Martin Corporation
- Airbus SE
- Ball Corporation
- Japan Aerospace Exploration Agency (JAXA)
- China Aerospace Science and Technology Corporation (CASC)
- Maxar Technologies Inc
- ROSCOSMOS
- Thales
- Planet Labs Inc
- Northrop Grumman Corporation
- Indian Space Research Organisation (ISRO)
- IHI Corporation
- Spire Global Inc
Notable Milestones in Remote Sensing Technology Market Sector
- March 2023: The Japan Aerospace Exploration Agency (JAXA) successfully orchestrated the maiden launch of its H3 Launch Vehicle, carrying the state-of-the-art Advanced Land Observing Satellite "Daichi 3" (ALOS-3) from the Tanegashima Space Center. This significant launch represents a monumental leap in Japanese space technology and substantially expands global Earth observation capabilities.
- February 2023: A landmark collaboration was forged between NASA and ESRI, resulting in the granting of significantly wider access to NASA's invaluable geospatial content. This initiative is poised to accelerate research, foster deeper exploration, and substantially boost data availability for a multitude of critical applications across various scientific and commercial domains.
- January 2023: Airbus Defence and Space announced the securing of a prestigious contract with the Republic of Poland, which entails the delivery of two high-performance optical Earth observation satellites. This significant contract underscores the robust and expanding growth within both the commercial and governmental segments of the remote sensing technology market.
In-Depth Remote Sensing Technology Market Market Outlook
The future outlook for the remote sensing technology market is exceptionally robust and filled with immense potential for growth and innovation. A continuous stream of technological advancements, coupled with the ever-expanding array of applications across a multitude of industries and sectors, alongside increasing government investments in Earth observation and geospatial intelligence, will collectively fuel significant and sustained market expansion. The landscape is also poised for further evolution through strategic partnerships, mergers, and acquisitions, which will undoubtedly lead to the consolidation of market players and the subsequent development of more comprehensive, integrated, and powerful end-to-end solutions. The increasing accessibility of remote sensing data, driven by both technological innovations and decreasing costs, is set to unlock a wealth of new opportunities, particularly in previously underserved regions and emerging application domains. The long-term potential of this market is substantial, promising significant returns and transformative impact for investors, businesses, and society as a whole.
Remote Sensing Technology Market Segmentation
-
1. Satellite Mass
- 1.1. 10-100kg
- 1.2. 100-500kg
- 1.3. 500-1000kg
- 1.4. Below 10 Kg
- 1.5. above 1000kg
-
2. Orbit Class
- 2.1. GEO
- 2.2. LEO
- 2.3. MEO
-
3. Satellite Subsystem
- 3.1. Propulsion Hardware and Propellant
- 3.2. Satellite Bus & Subsystems
- 3.3. Solar Array & Power Hardware
- 3.4. Structures, Harness & Mechanisms
-
4. End User
- 4.1. Commercial
- 4.2. Military & Government
- 4.3. Other
Remote Sensing Technology Market Segmentation By Geography
-
1. North America
- 1.1. United States
- 1.2. Canada
- 1.3. Mexico
-
2. South America
- 2.1. Brazil
- 2.2. Argentina
- 2.3. Rest of South America
-
3. Europe
- 3.1. United Kingdom
- 3.2. Germany
- 3.3. France
- 3.4. Italy
- 3.5. Spain
- 3.6. Russia
- 3.7. Benelux
- 3.8. Nordics
- 3.9. Rest of Europe
-
4. Middle East & Africa
- 4.1. Turkey
- 4.2. Israel
- 4.3. GCC
- 4.4. North Africa
- 4.5. South Africa
- 4.6. Rest of Middle East & Africa
-
5. Asia Pacific
- 5.1. China
- 5.2. India
- 5.3. Japan
- 5.4. South Korea
- 5.5. ASEAN
- 5.6. Oceania
- 5.7. Rest of Asia Pacific
Remote Sensing Technology Market Regional Market Share
Geographic Coverage of Remote Sensing Technology Market
Remote Sensing Technology Market REPORT HIGHLIGHTS
| Aspects | Details |
|---|---|
| Study Period | 2020-2034 |
| Base Year | 2025 |
| Estimated Year | 2026 |
| Forecast Period | 2026-2034 |
| Historical Period | 2020-2025 |
| Growth Rate | CAGR of 11.59% from 2020-2034 |
| Segmentation |
|
Table of Contents
- 1. Introduction
- 1.1. Research Scope
- 1.2. Market Segmentation
- 1.3. Research Objective
- 1.4. Definitions and Assumptions
- 2. Executive Summary
- 2.1. Market Snapshot
- 3. Market Dynamics
- 3.1. Market Drivers
- 3.2. Market Restrains
- 3.3. Market Trends
- 3.4. Market Opportunities
- 4. Market Factor Analysis
- 4.1. Porters Five Forces
- 4.1.1. Bargaining Power of Suppliers
- 4.1.2. Bargaining Power of Buyers
- 4.1.3. Threat of New Entrants
- 4.1.4. Threat of Substitutes
- 4.1.5. Competitive Rivalry
- 4.2. PESTEL analysis
- 4.3. BCG Analysis
- 4.3.1. Stars (High Growth, High Market Share)
- 4.3.2. Cash Cows (Low Growth, High Market Share)
- 4.3.3. Question Mark (High Growth, Low Market Share)
- 4.3.4. Dogs (Low Growth, Low Market Share)
- 4.4. Ansoff Matrix Analysis
- 4.5. Supply Chain Analysis
- 4.6. Regulatory Landscape
- 4.7. Current Market Potential and Opportunity Assessment (TAM–SAM–SOM Framework)
- 4.8. IMR Analyst Note
- 4.1. Porters Five Forces
- 5. Market Analysis, Insights and Forecast 2021-2033
- 5.1. Market Analysis, Insights and Forecast - by Satellite Mass
- 5.1.1. 10-100kg
- 5.1.2. 100-500kg
- 5.1.3. 500-1000kg
- 5.1.4. Below 10 Kg
- 5.1.5. above 1000kg
- 5.2. Market Analysis, Insights and Forecast - by Orbit Class
- 5.2.1. GEO
- 5.2.2. LEO
- 5.2.3. MEO
- 5.3. Market Analysis, Insights and Forecast - by Satellite Subsystem
- 5.3.1. Propulsion Hardware and Propellant
- 5.3.2. Satellite Bus & Subsystems
- 5.3.3. Solar Array & Power Hardware
- 5.3.4. Structures, Harness & Mechanisms
- 5.4. Market Analysis, Insights and Forecast - by End User
- 5.4.1. Commercial
- 5.4.2. Military & Government
- 5.4.3. Other
- 5.5. Market Analysis, Insights and Forecast - by Region
- 5.5.1. North America
- 5.5.2. South America
- 5.5.3. Europe
- 5.5.4. Middle East & Africa
- 5.5.5. Asia Pacific
- 5.1. Market Analysis, Insights and Forecast - by Satellite Mass
- 6. Global Remote Sensing Technology Market Analysis, Insights and Forecast, 2021-2033
- 6.1. Market Analysis, Insights and Forecast - by Satellite Mass
- 6.1.1. 10-100kg
- 6.1.2. 100-500kg
- 6.1.3. 500-1000kg
- 6.1.4. Below 10 Kg
- 6.1.5. above 1000kg
- 6.2. Market Analysis, Insights and Forecast - by Orbit Class
- 6.2.1. GEO
- 6.2.2. LEO
- 6.2.3. MEO
- 6.3. Market Analysis, Insights and Forecast - by Satellite Subsystem
- 6.3.1. Propulsion Hardware and Propellant
- 6.3.2. Satellite Bus & Subsystems
- 6.3.3. Solar Array & Power Hardware
- 6.3.4. Structures, Harness & Mechanisms
- 6.4. Market Analysis, Insights and Forecast - by End User
- 6.4.1. Commercial
- 6.4.2. Military & Government
- 6.4.3. Other
- 6.1. Market Analysis, Insights and Forecast - by Satellite Mass
- 7. North America Remote Sensing Technology Market Analysis, Insights and Forecast, 2020-2032
- 7.1. Market Analysis, Insights and Forecast - by Satellite Mass
- 7.1.1. 10-100kg
- 7.1.2. 100-500kg
- 7.1.3. 500-1000kg
- 7.1.4. Below 10 Kg
- 7.1.5. above 1000kg
- 7.2. Market Analysis, Insights and Forecast - by Orbit Class
- 7.2.1. GEO
- 7.2.2. LEO
- 7.2.3. MEO
- 7.3. Market Analysis, Insights and Forecast - by Satellite Subsystem
- 7.3.1. Propulsion Hardware and Propellant
- 7.3.2. Satellite Bus & Subsystems
- 7.3.3. Solar Array & Power Hardware
- 7.3.4. Structures, Harness & Mechanisms
- 7.4. Market Analysis, Insights and Forecast - by End User
- 7.4.1. Commercial
- 7.4.2. Military & Government
- 7.4.3. Other
- 7.1. Market Analysis, Insights and Forecast - by Satellite Mass
- 8. South America Remote Sensing Technology Market Analysis, Insights and Forecast, 2020-2032
- 8.1. Market Analysis, Insights and Forecast - by Satellite Mass
- 8.1.1. 10-100kg
- 8.1.2. 100-500kg
- 8.1.3. 500-1000kg
- 8.1.4. Below 10 Kg
- 8.1.5. above 1000kg
- 8.2. Market Analysis, Insights and Forecast - by Orbit Class
- 8.2.1. GEO
- 8.2.2. LEO
- 8.2.3. MEO
- 8.3. Market Analysis, Insights and Forecast - by Satellite Subsystem
- 8.3.1. Propulsion Hardware and Propellant
- 8.3.2. Satellite Bus & Subsystems
- 8.3.3. Solar Array & Power Hardware
- 8.3.4. Structures, Harness & Mechanisms
- 8.4. Market Analysis, Insights and Forecast - by End User
- 8.4.1. Commercial
- 8.4.2. Military & Government
- 8.4.3. Other
- 8.1. Market Analysis, Insights and Forecast - by Satellite Mass
- 9. Europe Remote Sensing Technology Market Analysis, Insights and Forecast, 2020-2032
- 9.1. Market Analysis, Insights and Forecast - by Satellite Mass
- 9.1.1. 10-100kg
- 9.1.2. 100-500kg
- 9.1.3. 500-1000kg
- 9.1.4. Below 10 Kg
- 9.1.5. above 1000kg
- 9.2. Market Analysis, Insights and Forecast - by Orbit Class
- 9.2.1. GEO
- 9.2.2. LEO
- 9.2.3. MEO
- 9.3. Market Analysis, Insights and Forecast - by Satellite Subsystem
- 9.3.1. Propulsion Hardware and Propellant
- 9.3.2. Satellite Bus & Subsystems
- 9.3.3. Solar Array & Power Hardware
- 9.3.4. Structures, Harness & Mechanisms
- 9.4. Market Analysis, Insights and Forecast - by End User
- 9.4.1. Commercial
- 9.4.2. Military & Government
- 9.4.3. Other
- 9.1. Market Analysis, Insights and Forecast - by Satellite Mass
- 10. Middle East & Africa Remote Sensing Technology Market Analysis, Insights and Forecast, 2020-2032
- 10.1. Market Analysis, Insights and Forecast - by Satellite Mass
- 10.1.1. 10-100kg
- 10.1.2. 100-500kg
- 10.1.3. 500-1000kg
- 10.1.4. Below 10 Kg
- 10.1.5. above 1000kg
- 10.2. Market Analysis, Insights and Forecast - by Orbit Class
- 10.2.1. GEO
- 10.2.2. LEO
- 10.2.3. MEO
- 10.3. Market Analysis, Insights and Forecast - by Satellite Subsystem
- 10.3.1. Propulsion Hardware and Propellant
- 10.3.2. Satellite Bus & Subsystems
- 10.3.3. Solar Array & Power Hardware
- 10.3.4. Structures, Harness & Mechanisms
- 10.4. Market Analysis, Insights and Forecast - by End User
- 10.4.1. Commercial
- 10.4.2. Military & Government
- 10.4.3. Other
- 10.1. Market Analysis, Insights and Forecast - by Satellite Mass
- 11. Asia Pacific Remote Sensing Technology Market Analysis, Insights and Forecast, 2020-2032
- 11.1. Market Analysis, Insights and Forecast - by Satellite Mass
- 11.1.1. 10-100kg
- 11.1.2. 100-500kg
- 11.1.3. 500-1000kg
- 11.1.4. Below 10 Kg
- 11.1.5. above 1000kg
- 11.2. Market Analysis, Insights and Forecast - by Orbit Class
- 11.2.1. GEO
- 11.2.2. LEO
- 11.2.3. MEO
- 11.3. Market Analysis, Insights and Forecast - by Satellite Subsystem
- 11.3.1. Propulsion Hardware and Propellant
- 11.3.2. Satellite Bus & Subsystems
- 11.3.3. Solar Array & Power Hardware
- 11.3.4. Structures, Harness & Mechanisms
- 11.4. Market Analysis, Insights and Forecast - by End User
- 11.4.1. Commercial
- 11.4.2. Military & Government
- 11.4.3. Other
- 11.1. Market Analysis, Insights and Forecast - by Satellite Mass
- 12. Competitive Analysis
- 12.1. Company Profiles
- 12.1.1 GomSpaceApS
- 12.1.1.1. Company Overview
- 12.1.1.2. Products
- 12.1.1.3. Company Financials
- 12.1.1.4. SWOT Analysis
- 12.1.2 ESRI
- 12.1.2.1. Company Overview
- 12.1.2.2. Products
- 12.1.2.3. Company Financials
- 12.1.2.4. SWOT Analysis
- 12.1.3 Lockheed Martin Corporation
- 12.1.3.1. Company Overview
- 12.1.3.2. Products
- 12.1.3.3. Company Financials
- 12.1.3.4. SWOT Analysis
- 12.1.4 Airbus SE
- 12.1.4.1. Company Overview
- 12.1.4.2. Products
- 12.1.4.3. Company Financials
- 12.1.4.4. SWOT Analysis
- 12.1.5 Ball Corporation
- 12.1.5.1. Company Overview
- 12.1.5.2. Products
- 12.1.5.3. Company Financials
- 12.1.5.4. SWOT Analysis
- 12.1.6 Japan Aerospace Exploration Agency (JAXA)
- 12.1.6.1. Company Overview
- 12.1.6.2. Products
- 12.1.6.3. Company Financials
- 12.1.6.4. SWOT Analysis
- 12.1.7 China Aerospace Science and Technology Corporation (CASC)
- 12.1.7.1. Company Overview
- 12.1.7.2. Products
- 12.1.7.3. Company Financials
- 12.1.7.4. SWOT Analysis
- 12.1.8 Maxar Technologies Inc
- 12.1.8.1. Company Overview
- 12.1.8.2. Products
- 12.1.8.3. Company Financials
- 12.1.8.4. SWOT Analysis
- 12.1.9 ROSCOSMOS
- 12.1.9.1. Company Overview
- 12.1.9.2. Products
- 12.1.9.3. Company Financials
- 12.1.9.4. SWOT Analysis
- 12.1.10 Thale
- 12.1.10.1. Company Overview
- 12.1.10.2. Products
- 12.1.10.3. Company Financials
- 12.1.10.4. SWOT Analysis
- 12.1.11 Planet Labs Inc
- 12.1.11.1. Company Overview
- 12.1.11.2. Products
- 12.1.11.3. Company Financials
- 12.1.11.4. SWOT Analysis
- 12.1.12 Northrop Grumman Corporation
- 12.1.12.1. Company Overview
- 12.1.12.2. Products
- 12.1.12.3. Company Financials
- 12.1.12.4. SWOT Analysis
- 12.1.13 Indian Space Research Organisation (ISRO)
- 12.1.13.1. Company Overview
- 12.1.13.2. Products
- 12.1.13.3. Company Financials
- 12.1.13.4. SWOT Analysis
- 12.1.14 IHI Corporation
- 12.1.14.1. Company Overview
- 12.1.14.2. Products
- 12.1.14.3. Company Financials
- 12.1.14.4. SWOT Analysis
- 12.1.15 Spire Global Inc
- 12.1.15.1. Company Overview
- 12.1.15.2. Products
- 12.1.15.3. Company Financials
- 12.1.15.4. SWOT Analysis
- 12.1.1 GomSpaceApS
- 12.2. Market Entropy
- 12.2.1 Company's Key Areas Served
- 12.2.2 Recent Developments
- 12.3. Company Market Share Analysis 2025
- 12.3.1 Top 5 Companies Market Share Analysis
- 12.3.2 Top 3 Companies Market Share Analysis
- 12.4. List of Potential Customers
- 13. Research Methodology
List of Figures
- Figure 1: Global Remote Sensing Technology Market Revenue Breakdown (billion, %) by Region 2025 & 2033
- Figure 2: North America Remote Sensing Technology Market Revenue (billion), by Satellite Mass 2025 & 2033
- Figure 3: North America Remote Sensing Technology Market Revenue Share (%), by Satellite Mass 2025 & 2033
- Figure 4: North America Remote Sensing Technology Market Revenue (billion), by Orbit Class 2025 & 2033
- Figure 5: North America Remote Sensing Technology Market Revenue Share (%), by Orbit Class 2025 & 2033
- Figure 6: North America Remote Sensing Technology Market Revenue (billion), by Satellite Subsystem 2025 & 2033
- Figure 7: North America Remote Sensing Technology Market Revenue Share (%), by Satellite Subsystem 2025 & 2033
- Figure 8: North America Remote Sensing Technology Market Revenue (billion), by End User 2025 & 2033
- Figure 9: North America Remote Sensing Technology Market Revenue Share (%), by End User 2025 & 2033
- Figure 10: North America Remote Sensing Technology Market Revenue (billion), by Country 2025 & 2033
- Figure 11: North America Remote Sensing Technology Market Revenue Share (%), by Country 2025 & 2033
- Figure 12: South America Remote Sensing Technology Market Revenue (billion), by Satellite Mass 2025 & 2033
- Figure 13: South America Remote Sensing Technology Market Revenue Share (%), by Satellite Mass 2025 & 2033
- Figure 14: South America Remote Sensing Technology Market Revenue (billion), by Orbit Class 2025 & 2033
- Figure 15: South America Remote Sensing Technology Market Revenue Share (%), by Orbit Class 2025 & 2033
- Figure 16: South America Remote Sensing Technology Market Revenue (billion), by Satellite Subsystem 2025 & 2033
- Figure 17: South America Remote Sensing Technology Market Revenue Share (%), by Satellite Subsystem 2025 & 2033
- Figure 18: South America Remote Sensing Technology Market Revenue (billion), by End User 2025 & 2033
- Figure 19: South America Remote Sensing Technology Market Revenue Share (%), by End User 2025 & 2033
- Figure 20: South America Remote Sensing Technology Market Revenue (billion), by Country 2025 & 2033
- Figure 21: South America Remote Sensing Technology Market Revenue Share (%), by Country 2025 & 2033
- Figure 22: Europe Remote Sensing Technology Market Revenue (billion), by Satellite Mass 2025 & 2033
- Figure 23: Europe Remote Sensing Technology Market Revenue Share (%), by Satellite Mass 2025 & 2033
- Figure 24: Europe Remote Sensing Technology Market Revenue (billion), by Orbit Class 2025 & 2033
- Figure 25: Europe Remote Sensing Technology Market Revenue Share (%), by Orbit Class 2025 & 2033
- Figure 26: Europe Remote Sensing Technology Market Revenue (billion), by Satellite Subsystem 2025 & 2033
- Figure 27: Europe Remote Sensing Technology Market Revenue Share (%), by Satellite Subsystem 2025 & 2033
- Figure 28: Europe Remote Sensing Technology Market Revenue (billion), by End User 2025 & 2033
- Figure 29: Europe Remote Sensing Technology Market Revenue Share (%), by End User 2025 & 2033
- Figure 30: Europe Remote Sensing Technology Market Revenue (billion), by Country 2025 & 2033
- Figure 31: Europe Remote Sensing Technology Market Revenue Share (%), by Country 2025 & 2033
- Figure 32: Middle East & Africa Remote Sensing Technology Market Revenue (billion), by Satellite Mass 2025 & 2033
- Figure 33: Middle East & Africa Remote Sensing Technology Market Revenue Share (%), by Satellite Mass 2025 & 2033
- Figure 34: Middle East & Africa Remote Sensing Technology Market Revenue (billion), by Orbit Class 2025 & 2033
- Figure 35: Middle East & Africa Remote Sensing Technology Market Revenue Share (%), by Orbit Class 2025 & 2033
- Figure 36: Middle East & Africa Remote Sensing Technology Market Revenue (billion), by Satellite Subsystem 2025 & 2033
- Figure 37: Middle East & Africa Remote Sensing Technology Market Revenue Share (%), by Satellite Subsystem 2025 & 2033
- Figure 38: Middle East & Africa Remote Sensing Technology Market Revenue (billion), by End User 2025 & 2033
- Figure 39: Middle East & Africa Remote Sensing Technology Market Revenue Share (%), by End User 2025 & 2033
- Figure 40: Middle East & Africa Remote Sensing Technology Market Revenue (billion), by Country 2025 & 2033
- Figure 41: Middle East & Africa Remote Sensing Technology Market Revenue Share (%), by Country 2025 & 2033
- Figure 42: Asia Pacific Remote Sensing Technology Market Revenue (billion), by Satellite Mass 2025 & 2033
- Figure 43: Asia Pacific Remote Sensing Technology Market Revenue Share (%), by Satellite Mass 2025 & 2033
- Figure 44: Asia Pacific Remote Sensing Technology Market Revenue (billion), by Orbit Class 2025 & 2033
- Figure 45: Asia Pacific Remote Sensing Technology Market Revenue Share (%), by Orbit Class 2025 & 2033
- Figure 46: Asia Pacific Remote Sensing Technology Market Revenue (billion), by Satellite Subsystem 2025 & 2033
- Figure 47: Asia Pacific Remote Sensing Technology Market Revenue Share (%), by Satellite Subsystem 2025 & 2033
- Figure 48: Asia Pacific Remote Sensing Technology Market Revenue (billion), by End User 2025 & 2033
- Figure 49: Asia Pacific Remote Sensing Technology Market Revenue Share (%), by End User 2025 & 2033
- Figure 50: Asia Pacific Remote Sensing Technology Market Revenue (billion), by Country 2025 & 2033
- Figure 51: Asia Pacific Remote Sensing Technology Market Revenue Share (%), by Country 2025 & 2033
List of Tables
- Table 1: Global Remote Sensing Technology Market Revenue billion Forecast, by Satellite Mass 2020 & 2033
- Table 2: Global Remote Sensing Technology Market Revenue billion Forecast, by Orbit Class 2020 & 2033
- Table 3: Global Remote Sensing Technology Market Revenue billion Forecast, by Satellite Subsystem 2020 & 2033
- Table 4: Global Remote Sensing Technology Market Revenue billion Forecast, by End User 2020 & 2033
- Table 5: Global Remote Sensing Technology Market Revenue billion Forecast, by Region 2020 & 2033
- Table 6: Global Remote Sensing Technology Market Revenue billion Forecast, by Satellite Mass 2020 & 2033
- Table 7: Global Remote Sensing Technology Market Revenue billion Forecast, by Orbit Class 2020 & 2033
- Table 8: Global Remote Sensing Technology Market Revenue billion Forecast, by Satellite Subsystem 2020 & 2033
- Table 9: Global Remote Sensing Technology Market Revenue billion Forecast, by End User 2020 & 2033
- Table 10: Global Remote Sensing Technology Market Revenue billion Forecast, by Country 2020 & 2033
- Table 11: United States Remote Sensing Technology Market Revenue (billion) Forecast, by Application 2020 & 2033
- Table 12: Canada Remote Sensing Technology Market Revenue (billion) Forecast, by Application 2020 & 2033
- Table 13: Mexico Remote Sensing Technology Market Revenue (billion) Forecast, by Application 2020 & 2033
- Table 14: Global Remote Sensing Technology Market Revenue billion Forecast, by Satellite Mass 2020 & 2033
- Table 15: Global Remote Sensing Technology Market Revenue billion Forecast, by Orbit Class 2020 & 2033
- Table 16: Global Remote Sensing Technology Market Revenue billion Forecast, by Satellite Subsystem 2020 & 2033
- Table 17: Global Remote Sensing Technology Market Revenue billion Forecast, by End User 2020 & 2033
- Table 18: Global Remote Sensing Technology Market Revenue billion Forecast, by Country 2020 & 2033
- Table 19: Brazil Remote Sensing Technology Market Revenue (billion) Forecast, by Application 2020 & 2033
- Table 20: Argentina Remote Sensing Technology Market Revenue (billion) Forecast, by Application 2020 & 2033
- Table 21: Rest of South America Remote Sensing Technology Market Revenue (billion) Forecast, by Application 2020 & 2033
- Table 22: Global Remote Sensing Technology Market Revenue billion Forecast, by Satellite Mass 2020 & 2033
- Table 23: Global Remote Sensing Technology Market Revenue billion Forecast, by Orbit Class 2020 & 2033
- Table 24: Global Remote Sensing Technology Market Revenue billion Forecast, by Satellite Subsystem 2020 & 2033
- Table 25: Global Remote Sensing Technology Market Revenue billion Forecast, by End User 2020 & 2033
- Table 26: Global Remote Sensing Technology Market Revenue billion Forecast, by Country 2020 & 2033
- Table 27: United Kingdom Remote Sensing Technology Market Revenue (billion) Forecast, by Application 2020 & 2033
- Table 28: Germany Remote Sensing Technology Market Revenue (billion) Forecast, by Application 2020 & 2033
- Table 29: France Remote Sensing Technology Market Revenue (billion) Forecast, by Application 2020 & 2033
- Table 30: Italy Remote Sensing Technology Market Revenue (billion) Forecast, by Application 2020 & 2033
- Table 31: Spain Remote Sensing Technology Market Revenue (billion) Forecast, by Application 2020 & 2033
- Table 32: Russia Remote Sensing Technology Market Revenue (billion) Forecast, by Application 2020 & 2033
- Table 33: Benelux Remote Sensing Technology Market Revenue (billion) Forecast, by Application 2020 & 2033
- Table 34: Nordics Remote Sensing Technology Market Revenue (billion) Forecast, by Application 2020 & 2033
- Table 35: Rest of Europe Remote Sensing Technology Market Revenue (billion) Forecast, by Application 2020 & 2033
- Table 36: Global Remote Sensing Technology Market Revenue billion Forecast, by Satellite Mass 2020 & 2033
- Table 37: Global Remote Sensing Technology Market Revenue billion Forecast, by Orbit Class 2020 & 2033
- Table 38: Global Remote Sensing Technology Market Revenue billion Forecast, by Satellite Subsystem 2020 & 2033
- Table 39: Global Remote Sensing Technology Market Revenue billion Forecast, by End User 2020 & 2033
- Table 40: Global Remote Sensing Technology Market Revenue billion Forecast, by Country 2020 & 2033
- Table 41: Turkey Remote Sensing Technology Market Revenue (billion) Forecast, by Application 2020 & 2033
- Table 42: Israel Remote Sensing Technology Market Revenue (billion) Forecast, by Application 2020 & 2033
- Table 43: GCC Remote Sensing Technology Market Revenue (billion) Forecast, by Application 2020 & 2033
- Table 44: North Africa Remote Sensing Technology Market Revenue (billion) Forecast, by Application 2020 & 2033
- Table 45: South Africa Remote Sensing Technology Market Revenue (billion) Forecast, by Application 2020 & 2033
- Table 46: Rest of Middle East & Africa Remote Sensing Technology Market Revenue (billion) Forecast, by Application 2020 & 2033
- Table 47: Global Remote Sensing Technology Market Revenue billion Forecast, by Satellite Mass 2020 & 2033
- Table 48: Global Remote Sensing Technology Market Revenue billion Forecast, by Orbit Class 2020 & 2033
- Table 49: Global Remote Sensing Technology Market Revenue billion Forecast, by Satellite Subsystem 2020 & 2033
- Table 50: Global Remote Sensing Technology Market Revenue billion Forecast, by End User 2020 & 2033
- Table 51: Global Remote Sensing Technology Market Revenue billion Forecast, by Country 2020 & 2033
- Table 52: China Remote Sensing Technology Market Revenue (billion) Forecast, by Application 2020 & 2033
- Table 53: India Remote Sensing Technology Market Revenue (billion) Forecast, by Application 2020 & 2033
- Table 54: Japan Remote Sensing Technology Market Revenue (billion) Forecast, by Application 2020 & 2033
- Table 55: South Korea Remote Sensing Technology Market Revenue (billion) Forecast, by Application 2020 & 2033
- Table 56: ASEAN Remote Sensing Technology Market Revenue (billion) Forecast, by Application 2020 & 2033
- Table 57: Oceania Remote Sensing Technology Market Revenue (billion) Forecast, by Application 2020 & 2033
- Table 58: Rest of Asia Pacific Remote Sensing Technology Market Revenue (billion) Forecast, by Application 2020 & 2033
Frequently Asked Questions
1. What is the projected Compound Annual Growth Rate (CAGR) of the Remote Sensing Technology Market?
The projected CAGR is approximately 11.59%.
2. Which companies are prominent players in the Remote Sensing Technology Market?
Key companies in the market include GomSpaceApS, ESRI, Lockheed Martin Corporation, Airbus SE, Ball Corporation, Japan Aerospace Exploration Agency (JAXA), China Aerospace Science and Technology Corporation (CASC), Maxar Technologies Inc, ROSCOSMOS, Thale, Planet Labs Inc, Northrop Grumman Corporation, Indian Space Research Organisation (ISRO), IHI Corporation, Spire Global Inc.
3. What are the main segments of the Remote Sensing Technology Market?
The market segments include Satellite Mass, Orbit Class, Satellite Subsystem, End User.
4. Can you provide details about the market size?
The market size is estimated to be USD 25.37 billion as of 2022.
5. What are some drivers contributing to market growth?
N/A
6. What are the notable trends driving market growth?
OTHER KEY INDUSTRY TRENDS COVERED IN THE REPORT.
7. Are there any restraints impacting market growth?
N/A
8. Can you provide examples of recent developments in the market?
March 2023: The Japan Aerospace Exploration Agency (JAXA) had scheduled the launch of the first H3 Launch Vehicle with the Advanced Land Observing Satellite "Daichi 3" (ALOS-3) onboard from the Tanegashima Space Center.February 2023: NASA and geographic information service provider Esri will grant wider access to the space agency's geospatial content for research and exploration purposes through the Space Act Agreement.January 2023: Airbus Defence and Space has signed a contract with Poland to provide a geospatial intelligence system including the development, manufacture, launch and delivery in orbit of two high-performance optical Earth observation satellites.
9. What pricing options are available for accessing the report?
Pricing options include single-user, multi-user, and enterprise licenses priced at USD 3800, USD 4500, and USD 5800 respectively.
10. Is the market size provided in terms of value or volume?
The market size is provided in terms of value, measured in billion.
11. Are there any specific market keywords associated with the report?
Yes, the market keyword associated with the report is "Remote Sensing Technology Market," which aids in identifying and referencing the specific market segment covered.
12. How do I determine which pricing option suits my needs best?
The pricing options vary based on user requirements and access needs. Individual users may opt for single-user licenses, while businesses requiring broader access may choose multi-user or enterprise licenses for cost-effective access to the report.
13. Are there any additional resources or data provided in the Remote Sensing Technology Market report?
While the report offers comprehensive insights, it's advisable to review the specific contents or supplementary materials provided to ascertain if additional resources or data are available.
14. How can I stay updated on further developments or reports in the Remote Sensing Technology Market?
To stay informed about further developments, trends, and reports in the Remote Sensing Technology Market, consider subscribing to industry newsletters, following relevant companies and organizations, or regularly checking reputable industry news sources and publications.
Methodology
Step 1 - Identification of Relevant Samples Size from Population Database


Step 2 - Approaches for Defining Global Market Size (Value, Volume* & Price*)

Note*: In applicable scenarios
Step 3 - Data Sources
Primary Research
- Web Analytics
- Survey Reports
- Research Institute
- Latest Research Reports
- Opinion Leaders
Secondary Research
- Annual Reports
- White Paper
- Latest Press Release
- Industry Association
- Paid Database
- Investor Presentations

Step 4 - Data Triangulation
Involves using different sources of information in order to increase the validity of a study
These sources are likely to be stakeholders in a program - participants, other researchers, program staff, other community members, and so on.
Then we put all data in single framework & apply various statistical tools to find out the dynamic on the market.
During the analysis stage, feedback from the stakeholder groups would be compared to determine areas of agreement as well as areas of divergence