


Key Insights
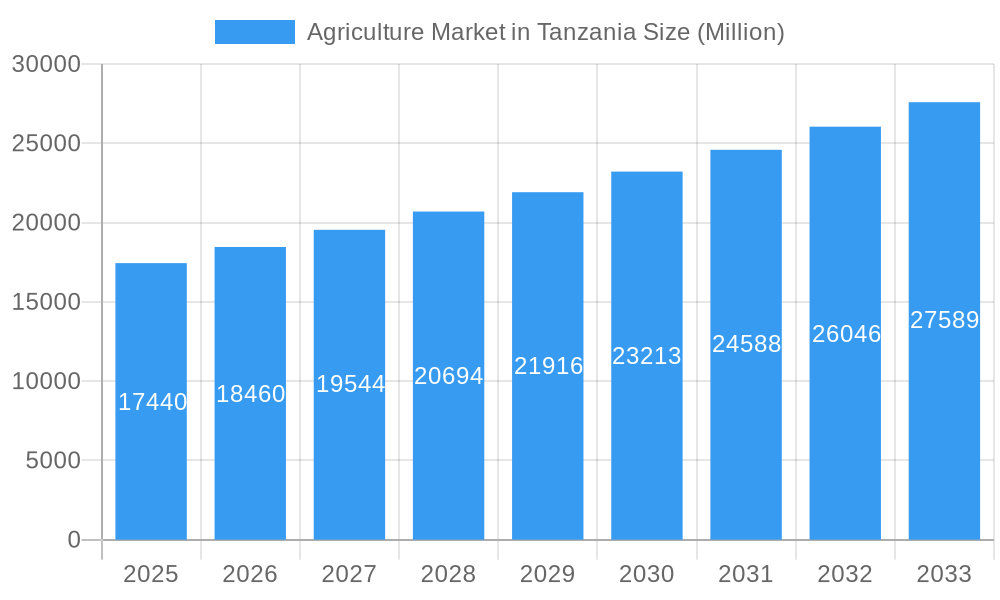
The Tanzanian agriculture market, valued at $17.44 billion in 2025, exhibits robust growth potential, projected to expand at a compound annual growth rate (CAGR) of 5.63% from 2025 to 2033. This growth is driven by increasing domestic demand for food crops, fruits, and vegetables fueled by a rising population and urbanization. Government initiatives promoting agricultural modernization, including improved infrastructure and access to finance through institutions like the Tanzania Agricultural Development Bank, further stimulate market expansion. The expanding export market for certain crops, particularly high-value fruits and vegetables, also contributes significantly. However, challenges remain, including climate change impacting crop yields, limited access to advanced farming technologies for many smallholder farmers, and fluctuating global commodity prices which can impact profitability. Key players like Syngenta, Rijk Zwaan, and local companies such as Kilombero Plantations Ltd. are pivotal in driving innovation and efficiency within the sector. Furthermore, the Tanzania Seed Trade Association (TASTA) and Tanzania Horticultural Association (THA) play vital roles in supporting the industry's development and sustainable growth. The segmentation of the market by crop type (food crops/cereals, fruits, vegetables) allows for a granular understanding of specific market dynamics and growth opportunities within each segment. Future growth will likely depend on addressing the challenges faced by smallholder farmers, promoting sustainable agricultural practices, and leveraging technology to enhance productivity and efficiency.
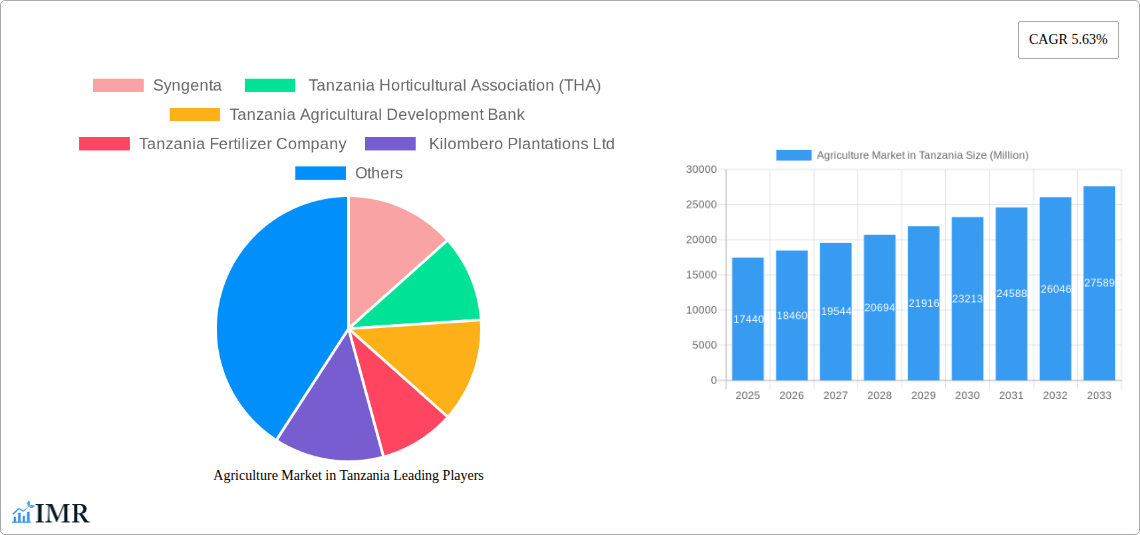
Agriculture Market in Tanzania Market Size (In Billion)

The market is segmented by crop type, offering opportunities for targeted investments and strategies. Food crops/cereals, given their staple nature, are expected to constitute a significant portion of the market. However, the high-value fruits and vegetable segments are poised for accelerated growth, driven by both domestic and export demand. Companies are focusing on improved seed varieties, efficient farming techniques, and value addition to enhance profitability. Government policy, investment in agricultural infrastructure, and access to credit are critical in shaping the future trajectory of the Tanzanian agriculture market. The overall outlook remains positive, with substantial potential for further development and market expansion over the forecast period, although sustainable practices and farmer empowerment are critical for long-term success.
Agriculture Market in Tanzania Company Market Share
Agriculture Market in Tanzania: A Comprehensive Market Report (2019-2033)
This in-depth report provides a comprehensive analysis of the Tanzanian agriculture market, encompassing market dynamics, growth trends, dominant segments, product landscape, key players, and future outlook. The study period covers 2019-2033, with a base year of 2025 and a forecast period of 2025-2033. This report is crucial for businesses, investors, and policymakers seeking to understand and capitalize on opportunities within this dynamic sector. We analyze key segments including Food Crops/Cereals, Fruits, and Vegetables, considering production, consumption, import, export volumes and values, and price trends.
Agriculture Market in Tanzania: Market Dynamics & Structure
The Tanzanian agriculture market is characterized by a diverse landscape of smallholder farmers, large-scale commercial farms, and a growing number of agro-processing businesses. Market concentration is relatively low, with no single dominant player across all segments. However, within specific segments like seed production or fertilizer distribution, larger companies like Syngenta and Kilimanjaro Agro Inputs Ltd hold significant market share. Technological innovation remains a key driver, with increasing adoption of mobile technology for market information and precision agriculture techniques. Regulatory frameworks, while evolving, present both opportunities and challenges for growth. Substitute products, including imported foods, exert competitive pressure. The end-user demographic is largely rural, with a high dependence on agriculture for livelihoods. M&A activity has been relatively modest in recent years, with only xx major deals recorded in the past five years, largely driven by consolidation within the input supply chain.
- Market Concentration: Low overall; higher concentration in specific input segments.
- Technological Innovation: Growing adoption of mobile technology and precision agriculture, hindered by limited access to technology and infrastructure.
- Regulatory Framework: Evolving, with both supporting and restrictive policies impacting market growth.
- Competitive Product Substitutes: Imported food products pose a challenge to local production.
- End-User Demographics: Predominantly rural population relying on agriculture.
- M&A Trends: xx major deals over the last five years, primarily focusing on input supply chains.
Agriculture Market in Tanzania: Growth Trends & Insights
The Tanzanian agriculture market experienced a CAGR of xx% during the historical period (2019-2024), driven by population growth and increasing urbanization leading to higher demand for food. This positive trajectory is projected to continue during the forecast period (2025-2033), with a forecasted CAGR of xx%. Adoption rates of new technologies, such as improved seed varieties and mechanized farming techniques, are gradually increasing, though hindered by affordability and accessibility challenges. Technological disruptions, particularly in areas like precision farming, are gaining traction but remain limited. Shifts in consumer behavior, including a preference for processed foods, are creating opportunities for agro-processing companies. Market penetration of improved seed varieties is estimated at xx% in 2025.
Dominant Regions, Countries, or Segments in Agriculture Market in Tanzania
The northern regions of Tanzania, known for their fertile volcanic soils and favorable climate, dominate the production of key crops such as coffee, tea and horticultural products. The central and southern regions are important for maize, beans, and other staple food crops. The most significant segments by volume are food crops, specifically cereals (maize, rice, wheat), driven by high domestic demand. Fruits and vegetables are also experiencing robust growth, fueled by increasing urban populations and export opportunities.
Key Drivers: Favorable climatic conditions in northern regions; high domestic demand for food crops; export opportunities for fruits and vegetables; government support for agricultural development; increased investment in irrigation and infrastructure in selected regions.
Dominance Factors: High agricultural productivity in certain regions; strong government support for specific crops; favorable weather patterns and water resources.
Growth Potential: Significant potential in value-added agriculture and export-oriented production.
Agriculture Market in Tanzania: Product Landscape
The product landscape is diverse, encompassing a wide range of crops, livestock, and aquaculture products. Recent innovations focus on improved seed varieties, disease-resistant crops, and efficient fertilizers. The introduction of drought-tolerant crop varieties is significantly improving the resilience of agricultural production to the impacts of climate change. The focus is shifting towards higher-yielding, quality-focused products catering to both domestic consumption and export markets.
Key Drivers, Barriers & Challenges in Agriculture Market in Tanzania
Key Drivers:
- Growing population and increasing urbanization driving higher food demand.
- Government initiatives supporting agricultural development through subsidies and infrastructure investments (USD 73.5 million approved by African Development Bank).
- Increasing foreign direct investment in the agricultural sector.
Key Challenges and Restraints:
- Limited access to finance and credit for smallholder farmers.
- Poor infrastructure, including inadequate transportation networks and irrigation systems.
- Climate change impacts, including droughts and floods, leading to significant yield fluctuations (estimated xx% reduction in maize yield during drought seasons).
- Lack of access to modern technology and inputs.
Emerging Opportunities in Agriculture Market in Tanzania
- Surging demand for processed and value-added agricultural products, including packaged foods, essential oils, and biofuels, driven by changing consumer preferences and industrial applications.
- Significant growth in opportunities for export-oriented agriculture, with a particular focus on high-value fruits (e.g., avocados, mangoes), specialty vegetables, and diverse horticultural products catering to international markets.
- Expanding potential for organic farming and sustainable agriculture practices, responding to global demand for ethically produced and environmentally conscious food, with opportunities in certification and premium markets.
- Intensifying development of robust agricultural value chains, encompassing advanced input supply systems, modern processing facilities, efficient logistics, and strengthened marketing platforms for enhanced market access and profitability.
Growth Accelerators in the Agriculture Market in Tanzania Industry
The long-term growth trajectory of the Tanzanian agriculture market is poised for significant acceleration, primarily driven by strategic investments in modern agricultural infrastructure, including irrigation systems, post-harvest storage, and cold chain facilities. Enhanced and accessible finance for smallholder farmers through innovative credit schemes and microfinance institutions will be pivotal. The widespread adoption of climate-smart agricultural practices, such as drought-resistant crop varieties and water-efficient irrigation, will bolster resilience. Furthermore, the promotion of agricultural diversification into higher-value crops and the development of value-addition initiatives, coupled with significantly improved market linkages facilitated by enhanced transportation networks and digital communication platforms, will be crucial enablers. Embracing technological innovation, encompassing precision farming techniques, advanced farm management software, and the development and dissemination of improved crop varieties and livestock breeds, will further amplify productivity and operational efficiency.
Key Players Shaping the Agriculture Market in Tanzania Market
- Syngenta
- Tanzania Horticultural Association (THA)
- Tanzania Agricultural Development Bank
- Tanzania Fertilizer Company
- Kilombero Plantations Ltd
- Rijk Zwaan
- Monsanto
- Tanzania Breweries Limited
- Kilimanjaro Agro Inputs Ltd
- Tanzania Seed Trade Association (TASTA)
Notable Milestones in Agriculture Market in Tanzania Sector
- September 2022: Tanzania's Ministry of Agriculture directs TARI to find a location for genetically engineered crop trials, potentially overturning a 2021 ban. This signals a potential shift towards embracing biotechnology in agriculture.
- July 2022: The African Development Bank Group approves USD 73.5 million to increase food production by a million tonnes over three years, representing a major investment in agricultural productivity.
- February 2022: AgriFI and ElectrFI launch event at the EU-Africa Business Forum demonstrates increasing international support for agricultural development and financing.
In-Depth Agriculture Market in Tanzania Market Outlook
The Tanzanian agriculture market demonstrates robust and significant long-term growth potential, underpinned by a rapidly expanding population, increasing urbanization leading to higher per capita food consumption, and a discernible rise in demand for diverse and quality food products. Strategic opportunities are particularly prominent in developing value-added agricultural products, fostering export-oriented production of high-demand commodities, and championing the widespread adoption of sustainable and climate-resilient farming practices. Continued strategic investment in critical infrastructure, ensuring equitable access to affordable finance for all stakeholders, and fostering technological innovation across the value chain will be instrumental in fully unlocking the sector's immense potential. The projected Compound Annual Growth Rate (CAGR) for the forecast period (2025-2033) indicates a dynamic and expanding market, presenting highly attractive and lucrative opportunities for both domestic enterprises and international investors seeking to capitalize on the burgeoning agricultural landscape of Tanzania.
Agriculture Market in Tanzania Segmentation
-
1. Crop Typ
- 1.1. Food Crops/Cereals
- 1.2. Fruits
- 1.3. Vegetables
-
2. Crop Typ
- 2.1. Food Crops/Cereals
- 2.2. Fruits
- 2.3. Vegetables
Agriculture Market in Tanzania Segmentation By Geography
-
1. North America
- 1.1. United States
- 1.2. Canada
- 1.3. Mexico
-
2. South America
- 2.1. Brazil
- 2.2. Argentina
- 2.3. Rest of South America
-
3. Europe
- 3.1. United Kingdom
- 3.2. Germany
- 3.3. France
- 3.4. Italy
- 3.5. Spain
- 3.6. Russia
- 3.7. Benelux
- 3.8. Nordics
- 3.9. Rest of Europe
-
4. Middle East & Africa
- 4.1. Turkey
- 4.2. Israel
- 4.3. GCC
- 4.4. North Africa
- 4.5. South Africa
- 4.6. Rest of Middle East & Africa
-
5. Asia Pacific
- 5.1. China
- 5.2. India
- 5.3. Japan
- 5.4. South Korea
- 5.5. ASEAN
- 5.6. Oceania
- 5.7. Rest of Asia Pacific
Agriculture Market in Tanzania Regional Market Share
Geographic Coverage of Agriculture Market in Tanzania
Agriculture Market in Tanzania REPORT HIGHLIGHTS
| Aspects | Details |
|---|---|
| Study Period | 2020-2034 |
| Base Year | 2025 |
| Estimated Year | 2026 |
| Forecast Period | 2026-2034 |
| Historical Period | 2020-2025 |
| Growth Rate | CAGR of 5.63% from 2020-2034 |
| Segmentation |
|
Table of Contents
- 1. Introduction
- 1.1. Research Scope
- 1.2. Market Segmentation
- 1.3. Research Objective
- 1.4. Definitions and Assumptions
- 2. Executive Summary
- 2.1. Market Snapshot
- 3. Market Dynamics
- 3.1. Market Drivers
- 3.2. Market Restrains
- 3.3. Market Trends
- 3.4. Market Opportunities
- 4. Market Factor Analysis
- 4.1. Porters Five Forces
- 4.1.1. Bargaining Power of Suppliers
- 4.1.2. Bargaining Power of Buyers
- 4.1.3. Threat of New Entrants
- 4.1.4. Threat of Substitutes
- 4.1.5. Competitive Rivalry
- 4.2. PESTEL analysis
- 4.3. BCG Analysis
- 4.3.1. Stars (High Growth, High Market Share)
- 4.3.2. Cash Cows (Low Growth, High Market Share)
- 4.3.3. Question Mark (High Growth, Low Market Share)
- 4.3.4. Dogs (Low Growth, Low Market Share)
- 4.4. Ansoff Matrix Analysis
- 4.5. Supply Chain Analysis
- 4.6. Regulatory Landscape
- 4.7. Current Market Potential and Opportunity Assessment (TAM–SAM–SOM Framework)
- 4.8. IMR Analyst Note
- 4.1. Porters Five Forces
- 5. Market Analysis, Insights and Forecast 2021-2033
- 5.1. Market Analysis, Insights and Forecast - by Crop Typ
- 5.1.1. Food Crops/Cereals
- 5.1.2. Fruits
- 5.1.3. Vegetables
- 5.2. Market Analysis, Insights and Forecast - by Crop Typ
- 5.2.1. Food Crops/Cereals
- 5.2.2. Fruits
- 5.2.3. Vegetables
- 5.3. Market Analysis, Insights and Forecast - by Region
- 5.3.1. North America
- 5.3.2. South America
- 5.3.3. Europe
- 5.3.4. Middle East & Africa
- 5.3.5. Asia Pacific
- 5.1. Market Analysis, Insights and Forecast - by Crop Typ
- 6. Global Agriculture Market in Tanzania Analysis, Insights and Forecast, 2021-2033
- 6.1. Market Analysis, Insights and Forecast - by Crop Typ
- 6.1.1. Food Crops/Cereals
- 6.1.2. Fruits
- 6.1.3. Vegetables
- 6.2. Market Analysis, Insights and Forecast - by Crop Typ
- 6.2.1. Food Crops/Cereals
- 6.2.2. Fruits
- 6.2.3. Vegetables
- 6.1. Market Analysis, Insights and Forecast - by Crop Typ
- 7. North America Agriculture Market in Tanzania Analysis, Insights and Forecast, 2020-2032
- 7.1. Market Analysis, Insights and Forecast - by Crop Typ
- 7.1.1. Food Crops/Cereals
- 7.1.2. Fruits
- 7.1.3. Vegetables
- 7.2. Market Analysis, Insights and Forecast - by Crop Typ
- 7.2.1. Food Crops/Cereals
- 7.2.2. Fruits
- 7.2.3. Vegetables
- 7.1. Market Analysis, Insights and Forecast - by Crop Typ
- 8. South America Agriculture Market in Tanzania Analysis, Insights and Forecast, 2020-2032
- 8.1. Market Analysis, Insights and Forecast - by Crop Typ
- 8.1.1. Food Crops/Cereals
- 8.1.2. Fruits
- 8.1.3. Vegetables
- 8.2. Market Analysis, Insights and Forecast - by Crop Typ
- 8.2.1. Food Crops/Cereals
- 8.2.2. Fruits
- 8.2.3. Vegetables
- 8.1. Market Analysis, Insights and Forecast - by Crop Typ
- 9. Europe Agriculture Market in Tanzania Analysis, Insights and Forecast, 2020-2032
- 9.1. Market Analysis, Insights and Forecast - by Crop Typ
- 9.1.1. Food Crops/Cereals
- 9.1.2. Fruits
- 9.1.3. Vegetables
- 9.2. Market Analysis, Insights and Forecast - by Crop Typ
- 9.2.1. Food Crops/Cereals
- 9.2.2. Fruits
- 9.2.3. Vegetables
- 9.1. Market Analysis, Insights and Forecast - by Crop Typ
- 10. Middle East & Africa Agriculture Market in Tanzania Analysis, Insights and Forecast, 2020-2032
- 10.1. Market Analysis, Insights and Forecast - by Crop Typ
- 10.1.1. Food Crops/Cereals
- 10.1.2. Fruits
- 10.1.3. Vegetables
- 10.2. Market Analysis, Insights and Forecast - by Crop Typ
- 10.2.1. Food Crops/Cereals
- 10.2.2. Fruits
- 10.2.3. Vegetables
- 10.1. Market Analysis, Insights and Forecast - by Crop Typ
- 11. Asia Pacific Agriculture Market in Tanzania Analysis, Insights and Forecast, 2020-2032
- 11.1. Market Analysis, Insights and Forecast - by Crop Typ
- 11.1.1. Food Crops/Cereals
- 11.1.2. Fruits
- 11.1.3. Vegetables
- 11.2. Market Analysis, Insights and Forecast - by Crop Typ
- 11.2.1. Food Crops/Cereals
- 11.2.2. Fruits
- 11.2.3. Vegetables
- 11.1. Market Analysis, Insights and Forecast - by Crop Typ
- 12. Competitive Analysis
- 12.1. Company Profiles
- 12.1.1 Syngenta
- 12.1.1.1. Company Overview
- 12.1.1.2. Products
- 12.1.1.3. Company Financials
- 12.1.1.4. SWOT Analysis
- 12.1.2 Tanzania Horticultural Association (THA)
- 12.1.2.1. Company Overview
- 12.1.2.2. Products
- 12.1.2.3. Company Financials
- 12.1.2.4. SWOT Analysis
- 12.1.3 Tanzania Agricultural Development Bank
- 12.1.3.1. Company Overview
- 12.1.3.2. Products
- 12.1.3.3. Company Financials
- 12.1.3.4. SWOT Analysis
- 12.1.4 Tanzania Fertilizer Company
- 12.1.4.1. Company Overview
- 12.1.4.2. Products
- 12.1.4.3. Company Financials
- 12.1.4.4. SWOT Analysis
- 12.1.5 Kilombero Plantations Ltd
- 12.1.5.1. Company Overview
- 12.1.5.2. Products
- 12.1.5.3. Company Financials
- 12.1.5.4. SWOT Analysis
- 12.1.6 Rijk Zwaan
- 12.1.6.1. Company Overview
- 12.1.6.2. Products
- 12.1.6.3. Company Financials
- 12.1.6.4. SWOT Analysis
- 12.1.7 Monsanto
- 12.1.7.1. Company Overview
- 12.1.7.2. Products
- 12.1.7.3. Company Financials
- 12.1.7.4. SWOT Analysis
- 12.1.8 Tanzania Breweries Limited
- 12.1.8.1. Company Overview
- 12.1.8.2. Products
- 12.1.8.3. Company Financials
- 12.1.8.4. SWOT Analysis
- 12.1.9 Kilimanjaro Agro Inputs Ltd
- 12.1.9.1. Company Overview
- 12.1.9.2. Products
- 12.1.9.3. Company Financials
- 12.1.9.4. SWOT Analysis
- 12.1.10 Tanzania Seed Trade Association (TASTA)
- 12.1.10.1. Company Overview
- 12.1.10.2. Products
- 12.1.10.3. Company Financials
- 12.1.10.4. SWOT Analysis
- 12.1.1 Syngenta
- 12.2. Market Entropy
- 12.2.1 Company's Key Areas Served
- 12.2.2 Recent Developments
- 12.3. Company Market Share Analysis 2025
- 12.3.1 Top 5 Companies Market Share Analysis
- 12.3.2 Top 3 Companies Market Share Analysis
- 12.4. List of Potential Customers
- 13. Research Methodology
List of Figures
- Figure 1: Global Agriculture Market in Tanzania Revenue Breakdown (Million, %) by Region 2025 & 2033
- Figure 2: North America Agriculture Market in Tanzania Revenue (Million), by Crop Typ 2025 & 2033
- Figure 3: North America Agriculture Market in Tanzania Revenue Share (%), by Crop Typ 2025 & 2033
- Figure 4: North America Agriculture Market in Tanzania Revenue (Million), by Crop Typ 2025 & 2033
- Figure 5: North America Agriculture Market in Tanzania Revenue Share (%), by Crop Typ 2025 & 2033
- Figure 6: North America Agriculture Market in Tanzania Revenue (Million), by Country 2025 & 2033
- Figure 7: North America Agriculture Market in Tanzania Revenue Share (%), by Country 2025 & 2033
- Figure 8: South America Agriculture Market in Tanzania Revenue (Million), by Crop Typ 2025 & 2033
- Figure 9: South America Agriculture Market in Tanzania Revenue Share (%), by Crop Typ 2025 & 2033
- Figure 10: South America Agriculture Market in Tanzania Revenue (Million), by Crop Typ 2025 & 2033
- Figure 11: South America Agriculture Market in Tanzania Revenue Share (%), by Crop Typ 2025 & 2033
- Figure 12: South America Agriculture Market in Tanzania Revenue (Million), by Country 2025 & 2033
- Figure 13: South America Agriculture Market in Tanzania Revenue Share (%), by Country 2025 & 2033
- Figure 14: Europe Agriculture Market in Tanzania Revenue (Million), by Crop Typ 2025 & 2033
- Figure 15: Europe Agriculture Market in Tanzania Revenue Share (%), by Crop Typ 2025 & 2033
- Figure 16: Europe Agriculture Market in Tanzania Revenue (Million), by Crop Typ 2025 & 2033
- Figure 17: Europe Agriculture Market in Tanzania Revenue Share (%), by Crop Typ 2025 & 2033
- Figure 18: Europe Agriculture Market in Tanzania Revenue (Million), by Country 2025 & 2033
- Figure 19: Europe Agriculture Market in Tanzania Revenue Share (%), by Country 2025 & 2033
- Figure 20: Middle East & Africa Agriculture Market in Tanzania Revenue (Million), by Crop Typ 2025 & 2033
- Figure 21: Middle East & Africa Agriculture Market in Tanzania Revenue Share (%), by Crop Typ 2025 & 2033
- Figure 22: Middle East & Africa Agriculture Market in Tanzania Revenue (Million), by Crop Typ 2025 & 2033
- Figure 23: Middle East & Africa Agriculture Market in Tanzania Revenue Share (%), by Crop Typ 2025 & 2033
- Figure 24: Middle East & Africa Agriculture Market in Tanzania Revenue (Million), by Country 2025 & 2033
- Figure 25: Middle East & Africa Agriculture Market in Tanzania Revenue Share (%), by Country 2025 & 2033
- Figure 26: Asia Pacific Agriculture Market in Tanzania Revenue (Million), by Crop Typ 2025 & 2033
- Figure 27: Asia Pacific Agriculture Market in Tanzania Revenue Share (%), by Crop Typ 2025 & 2033
- Figure 28: Asia Pacific Agriculture Market in Tanzania Revenue (Million), by Crop Typ 2025 & 2033
- Figure 29: Asia Pacific Agriculture Market in Tanzania Revenue Share (%), by Crop Typ 2025 & 2033
- Figure 30: Asia Pacific Agriculture Market in Tanzania Revenue (Million), by Country 2025 & 2033
- Figure 31: Asia Pacific Agriculture Market in Tanzania Revenue Share (%), by Country 2025 & 2033
List of Tables
- Table 1: Global Agriculture Market in Tanzania Revenue Million Forecast, by Crop Typ 2020 & 2033
- Table 2: Global Agriculture Market in Tanzania Revenue Million Forecast, by Crop Typ 2020 & 2033
- Table 3: Global Agriculture Market in Tanzania Revenue Million Forecast, by Region 2020 & 2033
- Table 4: Global Agriculture Market in Tanzania Revenue Million Forecast, by Crop Typ 2020 & 2033
- Table 5: Global Agriculture Market in Tanzania Revenue Million Forecast, by Crop Typ 2020 & 2033
- Table 6: Global Agriculture Market in Tanzania Revenue Million Forecast, by Country 2020 & 2033
- Table 7: United States Agriculture Market in Tanzania Revenue (Million) Forecast, by Application 2020 & 2033
- Table 8: Canada Agriculture Market in Tanzania Revenue (Million) Forecast, by Application 2020 & 2033
- Table 9: Mexico Agriculture Market in Tanzania Revenue (Million) Forecast, by Application 2020 & 2033
- Table 10: Global Agriculture Market in Tanzania Revenue Million Forecast, by Crop Typ 2020 & 2033
- Table 11: Global Agriculture Market in Tanzania Revenue Million Forecast, by Crop Typ 2020 & 2033
- Table 12: Global Agriculture Market in Tanzania Revenue Million Forecast, by Country 2020 & 2033
- Table 13: Brazil Agriculture Market in Tanzania Revenue (Million) Forecast, by Application 2020 & 2033
- Table 14: Argentina Agriculture Market in Tanzania Revenue (Million) Forecast, by Application 2020 & 2033
- Table 15: Rest of South America Agriculture Market in Tanzania Revenue (Million) Forecast, by Application 2020 & 2033
- Table 16: Global Agriculture Market in Tanzania Revenue Million Forecast, by Crop Typ 2020 & 2033
- Table 17: Global Agriculture Market in Tanzania Revenue Million Forecast, by Crop Typ 2020 & 2033
- Table 18: Global Agriculture Market in Tanzania Revenue Million Forecast, by Country 2020 & 2033
- Table 19: United Kingdom Agriculture Market in Tanzania Revenue (Million) Forecast, by Application 2020 & 2033
- Table 20: Germany Agriculture Market in Tanzania Revenue (Million) Forecast, by Application 2020 & 2033
- Table 21: France Agriculture Market in Tanzania Revenue (Million) Forecast, by Application 2020 & 2033
- Table 22: Italy Agriculture Market in Tanzania Revenue (Million) Forecast, by Application 2020 & 2033
- Table 23: Spain Agriculture Market in Tanzania Revenue (Million) Forecast, by Application 2020 & 2033
- Table 24: Russia Agriculture Market in Tanzania Revenue (Million) Forecast, by Application 2020 & 2033
- Table 25: Benelux Agriculture Market in Tanzania Revenue (Million) Forecast, by Application 2020 & 2033
- Table 26: Nordics Agriculture Market in Tanzania Revenue (Million) Forecast, by Application 2020 & 2033
- Table 27: Rest of Europe Agriculture Market in Tanzania Revenue (Million) Forecast, by Application 2020 & 2033
- Table 28: Global Agriculture Market in Tanzania Revenue Million Forecast, by Crop Typ 2020 & 2033
- Table 29: Global Agriculture Market in Tanzania Revenue Million Forecast, by Crop Typ 2020 & 2033
- Table 30: Global Agriculture Market in Tanzania Revenue Million Forecast, by Country 2020 & 2033
- Table 31: Turkey Agriculture Market in Tanzania Revenue (Million) Forecast, by Application 2020 & 2033
- Table 32: Israel Agriculture Market in Tanzania Revenue (Million) Forecast, by Application 2020 & 2033
- Table 33: GCC Agriculture Market in Tanzania Revenue (Million) Forecast, by Application 2020 & 2033
- Table 34: North Africa Agriculture Market in Tanzania Revenue (Million) Forecast, by Application 2020 & 2033
- Table 35: South Africa Agriculture Market in Tanzania Revenue (Million) Forecast, by Application 2020 & 2033
- Table 36: Rest of Middle East & Africa Agriculture Market in Tanzania Revenue (Million) Forecast, by Application 2020 & 2033
- Table 37: Global Agriculture Market in Tanzania Revenue Million Forecast, by Crop Typ 2020 & 2033
- Table 38: Global Agriculture Market in Tanzania Revenue Million Forecast, by Crop Typ 2020 & 2033
- Table 39: Global Agriculture Market in Tanzania Revenue Million Forecast, by Country 2020 & 2033
- Table 40: China Agriculture Market in Tanzania Revenue (Million) Forecast, by Application 2020 & 2033
- Table 41: India Agriculture Market in Tanzania Revenue (Million) Forecast, by Application 2020 & 2033
- Table 42: Japan Agriculture Market in Tanzania Revenue (Million) Forecast, by Application 2020 & 2033
- Table 43: South Korea Agriculture Market in Tanzania Revenue (Million) Forecast, by Application 2020 & 2033
- Table 44: ASEAN Agriculture Market in Tanzania Revenue (Million) Forecast, by Application 2020 & 2033
- Table 45: Oceania Agriculture Market in Tanzania Revenue (Million) Forecast, by Application 2020 & 2033
- Table 46: Rest of Asia Pacific Agriculture Market in Tanzania Revenue (Million) Forecast, by Application 2020 & 2033
Frequently Asked Questions
1. What is the projected Compound Annual Growth Rate (CAGR) of the Agriculture Market in Tanzania?
The projected CAGR is approximately 5.63%.
2. Which companies are prominent players in the Agriculture Market in Tanzania?
Key companies in the market include Syngenta , Tanzania Horticultural Association (THA) , Tanzania Agricultural Development Bank , Tanzania Fertilizer Company , Kilombero Plantations Ltd , Rijk Zwaan , Monsanto , Tanzania Breweries Limited , Kilimanjaro Agro Inputs Ltd , Tanzania Seed Trade Association (TASTA).
3. What are the main segments of the Agriculture Market in Tanzania?
The market segments include Crop Typ, Crop Typ.
4. Can you provide details about the market size?
The market size is estimated to be USD 17.44 Million as of 2022.
5. What are some drivers contributing to market growth?
Increasing Adoption of Technology in Horticulture; Government Initiatives for Self-reliance in Vegetable and Fruit Farming.
6. What are the notable trends driving market growth?
Favorable Government Policies Supporting the Market Growth.
7. Are there any restraints impacting market growth?
Limited Resource Availability and Unfavourable Climatic Condition; Increasing Reliance on Imports for Domestic Supply.
8. Can you provide examples of recent developments in the market?
September 2022: Tanzania's Ministry of Agriculture directed the Tanzania Agriculture Research Institute (TARI) to find a location for genetically engineered (GE) crop trials. This decision appeared to overturn the Tanzanian government's (GoT) 2021 ban on all GE crop research trials.
9. What pricing options are available for accessing the report?
Pricing options include single-user, multi-user, and enterprise licenses priced at USD 3800, USD 4500, and USD 5800 respectively.
10. Is the market size provided in terms of value or volume?
The market size is provided in terms of value, measured in Million.
11. Are there any specific market keywords associated with the report?
Yes, the market keyword associated with the report is "Agriculture Market in Tanzania," which aids in identifying and referencing the specific market segment covered.
12. How do I determine which pricing option suits my needs best?
The pricing options vary based on user requirements and access needs. Individual users may opt for single-user licenses, while businesses requiring broader access may choose multi-user or enterprise licenses for cost-effective access to the report.
13. Are there any additional resources or data provided in the Agriculture Market in Tanzania report?
While the report offers comprehensive insights, it's advisable to review the specific contents or supplementary materials provided to ascertain if additional resources or data are available.
14. How can I stay updated on further developments or reports in the Agriculture Market in Tanzania?
To stay informed about further developments, trends, and reports in the Agriculture Market in Tanzania, consider subscribing to industry newsletters, following relevant companies and organizations, or regularly checking reputable industry news sources and publications.
Methodology
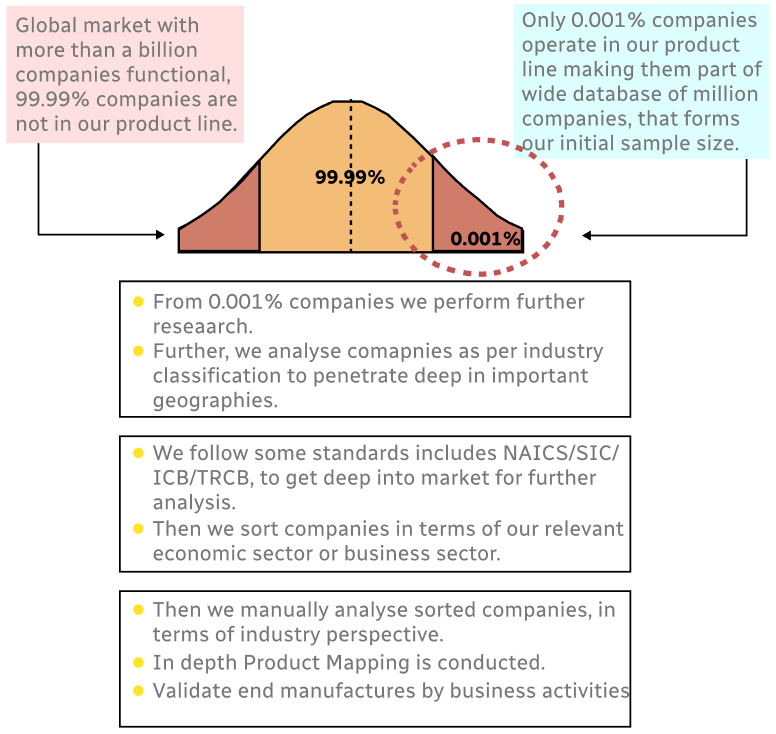
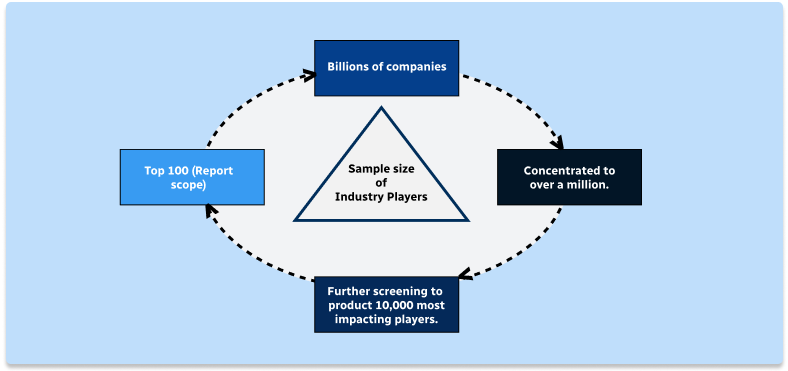
Step 1 - Identification of Relevant Samples Size from Population Database
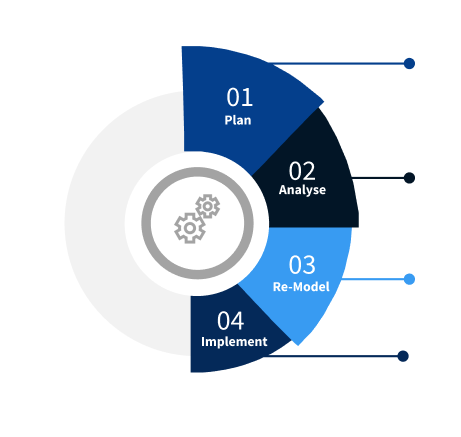
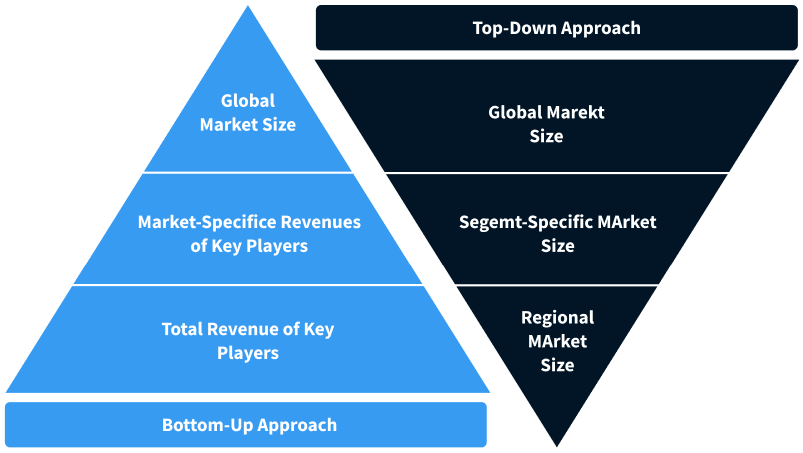
Step 2 - Approaches for Defining Global Market Size (Value, Volume* & Price*)
Note*: In applicable scenarios
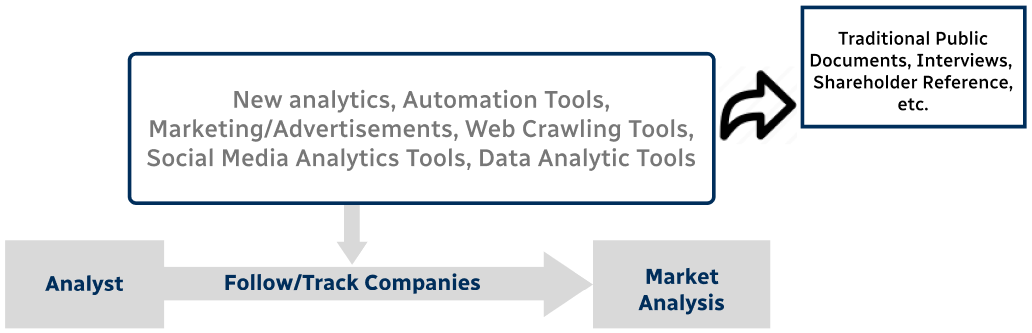
Step 3 - Data Sources
Primary Research
- Web Analytics
- Survey Reports
- Research Institute
- Latest Research Reports
- Opinion Leaders
Secondary Research
- Annual Reports
- White Paper
- Latest Press Release
- Industry Association
- Paid Database
- Investor Presentations
Step 4 - Data Triangulation
Involves using different sources of information in order to increase the validity of a study
These sources are likely to be stakeholders in a program - participants, other researchers, program staff, other community members, and so on.
Then we put all data in single framework & apply various statistical tools to find out the dynamic on the market.
During the analysis stage, feedback from the stakeholder groups would be compared to determine areas of agreement as well as areas of divergence