

Key Insights
The US Bio-fungicides market is poised for robust expansion, projected to reach an estimated $0.96 million by 2025, driven by a compelling Compound Annual Growth Rate (CAGR) of 9.50% through 2033. This significant growth is underpinned by a confluence of factors, including increasing consumer demand for sustainably produced agricultural goods, heightened awareness regarding the environmental and health risks associated with synthetic fungicides, and stringent governmental regulations favoring greener agricultural practices. The sector's expansion is further propelled by continuous innovation in biological control agents, leading to more effective and diverse bio-fungicide formulations. Key segments like Production Analysis, Consumption Analysis, and Import/Export Market Analysis all point towards an upward trajectory, reflecting the growing adoption of these eco-friendly solutions across various agricultural applications.
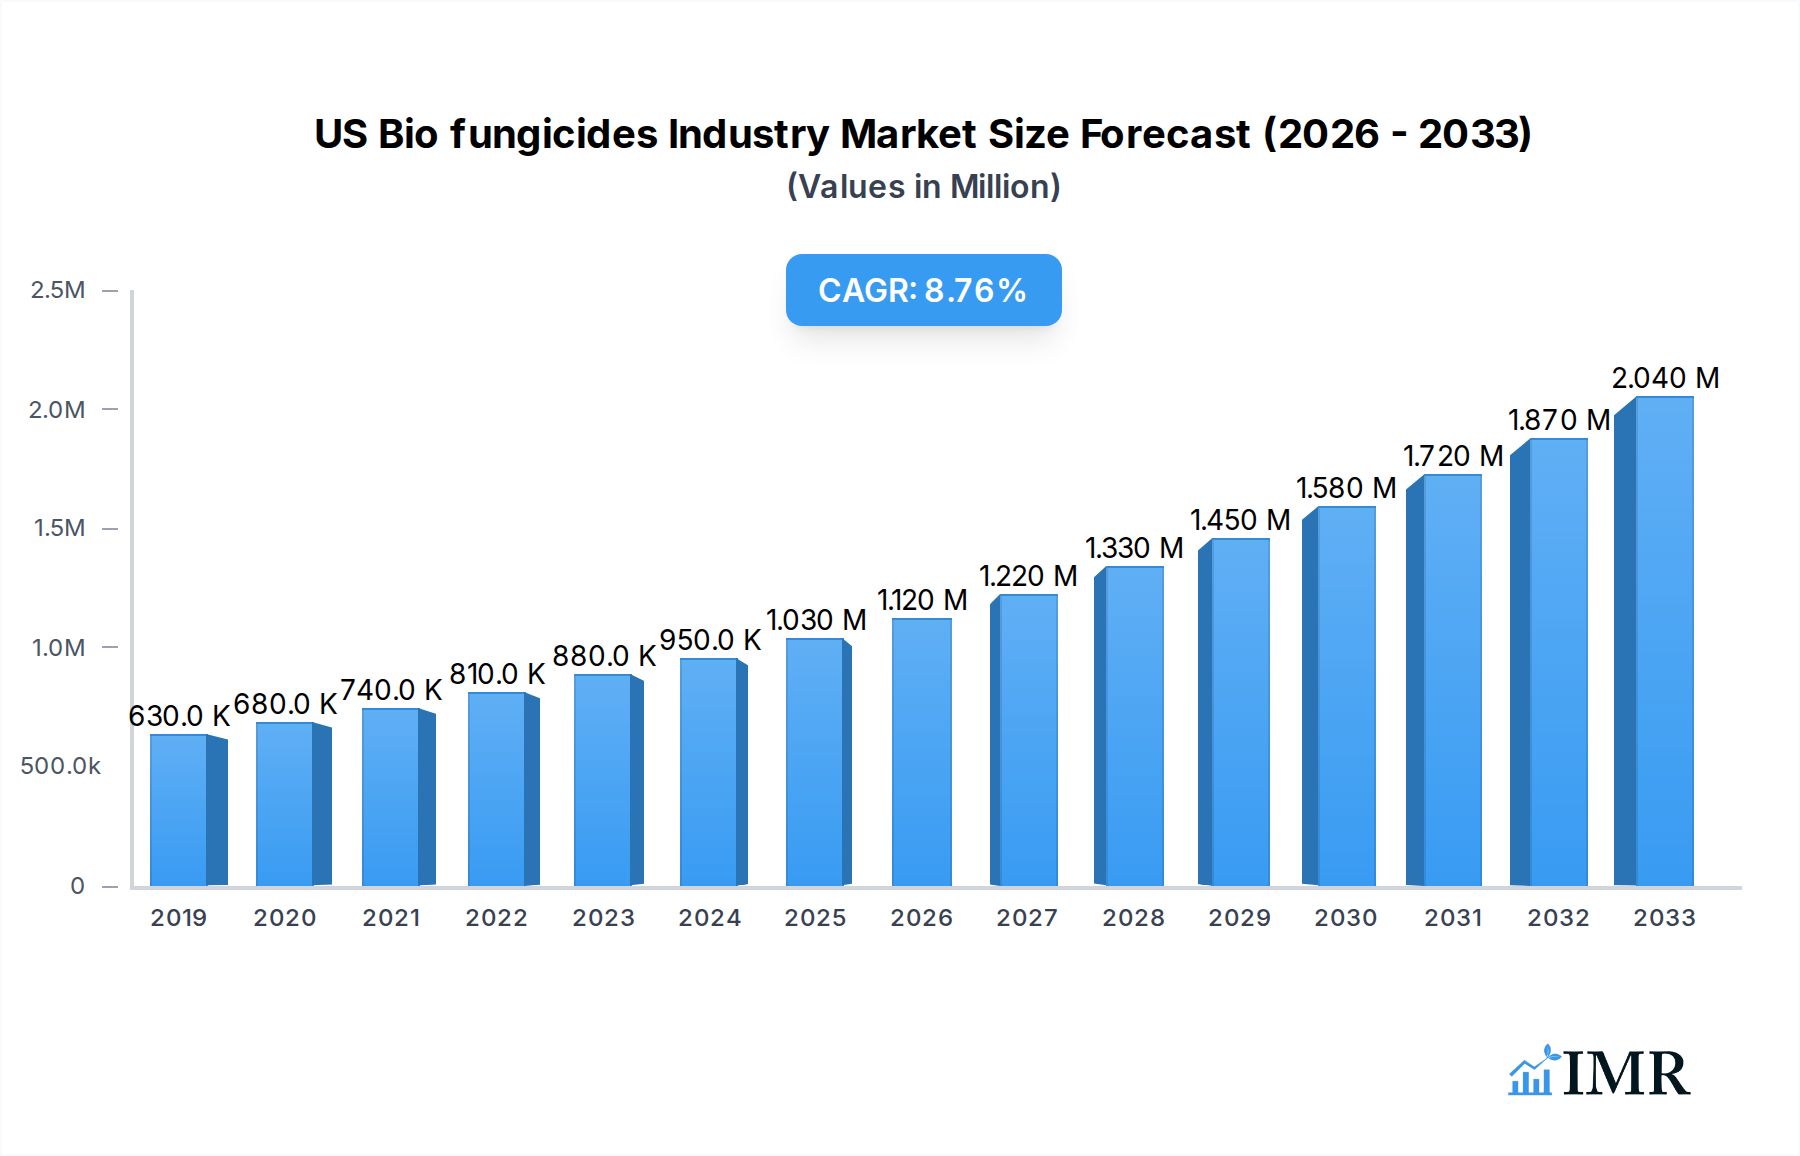
US Bio fungicides Industry Market Size (In Million)
The bio-fungicides industry in the US is characterized by dynamic trends, including the development of microbial and biochemical bio-fungicides, tailored formulations for specific crops and diseases, and integrated pest management (IPM) strategies. Emerging technologies and research are continually enhancing the efficacy and shelf-life of these biological agents. While the market benefits from strong drivers, certain restraints, such as the perceived higher initial cost of some bio-fungicides and the need for enhanced farmer education on their application and benefits, need to be addressed. However, the long-term outlook remains overwhelmingly positive, with established companies like BioWorks Inc., Novozyme Biologicals, and Marrone Bio Innovations, alongside emerging players, actively contributing to market development. The strategic focus on research and development, coupled with supportive policies, is expected to solidify the dominance of bio-fungicides in the US agricultural landscape.

US Bio fungicides Industry Company Market Share
US Bio fungicides Industry Market Dynamics & Structure
The US bio fungicides market exhibits a dynamic and evolving landscape, characterized by increasing concentration of key players and significant technological innovation drivers. Regulatory frameworks, particularly those from the EPA, are instrumental in shaping market entry and product development, emphasizing safety and efficacy. Competitive product substitutes, including synthetic fungicides and integrated pest management (IPM) strategies, necessitate continuous innovation and differentiation within the bio fungicide segment. End-user demographics are shifting, with a growing demand from organic agriculture, specialty crops, and horticulture sectors seeking sustainable solutions. Mergers & Acquisitions (M&A) trends are a notable feature, with established agrochemical giants acquiring or partnering with smaller bio-tech firms to bolster their biological portfolio. For instance, the integration of bio-solutions into broader crop protection strategies is becoming paramount.
- Market Concentration: While a few large players hold significant market share, the market is also characterized by a growing number of specialized bio-control developers.
- Technological Innovation Drivers: Advancements in microbial fermentation, genetic engineering for enhanced efficacy, and formulation technologies are key drivers.
- Regulatory Frameworks: EPA approval processes and state-level regulations significantly influence product adoption and R&D investments.
- Competitive Product Substitutes: Synthetic fungicides, while facing environmental scrutiny, remain a strong competitive force.
- End-User Demographics: Increasing adoption in organic farming, controlled environment agriculture, and urban farming.
- M&A Trends: Strategic acquisitions and partnerships are consolidating the market and expanding product offerings.
US Bio fungicides Industry Growth Trends & Insights
The US bio fungicides market is poised for substantial growth, driven by a confluence of increasing environmental consciousness, evolving agricultural practices, and advancements in biological control technologies. The market size has witnessed a steady evolution, fueled by heightened awareness regarding the environmental impact of synthetic pesticides and a growing demand for sustainable agricultural inputs. Adoption rates are accelerating across various crop segments, including field crops, fruits, vegetables, and turf & ornamental. Technological disruptions, such as the discovery and application of novel microbial strains with enhanced fungicidal properties, are reshaping the competitive landscape. Precision agriculture techniques are also facilitating more targeted and efficient application of bio fungicides, further boosting their appeal. Consumer behavior shifts, with an increasing preference for organically grown produce and a stronger demand for transparency in food production, are indirectly stimulating the uptake of bio-based solutions in agriculture.
The forecast period (2025–2033) is expected to witness a robust Compound Annual Growth Rate (CAGR) as the market matures. Market penetration, historically limited to niche applications, is expanding into broader agricultural operations. The development of more stable and potent bio fungicide formulations, coupled with improved delivery systems, is addressing previous limitations and enhancing farmer confidence. Furthermore, favorable government policies and incentives promoting sustainable agriculture are acting as significant catalysts. The intrinsic benefits of bio fungicides, including reduced residue levels, improved soil health, and lower environmental impact, are becoming increasingly recognized by both regulators and end-users. The exploration of new biological targets and mechanisms of action is also contributing to a diversified and innovative product pipeline. This sustained growth trajectory is indicative of a fundamental shift in agricultural pest management strategies, with bio fungicides emerging as a cornerstone of modern, sustainable farming.
Dominant Regions, Countries, or Segments in US Bio fungicides Industry
The Consumption Analysis segment is currently the dominant force driving growth in the US bio fungicides industry, with a significant concentration of demand originating from key agricultural regions. California, a leader in both the value and volume of agricultural production, exhibits the highest consumption of bio fungicides, driven by its extensive cultivation of fruits, vegetables, and specialty crops. These sectors have a particularly high demand for integrated pest management (IPM) strategies and organic farming practices, where bio fungicides offer a viable and often preferred alternative to synthetic chemistries. The state's stringent environmental regulations and consumer preference for sustainably grown produce further amplify this demand.
- Key Drivers in Consumption:
- Organic Farming Expansion: The burgeoning organic agriculture sector mandates the use of approved bio-based pest control solutions.
- Specialty Crop Demand: High-value fruits and vegetables often require targeted pest management with minimal residue concerns.
- Environmental Regulations: Stricter policies on synthetic pesticide use encourage the adoption of biological alternatives.
- Consumer Preference: Growing consumer demand for organically certified and sustainably produced food.
- Technological Advancements in Application: Improved formulations and delivery systems enhance the efficacy and ease of use of bio fungicides.
Beyond California, other significant consumption hubs include the Midwest, particularly for field crops and horticulture, and the Southeast for specialty crops and turf management. The Production Analysis is also concentrated in regions with strong biotech research infrastructure and access to raw materials, often co-located or strategically positioned to serve these major consumption areas. The Import Market Analysis is crucial, with a substantial volume of bio fungicides entering the US to supplement domestic production and offer a wider range of specialized products. Key importing countries often possess advanced biological control research and development capabilities. Conversely, the Export Market Analysis is growing, as US-based companies increasingly offer innovative bio fungicide solutions to international markets, driven by their R&D prowess and established quality standards. The Price Trend Analysis indicates a gradual convergence, with competitive pressures and increased production scale leading to more accessible pricing for bio fungicides, further encouraging wider adoption across all segments.
US Bio fungicides Industry Product Landscape
The US bio fungicides industry is characterized by a rapidly expanding product landscape focused on natural efficacy and sustainability. Innovations center on harnessing the power of beneficial microorganisms like Bacillus, Trichoderma, and Pseudomonas species, as well as plant extracts and biochemicals, to combat a broad spectrum of plant pathogens. Applications range from pre-plant seed treatments and in-furrow applications to foliar sprays and post-harvest protection across diverse crops such as corn, soybeans, grapes, tomatoes, and turfgrass. Performance metrics emphasize high efficacy against specific diseases, rapid action, and a favorable environmental profile with no harmful residues. Unique selling propositions often include enhanced plant health benefits, improved crop yield, and resistance management capabilities, distinguishing them from conventional chemical fungicides.
Key Drivers, Barriers & Challenges in US Bio fungicides Industry
Key Drivers:
- Growing demand for sustainable agriculture: Increasing consumer and regulatory pressure for environmentally friendly farming practices.
- Technological advancements in microbial research and formulation: Development of more potent, stable, and easy-to-apply bio fungicide products.
- Favorable government policies and incentives: Support for organic farming and biological pest management solutions.
- Resistance management needs: Bio fungicides offer alternative modes of action to combat pathogen resistance to synthetic chemicals.
- Improved efficacy and broad-spectrum activity: Ongoing research is expanding the range of diseases and crops that bio fungicides can effectively manage.
Key Barriers & Challenges:
- Perceived efficacy and farmer adoption: Overcoming skepticism and demonstrating consistent performance compared to established synthetic options.
- Shelf-life and stability concerns: Developing formulations that maintain viability and efficacy during storage and application.
- Cost competitiveness: Higher initial production costs can make bio fungicides more expensive than some synthetic alternatives.
- Regulatory hurdles and approval timelines: Navigating complex registration processes can be time-consuming and costly.
- Limited awareness and knowledge gaps: Educating growers on proper application techniques and the benefits of bio fungicides.
- Supply chain complexities: Ensuring consistent availability of high-quality microbial strains and raw materials.
- Environmental variability: Bio fungicide efficacy can be influenced by environmental conditions such as temperature and humidity.
Emerging Opportunities in US Bio fungicides Industry
Emerging opportunities in the US bio fungicides industry lie in the expanding applications for controlled environment agriculture (CEA) and vertical farming, where precise environmental control can optimize bio fungicide performance. The development of hyper-specific bio fungicides targeting emerging or niche plant diseases presents a significant untapped market. Furthermore, the integration of bio fungicides into digital farming platforms and precision agriculture technologies offers opportunities for enhanced targeting, reduced application rates, and real-time performance monitoring. Growing consumer interest in food traceability and “clean label” products is also creating demand for bio-based solutions that align with these preferences.
Growth Accelerators in the US Bio fungicides Industry Industry
The long-term growth of the US bio fungicides industry is being significantly accelerated by ongoing breakthroughs in genomic sequencing and the discovery of novel microbial strains with potent fungicidal properties. Strategic partnerships between leading agrochemical companies and innovative bio-tech startups are crucial for accelerating R&D and expanding market reach. Furthermore, the increasing adoption of bio fungicides in large-scale commercial agriculture, moving beyond niche organic markets, signifies a critical market expansion strategy. The development of integrated crop management programs that strategically combine bio fungicides with other sustainable pest control methods also acts as a significant growth accelerator by demonstrating synergistic benefits.
Key Players Shaping the US Bio fungicides Industry Market
- BioWorks Inc
- Novozyme Biologicals
- Isagro USA
- Marrone Bio Innovations
- Valent BioSciences LLC
- Syngenta AG
- De Sangosse Lt
- Certis USA LLC
Notable Milestones in US Bio fungicides Industry Sector
- 2019: Marrone Bio Innovations receives EPA approval for Regalia® Maia, a new biofungicide for broad-spectrum disease control.
- 2020: Valent BioSciences LLC launches MycoGuard™, a new line of microbial fungicides for turf and ornamental applications.
- 2021: Novozyme Biologicals expands its bio-solutions portfolio through strategic acquisitions, enhancing its offerings in the agricultural sector.
- 2022: Syngenta AG increases investment in its biologicals division, signaling a strong commitment to developing and commercializing bio fungicide solutions.
- 2023: Certis USA LLC introduces a new biofungicide product demonstrating enhanced efficacy against key soil-borne pathogens.
- 2024: BioWorks Inc announces advancements in its proprietary fermentation technology, leading to more stable and potent bio fungicide formulations.
In-Depth US Bio fungicides Industry Market Outlook
The US bio fungicides industry is set for robust expansion, driven by a paradigm shift towards sustainable agriculture and the increasing efficacy of biological solutions. Growth accelerators include continued technological innovation in microbial discovery and formulation, strategic collaborations that expand market access and product portfolios, and the expanding integration of bio fungicides into mainstream agricultural practices. The market outlook is highly positive, with significant opportunities in addressing resistance management challenges and meeting the growing demand for reduced chemical inputs. Strategic focus on developing solutions for emerging crop diseases and expanding applications in specialty crops and non-traditional agricultural settings will further fuel market growth and solidify the position of bio fungicides as a vital component of modern crop protection.
US Bio fungicides Industry Segmentation
- 1. Production Analysis
- 2. Consumption Analysis
- 3. Import Market Analysis (Value & Volume)
- 4. Export Market Analysis (Value & Volume)
- 5. Price Trend Analysis
US Bio fungicides Industry Segmentation By Geography
-
1. North America
- 1.1. United States
- 1.2. Canada
- 1.3. Mexico
-
2. South America
- 2.1. Brazil
- 2.2. Argentina
- 2.3. Rest of South America
-
3. Europe
- 3.1. United Kingdom
- 3.2. Germany
- 3.3. France
- 3.4. Italy
- 3.5. Spain
- 3.6. Russia
- 3.7. Benelux
- 3.8. Nordics
- 3.9. Rest of Europe
-
4. Middle East & Africa
- 4.1. Turkey
- 4.2. Israel
- 4.3. GCC
- 4.4. North Africa
- 4.5. South Africa
- 4.6. Rest of Middle East & Africa
-
5. Asia Pacific
- 5.1. China
- 5.2. India
- 5.3. Japan
- 5.4. South Korea
- 5.5. ASEAN
- 5.6. Oceania
- 5.7. Rest of Asia Pacific
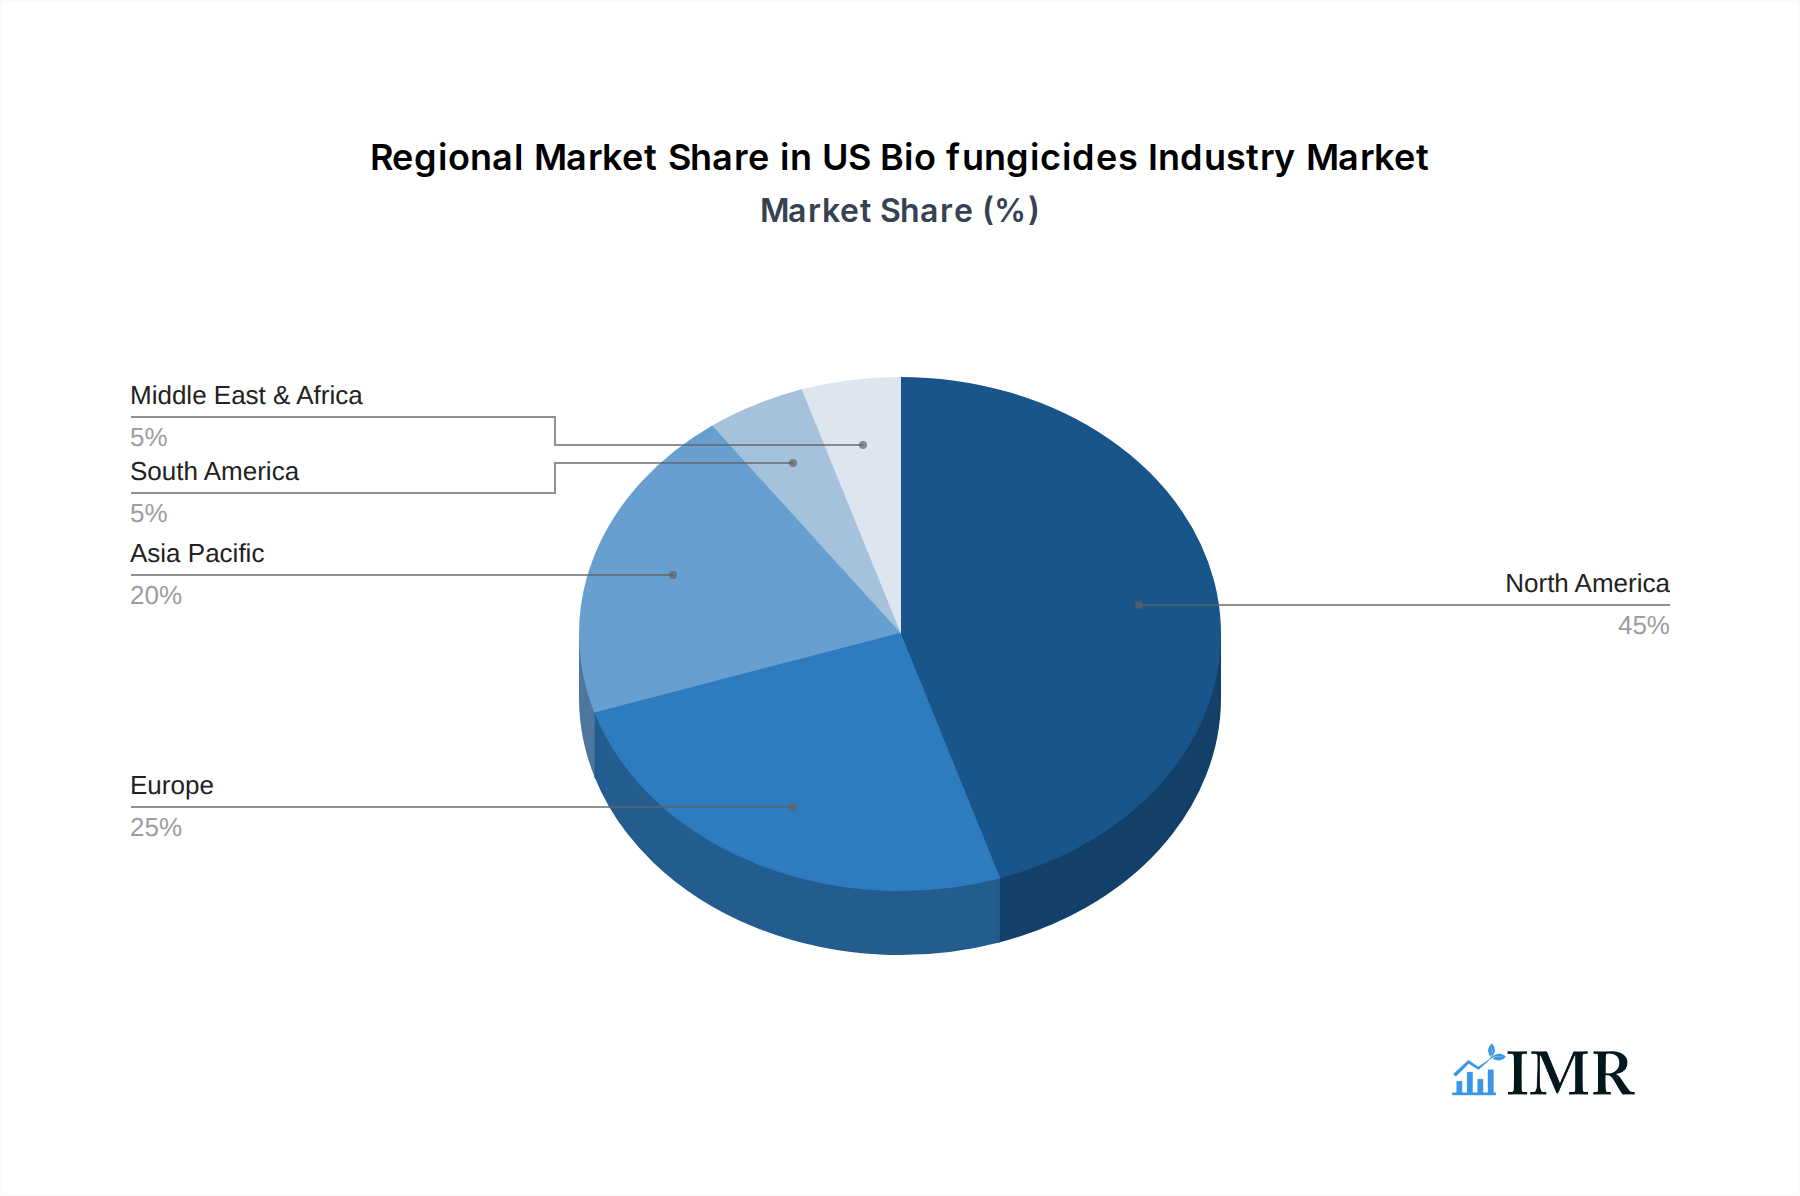
US Bio fungicides Industry Regional Market Share
Geographic Coverage of US Bio fungicides Industry
US Bio fungicides Industry REPORT HIGHLIGHTS
| Aspects | Details |
|---|---|
| Study Period | 2020-2034 |
| Base Year | 2025 |
| Estimated Year | 2026 |
| Forecast Period | 2026-2034 |
| Historical Period | 2020-2025 |
| Growth Rate | CAGR of 9.50% from 2020-2034 |
| Segmentation |
|
Table of Contents
- 1. Introduction
- 1.1. Research Scope
- 1.2. Market Segmentation
- 1.3. Research Objective
- 1.4. Definitions and Assumptions
- 2. Executive Summary
- 2.1. Market Snapshot
- 3. Market Dynamics
- 3.1. Market Drivers
- 3.2. Market Restrains
- 3.3. Market Trends
- 3.4. Market Opportunities
- 4. Market Factor Analysis
- 4.1. Porters Five Forces
- 4.1.1. Bargaining Power of Suppliers
- 4.1.2. Bargaining Power of Buyers
- 4.1.3. Threat of New Entrants
- 4.1.4. Threat of Substitutes
- 4.1.5. Competitive Rivalry
- 4.2. PESTEL analysis
- 4.3. BCG Analysis
- 4.3.1. Stars (High Growth, High Market Share)
- 4.3.2. Cash Cows (Low Growth, High Market Share)
- 4.3.3. Question Mark (High Growth, Low Market Share)
- 4.3.4. Dogs (Low Growth, Low Market Share)
- 4.4. Ansoff Matrix Analysis
- 4.5. Supply Chain Analysis
- 4.6. Regulatory Landscape
- 4.7. Current Market Potential and Opportunity Assessment (TAM–SAM–SOM Framework)
- 4.8. IMR Analyst Note
- 4.1. Porters Five Forces
- 5. Market Analysis, Insights and Forecast 2021-2033
- 5.1. Market Analysis, Insights and Forecast - by Production Analysis
- 5.2. Market Analysis, Insights and Forecast - by Consumption Analysis
- 5.3. Market Analysis, Insights and Forecast - by Import Market Analysis (Value & Volume)
- 5.4. Market Analysis, Insights and Forecast - by Export Market Analysis (Value & Volume)
- 5.5. Market Analysis, Insights and Forecast - by Price Trend Analysis
- 5.6. Market Analysis, Insights and Forecast - by Region
- 5.6.1. North America
- 5.6.2. South America
- 5.6.3. Europe
- 5.6.4. Middle East & Africa
- 5.6.5. Asia Pacific
- 6. Global US Bio fungicides Industry Analysis, Insights and Forecast, 2021-2033
- 6.1. Market Analysis, Insights and Forecast - by Production Analysis
- 6.2. Market Analysis, Insights and Forecast - by Consumption Analysis
- 6.3. Market Analysis, Insights and Forecast - by Import Market Analysis (Value & Volume)
- 6.4. Market Analysis, Insights and Forecast - by Export Market Analysis (Value & Volume)
- 6.5. Market Analysis, Insights and Forecast - by Price Trend Analysis
- 7. North America US Bio fungicides Industry Analysis, Insights and Forecast, 2020-2032
- 7.1. Market Analysis, Insights and Forecast - by Production Analysis
- 7.2. Market Analysis, Insights and Forecast - by Consumption Analysis
- 7.3. Market Analysis, Insights and Forecast - by Import Market Analysis (Value & Volume)
- 7.4. Market Analysis, Insights and Forecast - by Export Market Analysis (Value & Volume)
- 7.5. Market Analysis, Insights and Forecast - by Price Trend Analysis
- 8. South America US Bio fungicides Industry Analysis, Insights and Forecast, 2020-2032
- 8.1. Market Analysis, Insights and Forecast - by Production Analysis
- 8.2. Market Analysis, Insights and Forecast - by Consumption Analysis
- 8.3. Market Analysis, Insights and Forecast - by Import Market Analysis (Value & Volume)
- 8.4. Market Analysis, Insights and Forecast - by Export Market Analysis (Value & Volume)
- 8.5. Market Analysis, Insights and Forecast - by Price Trend Analysis
- 9. Europe US Bio fungicides Industry Analysis, Insights and Forecast, 2020-2032
- 9.1. Market Analysis, Insights and Forecast - by Production Analysis
- 9.2. Market Analysis, Insights and Forecast - by Consumption Analysis
- 9.3. Market Analysis, Insights and Forecast - by Import Market Analysis (Value & Volume)
- 9.4. Market Analysis, Insights and Forecast - by Export Market Analysis (Value & Volume)
- 9.5. Market Analysis, Insights and Forecast - by Price Trend Analysis
- 10. Middle East & Africa US Bio fungicides Industry Analysis, Insights and Forecast, 2020-2032
- 10.1. Market Analysis, Insights and Forecast - by Production Analysis
- 10.2. Market Analysis, Insights and Forecast - by Consumption Analysis
- 10.3. Market Analysis, Insights and Forecast - by Import Market Analysis (Value & Volume)
- 10.4. Market Analysis, Insights and Forecast - by Export Market Analysis (Value & Volume)
- 10.5. Market Analysis, Insights and Forecast - by Price Trend Analysis
- 11. Asia Pacific US Bio fungicides Industry Analysis, Insights and Forecast, 2020-2032
- 11.1. Market Analysis, Insights and Forecast - by Production Analysis
- 11.2. Market Analysis, Insights and Forecast - by Consumption Analysis
- 11.3. Market Analysis, Insights and Forecast - by Import Market Analysis (Value & Volume)
- 11.4. Market Analysis, Insights and Forecast - by Export Market Analysis (Value & Volume)
- 11.5. Market Analysis, Insights and Forecast - by Price Trend Analysis
- 12. Competitive Analysis
- 12.1. Company Profiles
- 12.1.1 BioWorks Inc
- 12.1.1.1. Company Overview
- 12.1.1.2. Products
- 12.1.1.3. Company Financials
- 12.1.1.4. SWOT Analysis
- 12.1.2 Novozyme Biologicals
- 12.1.2.1. Company Overview
- 12.1.2.2. Products
- 12.1.2.3. Company Financials
- 12.1.2.4. SWOT Analysis
- 12.1.3 Isagro USA
- 12.1.3.1. Company Overview
- 12.1.3.2. Products
- 12.1.3.3. Company Financials
- 12.1.3.4. SWOT Analysis
- 12.1.4 Marrone Bio Innovations
- 12.1.4.1. Company Overview
- 12.1.4.2. Products
- 12.1.4.3. Company Financials
- 12.1.4.4. SWOT Analysis
- 12.1.5 Valent BioSciences LLC
- 12.1.5.1. Company Overview
- 12.1.5.2. Products
- 12.1.5.3. Company Financials
- 12.1.5.4. SWOT Analysis
- 12.1.6 Syngenta AG
- 12.1.6.1. Company Overview
- 12.1.6.2. Products
- 12.1.6.3. Company Financials
- 12.1.6.4. SWOT Analysis
- 12.1.7 De Sangosse Lt
- 12.1.7.1. Company Overview
- 12.1.7.2. Products
- 12.1.7.3. Company Financials
- 12.1.7.4. SWOT Analysis
- 12.1.8 Certis USA LLC
- 12.1.8.1. Company Overview
- 12.1.8.2. Products
- 12.1.8.3. Company Financials
- 12.1.8.4. SWOT Analysis
- 12.1.1 BioWorks Inc
- 12.2. Market Entropy
- 12.2.1 Company's Key Areas Served
- 12.2.2 Recent Developments
- 12.3. Company Market Share Analysis 2025
- 12.3.1 Top 5 Companies Market Share Analysis
- 12.3.2 Top 3 Companies Market Share Analysis
- 12.4. List of Potential Customers
- 13. Research Methodology
List of Figures
- Figure 1: Global US Bio fungicides Industry Revenue Breakdown (Million, %) by Region 2025 & 2033
- Figure 2: North America US Bio fungicides Industry Revenue (Million), by Production Analysis 2025 & 2033
- Figure 3: North America US Bio fungicides Industry Revenue Share (%), by Production Analysis 2025 & 2033
- Figure 4: North America US Bio fungicides Industry Revenue (Million), by Consumption Analysis 2025 & 2033
- Figure 5: North America US Bio fungicides Industry Revenue Share (%), by Consumption Analysis 2025 & 2033
- Figure 6: North America US Bio fungicides Industry Revenue (Million), by Import Market Analysis (Value & Volume) 2025 & 2033
- Figure 7: North America US Bio fungicides Industry Revenue Share (%), by Import Market Analysis (Value & Volume) 2025 & 2033
- Figure 8: North America US Bio fungicides Industry Revenue (Million), by Export Market Analysis (Value & Volume) 2025 & 2033
- Figure 9: North America US Bio fungicides Industry Revenue Share (%), by Export Market Analysis (Value & Volume) 2025 & 2033
- Figure 10: North America US Bio fungicides Industry Revenue (Million), by Price Trend Analysis 2025 & 2033
- Figure 11: North America US Bio fungicides Industry Revenue Share (%), by Price Trend Analysis 2025 & 2033
- Figure 12: North America US Bio fungicides Industry Revenue (Million), by Country 2025 & 2033
- Figure 13: North America US Bio fungicides Industry Revenue Share (%), by Country 2025 & 2033
- Figure 14: South America US Bio fungicides Industry Revenue (Million), by Production Analysis 2025 & 2033
- Figure 15: South America US Bio fungicides Industry Revenue Share (%), by Production Analysis 2025 & 2033
- Figure 16: South America US Bio fungicides Industry Revenue (Million), by Consumption Analysis 2025 & 2033
- Figure 17: South America US Bio fungicides Industry Revenue Share (%), by Consumption Analysis 2025 & 2033
- Figure 18: South America US Bio fungicides Industry Revenue (Million), by Import Market Analysis (Value & Volume) 2025 & 2033
- Figure 19: South America US Bio fungicides Industry Revenue Share (%), by Import Market Analysis (Value & Volume) 2025 & 2033
- Figure 20: South America US Bio fungicides Industry Revenue (Million), by Export Market Analysis (Value & Volume) 2025 & 2033
- Figure 21: South America US Bio fungicides Industry Revenue Share (%), by Export Market Analysis (Value & Volume) 2025 & 2033
- Figure 22: South America US Bio fungicides Industry Revenue (Million), by Price Trend Analysis 2025 & 2033
- Figure 23: South America US Bio fungicides Industry Revenue Share (%), by Price Trend Analysis 2025 & 2033
- Figure 24: South America US Bio fungicides Industry Revenue (Million), by Country 2025 & 2033
- Figure 25: South America US Bio fungicides Industry Revenue Share (%), by Country 2025 & 2033
- Figure 26: Europe US Bio fungicides Industry Revenue (Million), by Production Analysis 2025 & 2033
- Figure 27: Europe US Bio fungicides Industry Revenue Share (%), by Production Analysis 2025 & 2033
- Figure 28: Europe US Bio fungicides Industry Revenue (Million), by Consumption Analysis 2025 & 2033
- Figure 29: Europe US Bio fungicides Industry Revenue Share (%), by Consumption Analysis 2025 & 2033
- Figure 30: Europe US Bio fungicides Industry Revenue (Million), by Import Market Analysis (Value & Volume) 2025 & 2033
- Figure 31: Europe US Bio fungicides Industry Revenue Share (%), by Import Market Analysis (Value & Volume) 2025 & 2033
- Figure 32: Europe US Bio fungicides Industry Revenue (Million), by Export Market Analysis (Value & Volume) 2025 & 2033
- Figure 33: Europe US Bio fungicides Industry Revenue Share (%), by Export Market Analysis (Value & Volume) 2025 & 2033
- Figure 34: Europe US Bio fungicides Industry Revenue (Million), by Price Trend Analysis 2025 & 2033
- Figure 35: Europe US Bio fungicides Industry Revenue Share (%), by Price Trend Analysis 2025 & 2033
- Figure 36: Europe US Bio fungicides Industry Revenue (Million), by Country 2025 & 2033
- Figure 37: Europe US Bio fungicides Industry Revenue Share (%), by Country 2025 & 2033
- Figure 38: Middle East & Africa US Bio fungicides Industry Revenue (Million), by Production Analysis 2025 & 2033
- Figure 39: Middle East & Africa US Bio fungicides Industry Revenue Share (%), by Production Analysis 2025 & 2033
- Figure 40: Middle East & Africa US Bio fungicides Industry Revenue (Million), by Consumption Analysis 2025 & 2033
- Figure 41: Middle East & Africa US Bio fungicides Industry Revenue Share (%), by Consumption Analysis 2025 & 2033
- Figure 42: Middle East & Africa US Bio fungicides Industry Revenue (Million), by Import Market Analysis (Value & Volume) 2025 & 2033
- Figure 43: Middle East & Africa US Bio fungicides Industry Revenue Share (%), by Import Market Analysis (Value & Volume) 2025 & 2033
- Figure 44: Middle East & Africa US Bio fungicides Industry Revenue (Million), by Export Market Analysis (Value & Volume) 2025 & 2033
- Figure 45: Middle East & Africa US Bio fungicides Industry Revenue Share (%), by Export Market Analysis (Value & Volume) 2025 & 2033
- Figure 46: Middle East & Africa US Bio fungicides Industry Revenue (Million), by Price Trend Analysis 2025 & 2033
- Figure 47: Middle East & Africa US Bio fungicides Industry Revenue Share (%), by Price Trend Analysis 2025 & 2033
- Figure 48: Middle East & Africa US Bio fungicides Industry Revenue (Million), by Country 2025 & 2033
- Figure 49: Middle East & Africa US Bio fungicides Industry Revenue Share (%), by Country 2025 & 2033
- Figure 50: Asia Pacific US Bio fungicides Industry Revenue (Million), by Production Analysis 2025 & 2033
- Figure 51: Asia Pacific US Bio fungicides Industry Revenue Share (%), by Production Analysis 2025 & 2033
- Figure 52: Asia Pacific US Bio fungicides Industry Revenue (Million), by Consumption Analysis 2025 & 2033
- Figure 53: Asia Pacific US Bio fungicides Industry Revenue Share (%), by Consumption Analysis 2025 & 2033
- Figure 54: Asia Pacific US Bio fungicides Industry Revenue (Million), by Import Market Analysis (Value & Volume) 2025 & 2033
- Figure 55: Asia Pacific US Bio fungicides Industry Revenue Share (%), by Import Market Analysis (Value & Volume) 2025 & 2033
- Figure 56: Asia Pacific US Bio fungicides Industry Revenue (Million), by Export Market Analysis (Value & Volume) 2025 & 2033
- Figure 57: Asia Pacific US Bio fungicides Industry Revenue Share (%), by Export Market Analysis (Value & Volume) 2025 & 2033
- Figure 58: Asia Pacific US Bio fungicides Industry Revenue (Million), by Price Trend Analysis 2025 & 2033
- Figure 59: Asia Pacific US Bio fungicides Industry Revenue Share (%), by Price Trend Analysis 2025 & 2033
- Figure 60: Asia Pacific US Bio fungicides Industry Revenue (Million), by Country 2025 & 2033
- Figure 61: Asia Pacific US Bio fungicides Industry Revenue Share (%), by Country 2025 & 2033
List of Tables
- Table 1: Global US Bio fungicides Industry Revenue Million Forecast, by Production Analysis 2020 & 2033
- Table 2: Global US Bio fungicides Industry Revenue Million Forecast, by Consumption Analysis 2020 & 2033
- Table 3: Global US Bio fungicides Industry Revenue Million Forecast, by Import Market Analysis (Value & Volume) 2020 & 2033
- Table 4: Global US Bio fungicides Industry Revenue Million Forecast, by Export Market Analysis (Value & Volume) 2020 & 2033
- Table 5: Global US Bio fungicides Industry Revenue Million Forecast, by Price Trend Analysis 2020 & 2033
- Table 6: Global US Bio fungicides Industry Revenue Million Forecast, by Region 2020 & 2033
- Table 7: Global US Bio fungicides Industry Revenue Million Forecast, by Production Analysis 2020 & 2033
- Table 8: Global US Bio fungicides Industry Revenue Million Forecast, by Consumption Analysis 2020 & 2033
- Table 9: Global US Bio fungicides Industry Revenue Million Forecast, by Import Market Analysis (Value & Volume) 2020 & 2033
- Table 10: Global US Bio fungicides Industry Revenue Million Forecast, by Export Market Analysis (Value & Volume) 2020 & 2033
- Table 11: Global US Bio fungicides Industry Revenue Million Forecast, by Price Trend Analysis 2020 & 2033
- Table 12: Global US Bio fungicides Industry Revenue Million Forecast, by Country 2020 & 2033
- Table 13: United States US Bio fungicides Industry Revenue (Million) Forecast, by Application 2020 & 2033
- Table 14: Canada US Bio fungicides Industry Revenue (Million) Forecast, by Application 2020 & 2033
- Table 15: Mexico US Bio fungicides Industry Revenue (Million) Forecast, by Application 2020 & 2033
- Table 16: Global US Bio fungicides Industry Revenue Million Forecast, by Production Analysis 2020 & 2033
- Table 17: Global US Bio fungicides Industry Revenue Million Forecast, by Consumption Analysis 2020 & 2033
- Table 18: Global US Bio fungicides Industry Revenue Million Forecast, by Import Market Analysis (Value & Volume) 2020 & 2033
- Table 19: Global US Bio fungicides Industry Revenue Million Forecast, by Export Market Analysis (Value & Volume) 2020 & 2033
- Table 20: Global US Bio fungicides Industry Revenue Million Forecast, by Price Trend Analysis 2020 & 2033
- Table 21: Global US Bio fungicides Industry Revenue Million Forecast, by Country 2020 & 2033
- Table 22: Brazil US Bio fungicides Industry Revenue (Million) Forecast, by Application 2020 & 2033
- Table 23: Argentina US Bio fungicides Industry Revenue (Million) Forecast, by Application 2020 & 2033
- Table 24: Rest of South America US Bio fungicides Industry Revenue (Million) Forecast, by Application 2020 & 2033
- Table 25: Global US Bio fungicides Industry Revenue Million Forecast, by Production Analysis 2020 & 2033
- Table 26: Global US Bio fungicides Industry Revenue Million Forecast, by Consumption Analysis 2020 & 2033
- Table 27: Global US Bio fungicides Industry Revenue Million Forecast, by Import Market Analysis (Value & Volume) 2020 & 2033
- Table 28: Global US Bio fungicides Industry Revenue Million Forecast, by Export Market Analysis (Value & Volume) 2020 & 2033
- Table 29: Global US Bio fungicides Industry Revenue Million Forecast, by Price Trend Analysis 2020 & 2033
- Table 30: Global US Bio fungicides Industry Revenue Million Forecast, by Country 2020 & 2033
- Table 31: United Kingdom US Bio fungicides Industry Revenue (Million) Forecast, by Application 2020 & 2033
- Table 32: Germany US Bio fungicides Industry Revenue (Million) Forecast, by Application 2020 & 2033
- Table 33: France US Bio fungicides Industry Revenue (Million) Forecast, by Application 2020 & 2033
- Table 34: Italy US Bio fungicides Industry Revenue (Million) Forecast, by Application 2020 & 2033
- Table 35: Spain US Bio fungicides Industry Revenue (Million) Forecast, by Application 2020 & 2033
- Table 36: Russia US Bio fungicides Industry Revenue (Million) Forecast, by Application 2020 & 2033
- Table 37: Benelux US Bio fungicides Industry Revenue (Million) Forecast, by Application 2020 & 2033
- Table 38: Nordics US Bio fungicides Industry Revenue (Million) Forecast, by Application 2020 & 2033
- Table 39: Rest of Europe US Bio fungicides Industry Revenue (Million) Forecast, by Application 2020 & 2033
- Table 40: Global US Bio fungicides Industry Revenue Million Forecast, by Production Analysis 2020 & 2033
- Table 41: Global US Bio fungicides Industry Revenue Million Forecast, by Consumption Analysis 2020 & 2033
- Table 42: Global US Bio fungicides Industry Revenue Million Forecast, by Import Market Analysis (Value & Volume) 2020 & 2033
- Table 43: Global US Bio fungicides Industry Revenue Million Forecast, by Export Market Analysis (Value & Volume) 2020 & 2033
- Table 44: Global US Bio fungicides Industry Revenue Million Forecast, by Price Trend Analysis 2020 & 2033
- Table 45: Global US Bio fungicides Industry Revenue Million Forecast, by Country 2020 & 2033
- Table 46: Turkey US Bio fungicides Industry Revenue (Million) Forecast, by Application 2020 & 2033
- Table 47: Israel US Bio fungicides Industry Revenue (Million) Forecast, by Application 2020 & 2033
- Table 48: GCC US Bio fungicides Industry Revenue (Million) Forecast, by Application 2020 & 2033
- Table 49: North Africa US Bio fungicides Industry Revenue (Million) Forecast, by Application 2020 & 2033
- Table 50: South Africa US Bio fungicides Industry Revenue (Million) Forecast, by Application 2020 & 2033
- Table 51: Rest of Middle East & Africa US Bio fungicides Industry Revenue (Million) Forecast, by Application 2020 & 2033
- Table 52: Global US Bio fungicides Industry Revenue Million Forecast, by Production Analysis 2020 & 2033
- Table 53: Global US Bio fungicides Industry Revenue Million Forecast, by Consumption Analysis 2020 & 2033
- Table 54: Global US Bio fungicides Industry Revenue Million Forecast, by Import Market Analysis (Value & Volume) 2020 & 2033
- Table 55: Global US Bio fungicides Industry Revenue Million Forecast, by Export Market Analysis (Value & Volume) 2020 & 2033
- Table 56: Global US Bio fungicides Industry Revenue Million Forecast, by Price Trend Analysis 2020 & 2033
- Table 57: Global US Bio fungicides Industry Revenue Million Forecast, by Country 2020 & 2033
- Table 58: China US Bio fungicides Industry Revenue (Million) Forecast, by Application 2020 & 2033
- Table 59: India US Bio fungicides Industry Revenue (Million) Forecast, by Application 2020 & 2033
- Table 60: Japan US Bio fungicides Industry Revenue (Million) Forecast, by Application 2020 & 2033
- Table 61: South Korea US Bio fungicides Industry Revenue (Million) Forecast, by Application 2020 & 2033
- Table 62: ASEAN US Bio fungicides Industry Revenue (Million) Forecast, by Application 2020 & 2033
- Table 63: Oceania US Bio fungicides Industry Revenue (Million) Forecast, by Application 2020 & 2033
- Table 64: Rest of Asia Pacific US Bio fungicides Industry Revenue (Million) Forecast, by Application 2020 & 2033
Frequently Asked Questions
1. What is the projected Compound Annual Growth Rate (CAGR) of the US Bio fungicides Industry?
The projected CAGR is approximately 9.50%.
2. Which companies are prominent players in the US Bio fungicides Industry?
Key companies in the market include BioWorks Inc, Novozyme Biologicals, Isagro USA, Marrone Bio Innovations, Valent BioSciences LLC, Syngenta AG, De Sangosse Lt, Certis USA LLC.
3. What are the main segments of the US Bio fungicides Industry?
The market segments include Production Analysis, Consumption Analysis, Import Market Analysis (Value & Volume), Export Market Analysis (Value & Volume), Price Trend Analysis.
4. Can you provide details about the market size?
The market size is estimated to be USD 0.96 Million as of 2022.
5. What are some drivers contributing to market growth?
Adoption of Organic and Eco-friendly Farming Practices; Declining Area of Arable Land and Rising Food Security Concerns.
6. What are the notable trends driving market growth?
Fruits and Vegetables Fastest Market Growing Segment.
7. Are there any restraints impacting market growth?
High Demand for Conventional and Synthetic Products; Lack of Awareness and Other Factors Limiting the Adoption of Agricultural Inoculants.
8. Can you provide examples of recent developments in the market?
N/A
9. What pricing options are available for accessing the report?
Pricing options include single-user, multi-user, and enterprise licenses priced at USD 3800, USD 4500, and USD 5800 respectively.
10. Is the market size provided in terms of value or volume?
The market size is provided in terms of value, measured in Million.
11. Are there any specific market keywords associated with the report?
Yes, the market keyword associated with the report is "US Bio fungicides Industry," which aids in identifying and referencing the specific market segment covered.
12. How do I determine which pricing option suits my needs best?
The pricing options vary based on user requirements and access needs. Individual users may opt for single-user licenses, while businesses requiring broader access may choose multi-user or enterprise licenses for cost-effective access to the report.
13. Are there any additional resources or data provided in the US Bio fungicides Industry report?
While the report offers comprehensive insights, it's advisable to review the specific contents or supplementary materials provided to ascertain if additional resources or data are available.
14. How can I stay updated on further developments or reports in the US Bio fungicides Industry?
To stay informed about further developments, trends, and reports in the US Bio fungicides Industry, consider subscribing to industry newsletters, following relevant companies and organizations, or regularly checking reputable industry news sources and publications.
Methodology
Step 1 - Identification of Relevant Samples Size from Population Database


Step 2 - Approaches for Defining Global Market Size (Value, Volume* & Price*)

Note*: In applicable scenarios
Step 3 - Data Sources
Primary Research
- Web Analytics
- Survey Reports
- Research Institute
- Latest Research Reports
- Opinion Leaders
Secondary Research
- Annual Reports
- White Paper
- Latest Press Release
- Industry Association
- Paid Database
- Investor Presentations

Step 4 - Data Triangulation
Involves using different sources of information in order to increase the validity of a study
These sources are likely to be stakeholders in a program - participants, other researchers, program staff, other community members, and so on.
Then we put all data in single framework & apply various statistical tools to find out the dynamic on the market.
During the analysis stage, feedback from the stakeholder groups would be compared to determine areas of agreement as well as areas of divergence