

Key Insights
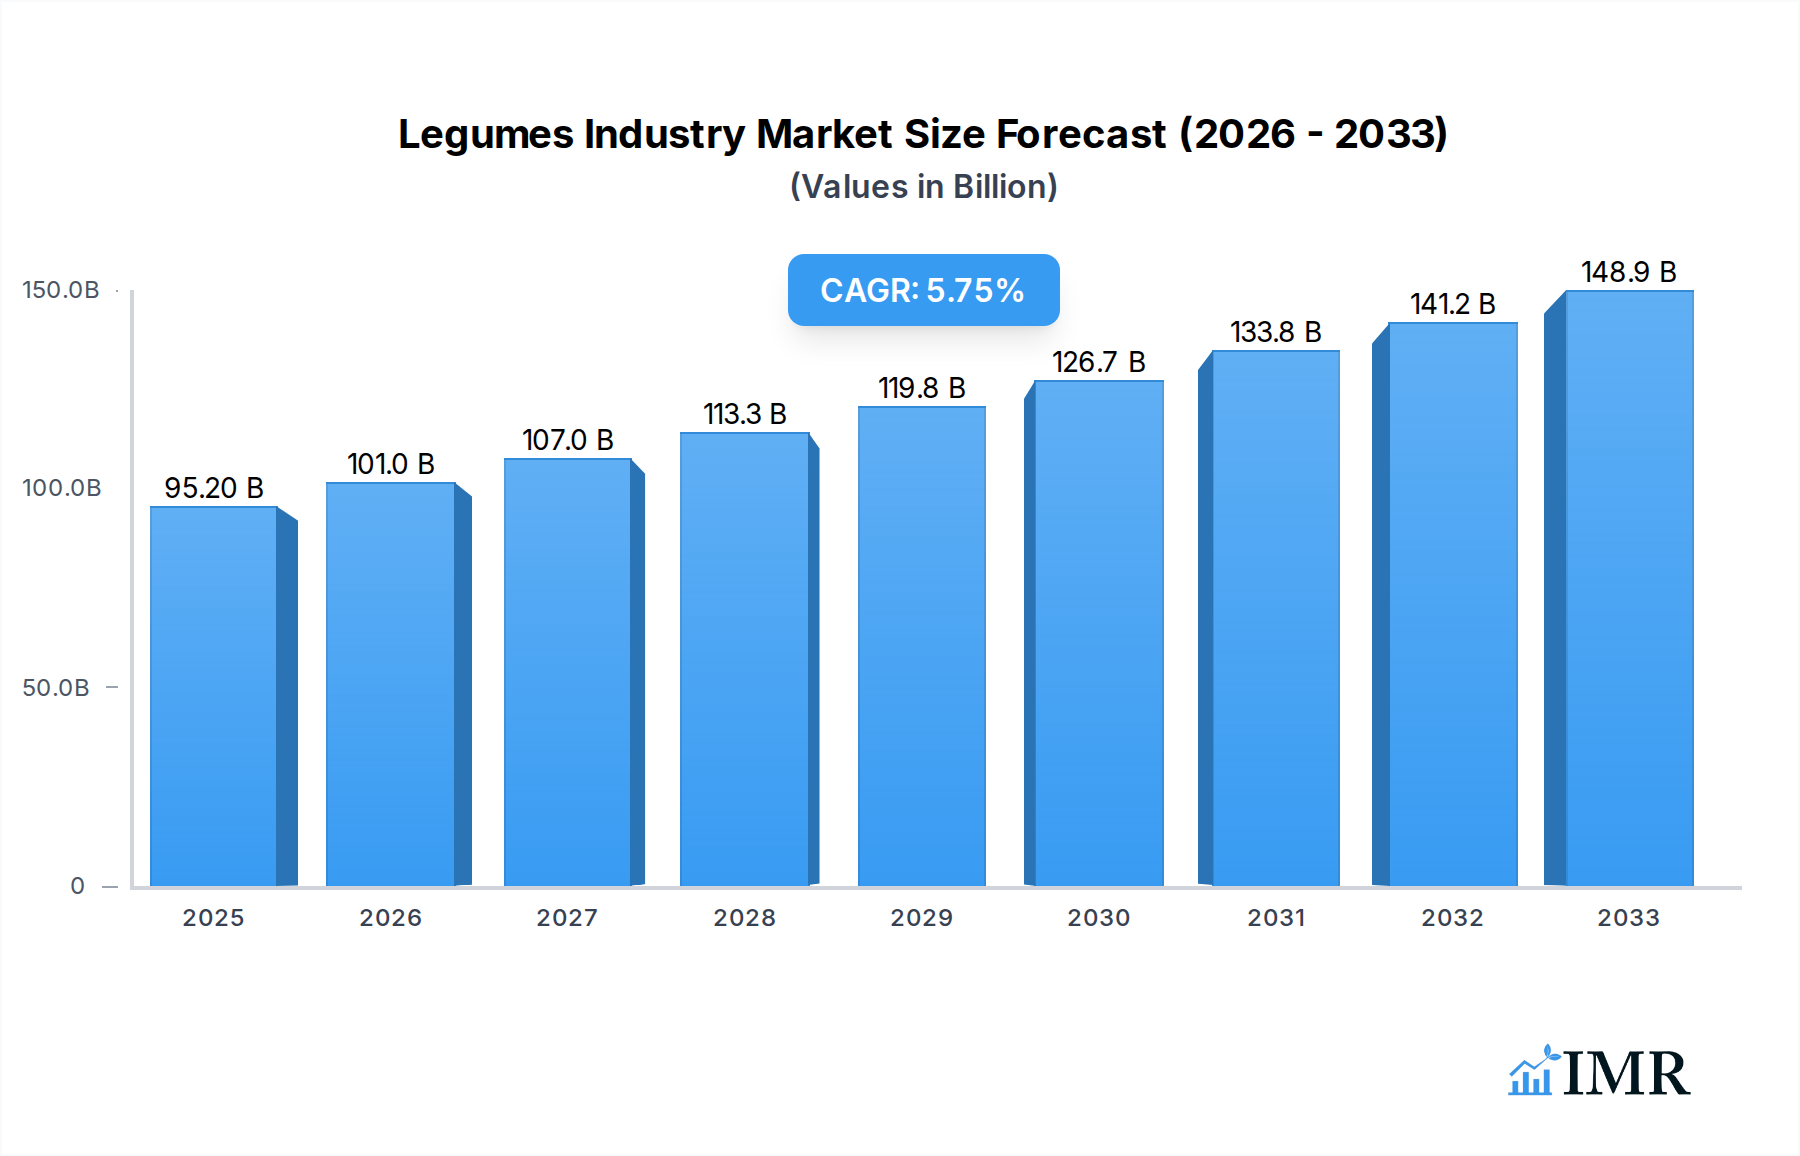
The global legumes market is poised for substantial growth, estimated to reach $95.2 billion in 2025, with a projected Compound Annual Growth Rate (CAGR) of 6.2% from 2025 to 2033. This expansion is driven by a confluence of factors, including the increasing global demand for plant-based protein sources, rising health consciousness among consumers, and the inherent nutritional benefits of legumes. As a versatile and sustainable food staple, legumes like lentils, beans, and peas are gaining traction across diverse culinary applications and are increasingly incorporated into processed foods and animal feed. The growing awareness of legume cultivation's environmental advantages, such as nitrogen fixation and reduced water requirements, further bolsters its market appeal, particularly in the context of global food security initiatives and a growing focus on sustainable agriculture practices. Key drivers such as population growth, shifting dietary patterns towards vegetarianism and veganism, and government support for legume cultivation are expected to sustain this upward trajectory.

Legumes Industry Market Size (In Billion)
The market is further characterized by dynamic trends that are shaping its future. Innovations in processing technologies are leading to the development of new legume-based products, expanding consumer choices and accessibility. The growing influence of emerging economies, particularly in the Asia Pacific and South America, is a significant trend, fueled by improving disposable incomes and a greater adoption of Western dietary habits. However, the market also faces certain restraints. Fluctuations in raw material prices due to weather patterns and geopolitical factors can impact profitability. Additionally, challenges in supply chain logistics, especially in developing regions, and the need for greater consumer education regarding the diverse benefits and applications of legumes, present hurdles to be overcome. Despite these challenges, the overall outlook for the legumes industry remains robust, driven by its inherent value proposition in nutrition, sustainability, and affordability.
Legumes Industry Company Market Share
This in-depth report provides a comprehensive analysis of the global Legumes Industry, covering historical trends, current market dynamics, and future projections. Spanning from 2019 to 2033, with a base year of 2025 and a forecast period of 2025–2033, this report offers critical insights for stakeholders, investors, and industry professionals. We delve into parent and child market segments, leveraging high-traffic keywords like "plant-based protein," "sustainable agriculture," "food security," "pulse crops," "lentils," "beans," "peas," "chickpeas," and "soybeans" to maximize SEO visibility. All values are presented in billions of USD unless otherwise specified.
Legumes Industry Market Dynamics & Structure
The global Legumes Industry exhibits a moderately consolidated market structure, with major players like Archer Daniels Midland, Bunge, GrainCorp, Louis Dreyfus Company, and Cargill holding significant market shares. Technological innovation is a key driver, particularly in areas such as precision agriculture for improved yields, enhanced processing techniques for diverse applications, and the development of novel plant-based protein alternatives. Regulatory frameworks, including food safety standards and import/export regulations, play a crucial role in shaping market access and operational costs. Competitive product substitutes, primarily other protein sources like meat and dairy, and to a lesser extent, other plant-based ingredients, influence market demand. End-user demographics are shifting towards health-conscious consumers and those seeking sustainable dietary options, driving demand for legumes in both traditional food applications and emerging sectors. Mergers and acquisitions (M&A) are a consistent trend, with companies consolidating their supply chains and expanding their product portfolios.
- Market Concentration: Dominated by a few multinational agribusinesses, but with growing participation from specialized processors and ingredient suppliers.
- Technological Innovation: Focus on yield enhancement, disease resistance, processing efficiency, and novel product development.
- Regulatory Frameworks: Stringent food safety and quality standards, evolving labeling requirements for plant-based products.
- Competitive Substitutes: Meat, dairy, and other plant-based protein sources.
- End-User Demographics: Increasing demand from health-conscious consumers, vegetarians, vegans, and flexitarians.
- M&A Trends: Strategic acquisitions to secure supply chains, gain market access, and diversify product offerings.
Legumes Industry Growth Trends & Insights
The Legumes Industry is poised for robust growth, driven by a confluence of factors including increasing global population, rising demand for plant-based protein, and a growing emphasis on sustainable food systems. The market size is projected to witness a significant expansion from approximately \$100 billion in the historical period (2019-2024) to an estimated \$250 billion by 2033. The compound annual growth rate (CAGR) is estimated to be around 7.5% during the forecast period. Adoption rates for legumes in diverse food applications, from staple foods to specialized ingredients, are steadily increasing. Technological disruptions, such as advancements in legume breeding for improved nutritional profiles and shelf-life, and innovative processing technologies that enhance digestibility and texture, are further fueling market penetration. Consumer behavior shifts, including a heightened awareness of health benefits associated with pulse consumption and a growing preference for environmentally friendly food choices, are pivotal in this growth trajectory. The increasing demand for protein-rich diets, coupled with the affordability and versatility of legumes, positions them as a key solution for global food security challenges. The integration of legumes into processed foods, snacks, and alternative meat products continues to expand their appeal beyond traditional markets.
Dominant Regions, Countries, or Segments in Legumes Industry
Production Analysis: North America and South America are dominant regions in legume production, driven by vast arable land, favorable climatic conditions, and established agricultural infrastructure. Countries like Canada and the United States are leading producers of pulses, particularly peas and lentils, while Brazil and Argentina are significant contributors to soybean production. Asia-Pacific, especially India, remains a crucial producer of traditional pulses like chickpeas and various lentil varieties, catering to significant domestic consumption.
- Key Drivers: Favorable government policies supporting agricultural output, advanced farming technologies, and a strong export orientation.
- Market Share: North America and South America collectively account for over 45% of global legume production.
- Growth Potential: Continued investment in research and development for yield improvement and climate resilience.
Consumption Analysis: Asia-Pacific, particularly India and China, represents the largest consumer base for legumes due to their historical dietary importance and large populations. However, Western markets, including North America and Europe, are witnessing a rapid surge in legume consumption driven by the plant-based diet trend and increased awareness of health benefits.
- Key Drivers: Growing vegetarian and vegan populations, demand for healthy and affordable protein sources, and the expanding use of legumes in food manufacturing.
- Market Share: Asia-Pacific accounts for over 50% of global legume consumption.
- Growth Potential: Rapidly growing demand in developed economies for plant-based alternatives and functional food ingredients.
Import Market Analysis (Value & Volume): Europe and the Middle East are significant net importers of legumes, relying on global supply to meet domestic demand, especially for high-demand pulses like lentils and chickpeas. The United States also imports substantial volumes of various legume varieties.
- Key Drivers: Dietary diversification, demand for specific legume types not locally grown, and the growing food processing industry.
- Market Share: European countries collectively represent a substantial portion of global legume imports.
- Growth Potential: Increasing demand for value-added legume products and specialized ingredients.
Export Market Analysis (Value & Volume): Canada, the United States, Australia, and Russia are major exporters of various legume types, particularly peas, lentils, and chickpeas. Argentina and Brazil are significant exporters of soybeans.
- Key Drivers: High production volumes, competitive pricing, and established trade relationships.
- Market Share: Canada is a leading global exporter of pulses.
- Growth Potential: Expanding export opportunities to emerging markets with growing demand for plant-based protein.
Price Trend Analysis: Legume prices are influenced by global supply and demand dynamics, weather conditions affecting harvests, geopolitical events, and currency fluctuations. Historically, prices have shown volatility but generally trend upwards due to increasing demand and production costs. For instance, the average price of lentils, which was around \$0.80 per kilogram in 2023, is projected to reach \$1.20 per kilogram by 2033.
- Key Drivers: Supply chain disruptions, energy costs impacting transportation, and the demand for legumes in animal feed and industrial applications.
- Market Share: Price volatility impacts profitability and trade flows across regions.
- Growth Potential: While subject to fluctuations, the long-term trend points to sustained demand supporting price stability or gradual increases.
Legumes Industry Product Landscape
The legume product landscape is characterized by increasing diversification and innovation. Beyond traditional whole beans and lentils, the industry is witnessing a surge in processed legume ingredients such as legume flours, proteins, and starches. These are being incorporated into a wide array of applications, including plant-based meat alternatives, dairy-free products, baked goods, snacks, and infant nutrition. Unique selling propositions often revolve around the high protein content, fiber, and essential nutrients of legumes. Technological advancements are focused on improving the functionality of these ingredients, such as enhancing emulsification, binding properties, and reducing "beany" off-flavors.
Key Drivers, Barriers & Challenges in Legumes Industry
Key Drivers:
- Growing Demand for Plant-Based Protein: Health consciousness and environmental concerns are driving consumers towards plant-based diets.
- Food Security: Legumes are a sustainable and affordable source of essential nutrients, crucial for global food security.
- Nutritional Benefits: High protein, fiber, and micronutrient content make legumes a healthy dietary choice.
- Government Support & Initiatives: Policies promoting sustainable agriculture and plant-based diets.
- Technological Advancements: Improved crop yields, processing techniques, and product development.
Barriers & Challenges:
- Supply Chain Volatility: Weather-related disruptions, geopolitical instability, and logistics challenges can impact availability and price.
- Consumer Perception & Taste Preferences: Overcoming traditional biases and developing appealing legume-based products.
- Processing Limitations: Challenges in achieving desired textures and flavors in processed legume products.
- Competition from Other Protein Sources: Intense competition from meat, dairy, and other plant-based alternatives.
- Regulatory Hurdles: Navigating diverse food safety and labeling regulations across different markets.
Emerging Opportunities in Legumes Industry
Emerging opportunities in the Legumes Industry lie in the expanding market for plant-based food alternatives, particularly in developed economies. The development of novel legume-derived ingredients with enhanced functional properties for use in innovative food products, such as protein isolates for beverages and peptides for functional foods, presents significant potential. Untapped markets in developing regions, where legumes can play a crucial role in addressing malnutrition and improving food security, also offer substantial growth prospects. Furthermore, the utilization of legumes in animal feed as a sustainable protein source is an evolving area.
Growth Accelerators in the Legumes Industry Industry
Long-term growth in the Legumes Industry is being accelerated by significant technological breakthroughs in crop genetics, leading to higher yields and improved nutritional content. Strategic partnerships between agricultural producers, food manufacturers, and ingredient suppliers are crucial for streamlining the value chain and fostering innovation. Market expansion strategies, including penetration into new geographic regions and the development of innovative product formats catering to diverse consumer preferences, are also key accelerators. The increasing investment in research and development for creating novel legume-based applications, from alternative proteins to biodegradable materials, is further propelling the industry forward.
Key Players Shaping the Legumes Industry Market
- Archer Daniels Midland
- Bunge
- GrainCorp
- Louis Dreyfus Company
- Cargill
Notable Milestones in Legumes Industry Sector
- 2022: Significant increase in global investment in plant-based food startups, with many focusing on legume-derived proteins.
- 2023: Launch of several new legume-based meat and dairy alternative products in major retail markets, demonstrating consumer acceptance.
- 2024: Advancements in pulse breeding technology leading to the development of new, higher-yielding, and more resilient varieties of lentils and peas.
- 2024: Increased focus on the sustainability aspects of legume cultivation, with a growing number of farmers adopting regenerative agricultural practices.
In-Depth Legumes Industry Market Outlook
The outlook for the Legumes Industry remains exceptionally positive, driven by sustained global demand for plant-based protein and a growing commitment to sustainable food systems. Growth accelerators such as technological innovation in crop science and processing, coupled with strategic market expansion and evolving consumer preferences, will continue to propel the industry forward. The \$250 billion market potential by 2033 signifies a substantial opportunity for stakeholders to capitalize on the increasing demand for healthy, sustainable, and affordable protein solutions. Strategic investments in R&D and supply chain optimization will be critical for maximizing this potential.
Legumes Industry Segmentation
- 1. Production Analysis
- 2. Consumption Analysis
- 3. Import Market Analysis (Value & Volume)
- 4. Export Market Analysis (Value & Volume)
- 5. Price Trend Analysis
Legumes Industry Segmentation By Geography
-
1. North America
- 1.1. United States
- 1.2. Mexico
-
2. Europe
- 2.1. Russia
- 2.2. Turkey
- 2.3. Italy
-
3. Asia Pacific
- 3.1. Myanmar
- 3.2. India
- 3.3. China
- 3.4. Australia
-
4. South America
- 4.1. Argentina
- 4.2. Brazil
-
5. Middle East and Africa
- 5.1. United Republic of Tanzania
- 5.2. Uganda
- 5.3. Kenya
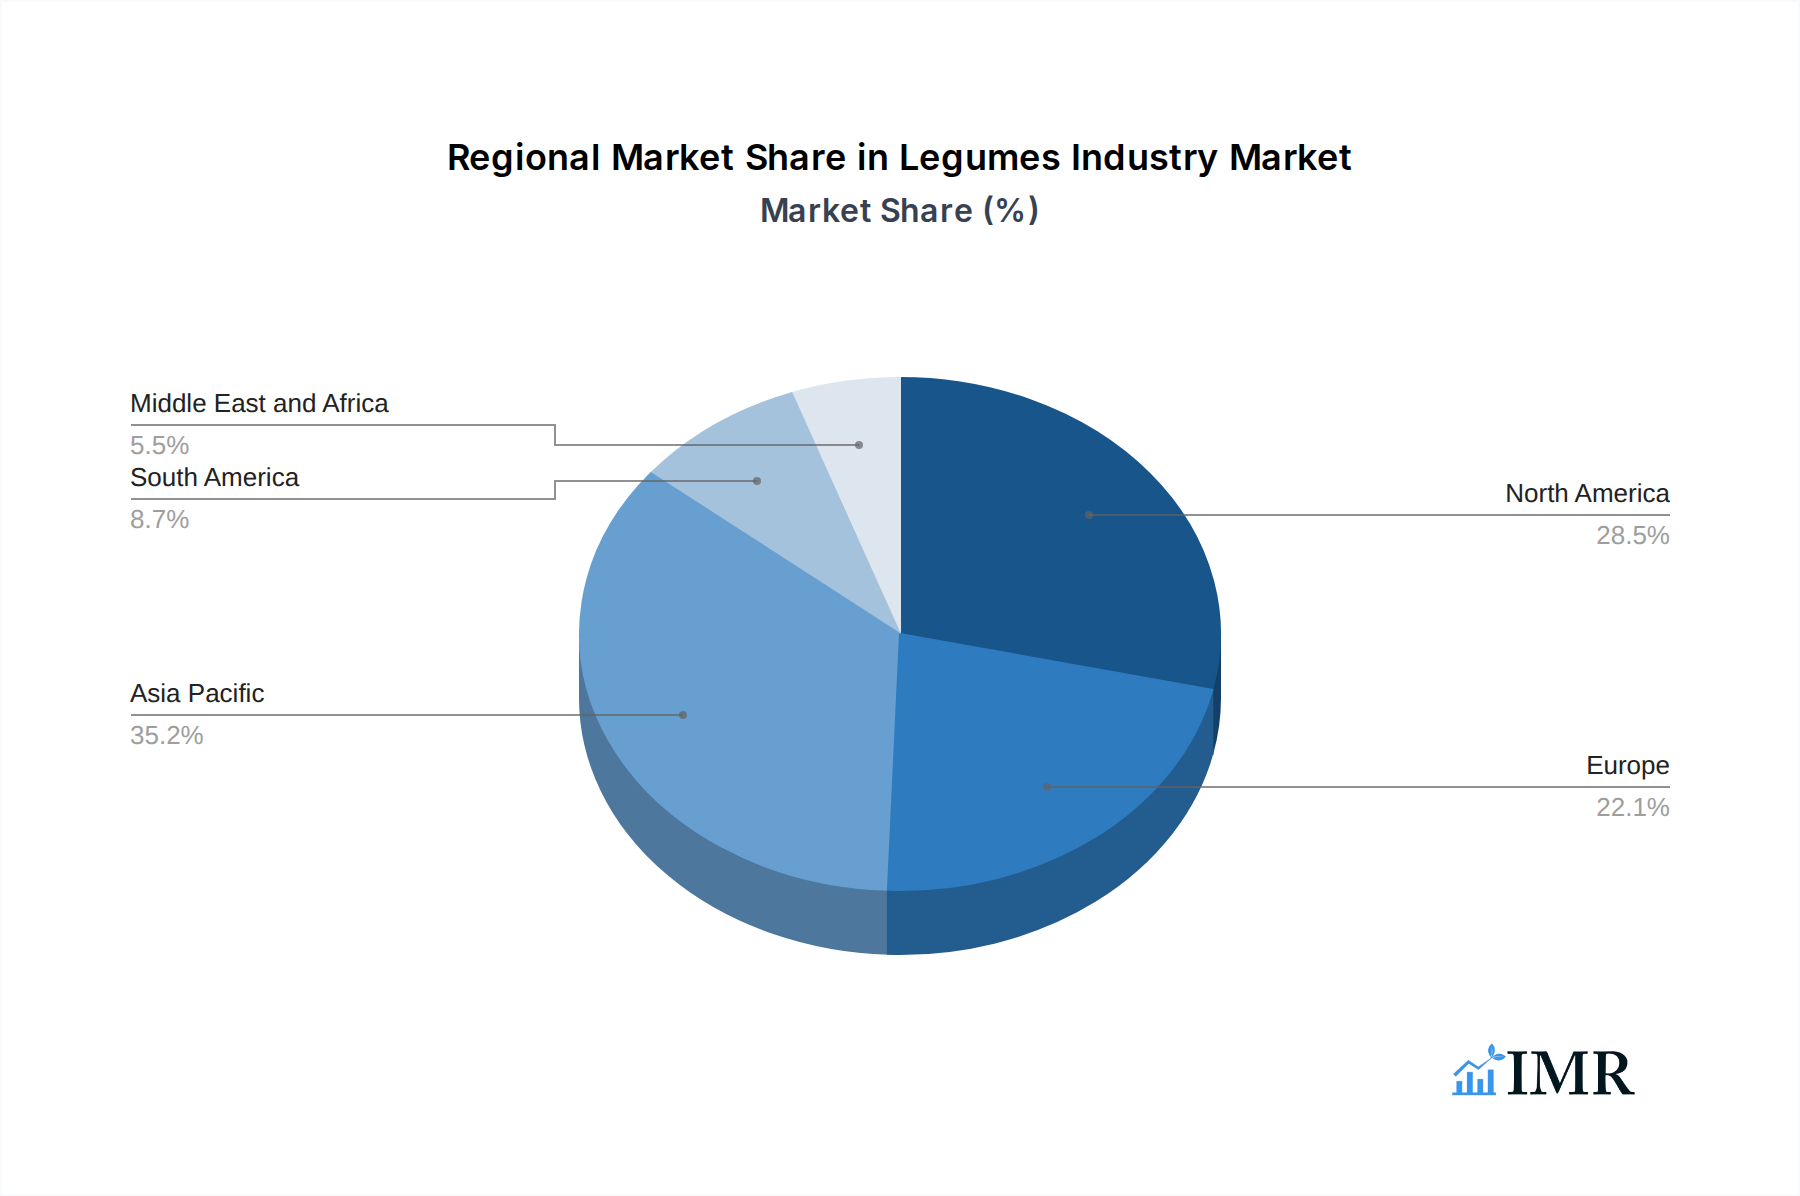
Legumes Industry Regional Market Share
Geographic Coverage of Legumes Industry
Legumes Industry REPORT HIGHLIGHTS
| Aspects | Details |
|---|---|
| Study Period | 2020-2034 |
| Base Year | 2025 |
| Estimated Year | 2026 |
| Forecast Period | 2026-2034 |
| Historical Period | 2020-2025 |
| Growth Rate | CAGR of 5.5% from 2020-2034 |
| Segmentation |
|
Table of Contents
- 1. Introduction
- 1.1. Research Scope
- 1.2. Market Segmentation
- 1.3. Research Objective
- 1.4. Definitions and Assumptions
- 2. Executive Summary
- 2.1. Market Snapshot
- 3. Market Dynamics
- 3.1. Market Drivers
- 3.2. Market Restrains
- 3.3. Market Trends
- 3.4. Market Opportunities
- 4. Market Factor Analysis
- 4.1. Porters Five Forces
- 4.1.1. Bargaining Power of Suppliers
- 4.1.2. Bargaining Power of Buyers
- 4.1.3. Threat of New Entrants
- 4.1.4. Threat of Substitutes
- 4.1.5. Competitive Rivalry
- 4.2. PESTEL analysis
- 4.3. BCG Analysis
- 4.3.1. Stars (High Growth, High Market Share)
- 4.3.2. Cash Cows (Low Growth, High Market Share)
- 4.3.3. Question Mark (High Growth, Low Market Share)
- 4.3.4. Dogs (Low Growth, Low Market Share)
- 4.4. Ansoff Matrix Analysis
- 4.5. Supply Chain Analysis
- 4.6. Regulatory Landscape
- 4.7. Current Market Potential and Opportunity Assessment (TAM–SAM–SOM Framework)
- 4.8. IMR Analyst Note
- 4.1. Porters Five Forces
- 5. Market Analysis, Insights and Forecast 2021-2033
- 5.1. Market Analysis, Insights and Forecast - by Production Analysis
- 5.2. Market Analysis, Insights and Forecast - by Consumption Analysis
- 5.3. Market Analysis, Insights and Forecast - by Import Market Analysis (Value & Volume)
- 5.4. Market Analysis, Insights and Forecast - by Export Market Analysis (Value & Volume)
- 5.5. Market Analysis, Insights and Forecast - by Price Trend Analysis
- 5.6. Market Analysis, Insights and Forecast - by Region
- 5.6.1. North America
- 5.6.2. Europe
- 5.6.3. Asia Pacific
- 5.6.4. South America
- 5.6.5. Middle East and Africa
- 6. Global Legumes Industry Analysis, Insights and Forecast, 2021-2033
- 6.1. Market Analysis, Insights and Forecast - by Production Analysis
- 6.2. Market Analysis, Insights and Forecast - by Consumption Analysis
- 6.3. Market Analysis, Insights and Forecast - by Import Market Analysis (Value & Volume)
- 6.4. Market Analysis, Insights and Forecast - by Export Market Analysis (Value & Volume)
- 6.5. Market Analysis, Insights and Forecast - by Price Trend Analysis
- 7. North America Legumes Industry Analysis, Insights and Forecast, 2020-2032
- 7.1. Market Analysis, Insights and Forecast - by Production Analysis
- 7.2. Market Analysis, Insights and Forecast - by Consumption Analysis
- 7.3. Market Analysis, Insights and Forecast - by Import Market Analysis (Value & Volume)
- 7.4. Market Analysis, Insights and Forecast - by Export Market Analysis (Value & Volume)
- 7.5. Market Analysis, Insights and Forecast - by Price Trend Analysis
- 8. Europe Legumes Industry Analysis, Insights and Forecast, 2020-2032
- 8.1. Market Analysis, Insights and Forecast - by Production Analysis
- 8.2. Market Analysis, Insights and Forecast - by Consumption Analysis
- 8.3. Market Analysis, Insights and Forecast - by Import Market Analysis (Value & Volume)
- 8.4. Market Analysis, Insights and Forecast - by Export Market Analysis (Value & Volume)
- 8.5. Market Analysis, Insights and Forecast - by Price Trend Analysis
- 9. Asia Pacific Legumes Industry Analysis, Insights and Forecast, 2020-2032
- 9.1. Market Analysis, Insights and Forecast - by Production Analysis
- 9.2. Market Analysis, Insights and Forecast - by Consumption Analysis
- 9.3. Market Analysis, Insights and Forecast - by Import Market Analysis (Value & Volume)
- 9.4. Market Analysis, Insights and Forecast - by Export Market Analysis (Value & Volume)
- 9.5. Market Analysis, Insights and Forecast - by Price Trend Analysis
- 10. South America Legumes Industry Analysis, Insights and Forecast, 2020-2032
- 10.1. Market Analysis, Insights and Forecast - by Production Analysis
- 10.2. Market Analysis, Insights and Forecast - by Consumption Analysis
- 10.3. Market Analysis, Insights and Forecast - by Import Market Analysis (Value & Volume)
- 10.4. Market Analysis, Insights and Forecast - by Export Market Analysis (Value & Volume)
- 10.5. Market Analysis, Insights and Forecast - by Price Trend Analysis
- 11. Middle East and Africa Legumes Industry Analysis, Insights and Forecast, 2020-2032
- 11.1. Market Analysis, Insights and Forecast - by Production Analysis
- 11.2. Market Analysis, Insights and Forecast - by Consumption Analysis
- 11.3. Market Analysis, Insights and Forecast - by Import Market Analysis (Value & Volume)
- 11.4. Market Analysis, Insights and Forecast - by Export Market Analysis (Value & Volume)
- 11.5. Market Analysis, Insights and Forecast - by Price Trend Analysis
- 12. Competitive Analysis
- 12.1. Company Profiles
- 12.1.1 Archer Daniels Midland
- 12.1.1.1. Company Overview
- 12.1.1.2. Products
- 12.1.1.3. Company Financials
- 12.1.1.4. SWOT Analysis
- 12.1.2 Bunge
- 12.1.2.1. Company Overview
- 12.1.2.2. Products
- 12.1.2.3. Company Financials
- 12.1.2.4. SWOT Analysis
- 12.1.3 GrainCorp
- 12.1.3.1. Company Overview
- 12.1.3.2. Products
- 12.1.3.3. Company Financials
- 12.1.3.4. SWOT Analysis
- 12.1.4 Louis Dreyfus Company
- 12.1.4.1. Company Overview
- 12.1.4.2. Products
- 12.1.4.3. Company Financials
- 12.1.4.4. SWOT Analysis
- 12.1.5 Cargill
- 12.1.5.1. Company Overview
- 12.1.5.2. Products
- 12.1.5.3. Company Financials
- 12.1.5.4. SWOT Analysis
- 12.1.1 Archer Daniels Midland
- 12.2. Market Entropy
- 12.2.1 Company's Key Areas Served
- 12.2.2 Recent Developments
- 12.3. Company Market Share Analysis 2025
- 12.3.1 Top 5 Companies Market Share Analysis
- 12.3.2 Top 3 Companies Market Share Analysis
- 12.4. List of Potential Customers
- 13. Research Methodology
List of Figures
- Figure 1: Global Legumes Industry Revenue Breakdown (billion, %) by Region 2025 & 2033
- Figure 2: North America Legumes Industry Revenue (billion), by Production Analysis 2025 & 2033
- Figure 3: North America Legumes Industry Revenue Share (%), by Production Analysis 2025 & 2033
- Figure 4: North America Legumes Industry Revenue (billion), by Consumption Analysis 2025 & 2033
- Figure 5: North America Legumes Industry Revenue Share (%), by Consumption Analysis 2025 & 2033
- Figure 6: North America Legumes Industry Revenue (billion), by Import Market Analysis (Value & Volume) 2025 & 2033
- Figure 7: North America Legumes Industry Revenue Share (%), by Import Market Analysis (Value & Volume) 2025 & 2033
- Figure 8: North America Legumes Industry Revenue (billion), by Export Market Analysis (Value & Volume) 2025 & 2033
- Figure 9: North America Legumes Industry Revenue Share (%), by Export Market Analysis (Value & Volume) 2025 & 2033
- Figure 10: North America Legumes Industry Revenue (billion), by Price Trend Analysis 2025 & 2033
- Figure 11: North America Legumes Industry Revenue Share (%), by Price Trend Analysis 2025 & 2033
- Figure 12: North America Legumes Industry Revenue (billion), by Country 2025 & 2033
- Figure 13: North America Legumes Industry Revenue Share (%), by Country 2025 & 2033
- Figure 14: Europe Legumes Industry Revenue (billion), by Production Analysis 2025 & 2033
- Figure 15: Europe Legumes Industry Revenue Share (%), by Production Analysis 2025 & 2033
- Figure 16: Europe Legumes Industry Revenue (billion), by Consumption Analysis 2025 & 2033
- Figure 17: Europe Legumes Industry Revenue Share (%), by Consumption Analysis 2025 & 2033
- Figure 18: Europe Legumes Industry Revenue (billion), by Import Market Analysis (Value & Volume) 2025 & 2033
- Figure 19: Europe Legumes Industry Revenue Share (%), by Import Market Analysis (Value & Volume) 2025 & 2033
- Figure 20: Europe Legumes Industry Revenue (billion), by Export Market Analysis (Value & Volume) 2025 & 2033
- Figure 21: Europe Legumes Industry Revenue Share (%), by Export Market Analysis (Value & Volume) 2025 & 2033
- Figure 22: Europe Legumes Industry Revenue (billion), by Price Trend Analysis 2025 & 2033
- Figure 23: Europe Legumes Industry Revenue Share (%), by Price Trend Analysis 2025 & 2033
- Figure 24: Europe Legumes Industry Revenue (billion), by Country 2025 & 2033
- Figure 25: Europe Legumes Industry Revenue Share (%), by Country 2025 & 2033
- Figure 26: Asia Pacific Legumes Industry Revenue (billion), by Production Analysis 2025 & 2033
- Figure 27: Asia Pacific Legumes Industry Revenue Share (%), by Production Analysis 2025 & 2033
- Figure 28: Asia Pacific Legumes Industry Revenue (billion), by Consumption Analysis 2025 & 2033
- Figure 29: Asia Pacific Legumes Industry Revenue Share (%), by Consumption Analysis 2025 & 2033
- Figure 30: Asia Pacific Legumes Industry Revenue (billion), by Import Market Analysis (Value & Volume) 2025 & 2033
- Figure 31: Asia Pacific Legumes Industry Revenue Share (%), by Import Market Analysis (Value & Volume) 2025 & 2033
- Figure 32: Asia Pacific Legumes Industry Revenue (billion), by Export Market Analysis (Value & Volume) 2025 & 2033
- Figure 33: Asia Pacific Legumes Industry Revenue Share (%), by Export Market Analysis (Value & Volume) 2025 & 2033
- Figure 34: Asia Pacific Legumes Industry Revenue (billion), by Price Trend Analysis 2025 & 2033
- Figure 35: Asia Pacific Legumes Industry Revenue Share (%), by Price Trend Analysis 2025 & 2033
- Figure 36: Asia Pacific Legumes Industry Revenue (billion), by Country 2025 & 2033
- Figure 37: Asia Pacific Legumes Industry Revenue Share (%), by Country 2025 & 2033
- Figure 38: South America Legumes Industry Revenue (billion), by Production Analysis 2025 & 2033
- Figure 39: South America Legumes Industry Revenue Share (%), by Production Analysis 2025 & 2033
- Figure 40: South America Legumes Industry Revenue (billion), by Consumption Analysis 2025 & 2033
- Figure 41: South America Legumes Industry Revenue Share (%), by Consumption Analysis 2025 & 2033
- Figure 42: South America Legumes Industry Revenue (billion), by Import Market Analysis (Value & Volume) 2025 & 2033
- Figure 43: South America Legumes Industry Revenue Share (%), by Import Market Analysis (Value & Volume) 2025 & 2033
- Figure 44: South America Legumes Industry Revenue (billion), by Export Market Analysis (Value & Volume) 2025 & 2033
- Figure 45: South America Legumes Industry Revenue Share (%), by Export Market Analysis (Value & Volume) 2025 & 2033
- Figure 46: South America Legumes Industry Revenue (billion), by Price Trend Analysis 2025 & 2033
- Figure 47: South America Legumes Industry Revenue Share (%), by Price Trend Analysis 2025 & 2033
- Figure 48: South America Legumes Industry Revenue (billion), by Country 2025 & 2033
- Figure 49: South America Legumes Industry Revenue Share (%), by Country 2025 & 2033
- Figure 50: Middle East and Africa Legumes Industry Revenue (billion), by Production Analysis 2025 & 2033
- Figure 51: Middle East and Africa Legumes Industry Revenue Share (%), by Production Analysis 2025 & 2033
- Figure 52: Middle East and Africa Legumes Industry Revenue (billion), by Consumption Analysis 2025 & 2033
- Figure 53: Middle East and Africa Legumes Industry Revenue Share (%), by Consumption Analysis 2025 & 2033
- Figure 54: Middle East and Africa Legumes Industry Revenue (billion), by Import Market Analysis (Value & Volume) 2025 & 2033
- Figure 55: Middle East and Africa Legumes Industry Revenue Share (%), by Import Market Analysis (Value & Volume) 2025 & 2033
- Figure 56: Middle East and Africa Legumes Industry Revenue (billion), by Export Market Analysis (Value & Volume) 2025 & 2033
- Figure 57: Middle East and Africa Legumes Industry Revenue Share (%), by Export Market Analysis (Value & Volume) 2025 & 2033
- Figure 58: Middle East and Africa Legumes Industry Revenue (billion), by Price Trend Analysis 2025 & 2033
- Figure 59: Middle East and Africa Legumes Industry Revenue Share (%), by Price Trend Analysis 2025 & 2033
- Figure 60: Middle East and Africa Legumes Industry Revenue (billion), by Country 2025 & 2033
- Figure 61: Middle East and Africa Legumes Industry Revenue Share (%), by Country 2025 & 2033
List of Tables
- Table 1: Global Legumes Industry Revenue billion Forecast, by Production Analysis 2020 & 2033
- Table 2: Global Legumes Industry Revenue billion Forecast, by Consumption Analysis 2020 & 2033
- Table 3: Global Legumes Industry Revenue billion Forecast, by Import Market Analysis (Value & Volume) 2020 & 2033
- Table 4: Global Legumes Industry Revenue billion Forecast, by Export Market Analysis (Value & Volume) 2020 & 2033
- Table 5: Global Legumes Industry Revenue billion Forecast, by Price Trend Analysis 2020 & 2033
- Table 6: Global Legumes Industry Revenue billion Forecast, by Region 2020 & 2033
- Table 7: Global Legumes Industry Revenue billion Forecast, by Production Analysis 2020 & 2033
- Table 8: Global Legumes Industry Revenue billion Forecast, by Consumption Analysis 2020 & 2033
- Table 9: Global Legumes Industry Revenue billion Forecast, by Import Market Analysis (Value & Volume) 2020 & 2033
- Table 10: Global Legumes Industry Revenue billion Forecast, by Export Market Analysis (Value & Volume) 2020 & 2033
- Table 11: Global Legumes Industry Revenue billion Forecast, by Price Trend Analysis 2020 & 2033
- Table 12: Global Legumes Industry Revenue billion Forecast, by Country 2020 & 2033
- Table 13: United States Legumes Industry Revenue (billion) Forecast, by Application 2020 & 2033
- Table 14: Mexico Legumes Industry Revenue (billion) Forecast, by Application 2020 & 2033
- Table 15: Global Legumes Industry Revenue billion Forecast, by Production Analysis 2020 & 2033
- Table 16: Global Legumes Industry Revenue billion Forecast, by Consumption Analysis 2020 & 2033
- Table 17: Global Legumes Industry Revenue billion Forecast, by Import Market Analysis (Value & Volume) 2020 & 2033
- Table 18: Global Legumes Industry Revenue billion Forecast, by Export Market Analysis (Value & Volume) 2020 & 2033
- Table 19: Global Legumes Industry Revenue billion Forecast, by Price Trend Analysis 2020 & 2033
- Table 20: Global Legumes Industry Revenue billion Forecast, by Country 2020 & 2033
- Table 21: Russia Legumes Industry Revenue (billion) Forecast, by Application 2020 & 2033
- Table 22: Turkey Legumes Industry Revenue (billion) Forecast, by Application 2020 & 2033
- Table 23: Italy Legumes Industry Revenue (billion) Forecast, by Application 2020 & 2033
- Table 24: Global Legumes Industry Revenue billion Forecast, by Production Analysis 2020 & 2033
- Table 25: Global Legumes Industry Revenue billion Forecast, by Consumption Analysis 2020 & 2033
- Table 26: Global Legumes Industry Revenue billion Forecast, by Import Market Analysis (Value & Volume) 2020 & 2033
- Table 27: Global Legumes Industry Revenue billion Forecast, by Export Market Analysis (Value & Volume) 2020 & 2033
- Table 28: Global Legumes Industry Revenue billion Forecast, by Price Trend Analysis 2020 & 2033
- Table 29: Global Legumes Industry Revenue billion Forecast, by Country 2020 & 2033
- Table 30: Myanmar Legumes Industry Revenue (billion) Forecast, by Application 2020 & 2033
- Table 31: India Legumes Industry Revenue (billion) Forecast, by Application 2020 & 2033
- Table 32: China Legumes Industry Revenue (billion) Forecast, by Application 2020 & 2033
- Table 33: Australia Legumes Industry Revenue (billion) Forecast, by Application 2020 & 2033
- Table 34: Global Legumes Industry Revenue billion Forecast, by Production Analysis 2020 & 2033
- Table 35: Global Legumes Industry Revenue billion Forecast, by Consumption Analysis 2020 & 2033
- Table 36: Global Legumes Industry Revenue billion Forecast, by Import Market Analysis (Value & Volume) 2020 & 2033
- Table 37: Global Legumes Industry Revenue billion Forecast, by Export Market Analysis (Value & Volume) 2020 & 2033
- Table 38: Global Legumes Industry Revenue billion Forecast, by Price Trend Analysis 2020 & 2033
- Table 39: Global Legumes Industry Revenue billion Forecast, by Country 2020 & 2033
- Table 40: Argentina Legumes Industry Revenue (billion) Forecast, by Application 2020 & 2033
- Table 41: Brazil Legumes Industry Revenue (billion) Forecast, by Application 2020 & 2033
- Table 42: Global Legumes Industry Revenue billion Forecast, by Production Analysis 2020 & 2033
- Table 43: Global Legumes Industry Revenue billion Forecast, by Consumption Analysis 2020 & 2033
- Table 44: Global Legumes Industry Revenue billion Forecast, by Import Market Analysis (Value & Volume) 2020 & 2033
- Table 45: Global Legumes Industry Revenue billion Forecast, by Export Market Analysis (Value & Volume) 2020 & 2033
- Table 46: Global Legumes Industry Revenue billion Forecast, by Price Trend Analysis 2020 & 2033
- Table 47: Global Legumes Industry Revenue billion Forecast, by Country 2020 & 2033
- Table 48: United Republic of Tanzania Legumes Industry Revenue (billion) Forecast, by Application 2020 & 2033
- Table 49: Uganda Legumes Industry Revenue (billion) Forecast, by Application 2020 & 2033
- Table 50: Kenya Legumes Industry Revenue (billion) Forecast, by Application 2020 & 2033
Frequently Asked Questions
1. What is the projected Compound Annual Growth Rate (CAGR) of the Legumes Industry?
The projected CAGR is approximately 5.5%.
2. Which companies are prominent players in the Legumes Industry?
Key companies in the market include Archer Daniels Midland , Bunge , GrainCorp, Louis Dreyfus Company, Cargill .
3. What are the main segments of the Legumes Industry?
The market segments include Production Analysis, Consumption Analysis, Import Market Analysis (Value & Volume), Export Market Analysis (Value & Volume), Price Trend Analysis.
4. Can you provide details about the market size?
The market size is estimated to be USD 14.23 billion as of 2022.
5. What are some drivers contributing to market growth?
Increasing Berry Consumption for Health Benefits; Increasing Adoption of High-Technology Farm Practices; Growing Usage of Berries in the Food and Beverage Industries.
6. What are the notable trends driving market growth?
Increasing Inclination Toward Vegan Diet.
7. Are there any restraints impacting market growth?
High Production Cost Involved in Berry Production; Increasing Disease and Pest Infestations.
8. Can you provide examples of recent developments in the market?
N/A
9. What pricing options are available for accessing the report?
Pricing options include single-user, multi-user, and enterprise licenses priced at USD 4750, USD 5250, and USD 8750 respectively.
10. Is the market size provided in terms of value or volume?
The market size is provided in terms of value, measured in billion.
11. Are there any specific market keywords associated with the report?
Yes, the market keyword associated with the report is "Legumes Industry," which aids in identifying and referencing the specific market segment covered.
12. How do I determine which pricing option suits my needs best?
The pricing options vary based on user requirements and access needs. Individual users may opt for single-user licenses, while businesses requiring broader access may choose multi-user or enterprise licenses for cost-effective access to the report.
13. Are there any additional resources or data provided in the Legumes Industry report?
While the report offers comprehensive insights, it's advisable to review the specific contents or supplementary materials provided to ascertain if additional resources or data are available.
14. How can I stay updated on further developments or reports in the Legumes Industry?
To stay informed about further developments, trends, and reports in the Legumes Industry, consider subscribing to industry newsletters, following relevant companies and organizations, or regularly checking reputable industry news sources and publications.
Methodology
Step 1 - Identification of Relevant Samples Size from Population Database


Step 2 - Approaches for Defining Global Market Size (Value, Volume* & Price*)

Note*: In applicable scenarios
Step 3 - Data Sources
Primary Research
- Web Analytics
- Survey Reports
- Research Institute
- Latest Research Reports
- Opinion Leaders
Secondary Research
- Annual Reports
- White Paper
- Latest Press Release
- Industry Association
- Paid Database
- Investor Presentations

Step 4 - Data Triangulation
Involves using different sources of information in order to increase the validity of a study
These sources are likely to be stakeholders in a program - participants, other researchers, program staff, other community members, and so on.
Then we put all data in single framework & apply various statistical tools to find out the dynamic on the market.
During the analysis stage, feedback from the stakeholder groups would be compared to determine areas of agreement as well as areas of divergence