

Key Insights
The global Potash Ores Market is poised for substantial growth, with an estimated market size of $66.11 billion in 2025. This expansion is driven by a robust Compound Annual Growth Rate (CAGR) of 8.9%, indicating a healthy and sustained upward trajectory for the market. The increasing demand for fertilizers to enhance agricultural productivity, driven by a growing global population and the need for food security, serves as a primary catalyst. Furthermore, advancements in mining technologies and an increased focus on sustainable agricultural practices are contributing to the market's positive outlook. Emerging economies, particularly in Asia Pacific and South America, are expected to be key growth regions due to their expanding agricultural sectors and rising disposable incomes, leading to greater investment in crop nutrition.

Potash Ores Market Market Size (In Billion)
The market is segmented into production, consumption, import, export, and price trend analyses, offering a comprehensive view of the industry's dynamics. Key players like The Mosaic Co, Nutrien Limited, and Coromandel International Ltd are actively engaged in strategic expansions and product innovations to capture a larger market share. While the market demonstrates strong growth potential, certain restraints such as stringent environmental regulations, volatile raw material prices, and geopolitical uncertainties could pose challenges. However, the overall trend indicates a resilient market, with companies investing in research and development to offer specialized potash-based fertilizers and explore new applications. The forecast period of 2025-2033 is expected to witness a significant increase in market value, underscoring the vital role of potash in global agriculture and industry.

Potash Ores Market Company Market Share
Potash Ores Market: Comprehensive Analysis and Future Outlook (2019–2033)
This in-depth report provides a detailed analysis of the global Potash Ores Market, a critical component of the broader fertilizer industry. Covering the period from 2019 to 2033, with a base year of 2025 and a forecast period extending to 2033, this report offers strategic insights into market dynamics, growth trends, regional dominance, product landscape, key drivers, barriers, emerging opportunities, growth accelerators, and the competitive landscape. Utilizing advanced analytical methodologies, the report quantifies market size, CAGR, and regional market shares in billions of units, offering a comprehensive understanding of the parent and child markets within the fertilizer value chain.
Potash Ores Market Market Dynamics & Structure
The global Potash Ores Market is characterized by a moderate to high level of concentration, with a few key players dominating global production and supply. Technological innovation is a significant driver, particularly in optimizing extraction efficiency, reducing environmental impact, and developing more targeted nutrient delivery systems. Regulatory frameworks, including environmental regulations and trade policies, play a crucial role in shaping market access and operational costs. The threat of competitive product substitutes, though currently limited for essential potash, exists in the form of alternative nutrient sources and advanced agricultural practices that optimize nutrient uptake. End-user demographics, primarily the agricultural sector and its growing demand for food security, profoundly influence market expansion. Mergers and acquisitions (M&A) are a recurring trend, as larger companies seek to consolidate market share, secure raw material access, and expand their geographical reach. For instance, the market has seen strategic acquisitions to bolster distribution networks and integrate downstream fertilizer production. Innovation barriers include the capital-intensive nature of potash mining, the geographical constraints of ore deposits, and the stringent environmental compliance required for extraction.
- Market Concentration: Dominated by major global producers.
- Technological Innovation: Focus on efficiency, sustainability, and precision agriculture.
- Regulatory Impact: Environmental, trade, and agricultural policies are key influences.
- End-User Demand: Driven by global food security needs and agricultural output.
- M&A Activity: Strategic consolidation for market share and resource access.
Potash Ores Market Growth Trends & Insights
The Potash Ores Market is projected to experience robust growth over the forecast period (2025–2033), driven by an increasing global population and the subsequent demand for enhanced agricultural productivity. The market size is expected to witness a Compound Annual Growth Rate (CAGR) of approximately 4.5%, reaching an estimated value of $85 billion by 2033. Adoption rates of potash fertilizers are steadily increasing, particularly in emerging economies where agricultural modernization is a priority. Technological disruptions are emerging in the form of enhanced mining techniques and bio-based fertilizers that aim to complement or optimize the use of traditional potash. Consumer behavior shifts, influenced by a growing awareness of sustainable agriculture and food quality, are also indirectly impacting the demand for efficient nutrient management, thus bolstering the demand for potash. Market penetration in regions with historically lower fertilizer usage is expected to be a key growth driver.
Dominant Regions, Countries, or Segments in Potash Ores Market
North America, particularly Canada, stands as a dominant region in the Potash Ores Market, driven by its extensive, high-grade potash reserves and well-established mining infrastructure. This region consistently leads in Production Analysis, contributing a significant share to the global supply. In terms of Consumption Analysis, Asia Pacific, led by China and India, exhibits substantial growth due to its vast agricultural sector and increasing efforts to improve crop yields and food security. The Import Market Analysis reveals strong demand in both developed and developing nations, with Europe and South America being significant importers. Export Market Analysis highlights Canada, Russia, and Belarus as major exporters. The Price Trend Analysis indicates that global supply-demand dynamics, geopolitical factors, and production costs significantly influence potash prices. Economic policies supporting agricultural development and infrastructure improvements in key consuming nations are critical growth drivers in these regions.
- Production Dominance: North America (Canada) due to abundant reserves and infrastructure.
- Consumption Growth: Asia Pacific (China, India) fueled by agricultural expansion.
- Import Hubs: Europe and South America demonstrating strong import reliance.
- Export Powerhouses: Canada, Russia, and Belarus as key global suppliers.
- Price Influences: Supply-demand, geopolitical events, and production economics.
Potash Ores Market Product Landscape
The Potash Ores Market primarily revolves around the extraction and processing of potash, a vital source of potassium for plant nutrition. Key products include Muriate of Potash (MOP), Sulfate of Potash (SOP), and Potassium Nitrate. MOP is the most widely used due to its cost-effectiveness and high potassium content. SOP is preferred for certain crops and soil conditions, particularly those sensitive to chloride. Potassium Nitrate offers both potassium and nitrogen, valuable for specific growth stages. Technological advancements are focused on enhancing the purity of extracted potash, developing more efficient granulation and packaging for better handling and application, and exploring innovative fertilizer blends that optimize nutrient release and plant uptake. The unique selling proposition of potash lies in its indispensable role in plant physiology, contributing to water regulation, nutrient transport, and disease resistance.
Key Drivers, Barriers & Challenges in Potash Ores Market
Key Drivers:
- Growing Global Food Demand: Increasing population necessitates higher agricultural output, driving fertilizer consumption.
- Agricultural Intensification: Efforts to improve crop yields per hectare rely heavily on nutrient management.
- Government Support for Agriculture: Policies promoting fertilizer use and agricultural modernization in developing nations.
- Technological Advancements in Mining: Improved extraction techniques leading to increased efficiency and lower costs.
Barriers & Challenges:
- High Capital Investment: Establishing new potash mines requires significant upfront capital.
- Environmental Regulations: Stringent rules regarding mining operations, waste disposal, and water usage.
- Geopolitical Instability: Disruptions in supply chains due to conflicts or trade disputes can impact availability and pricing.
- Logistical Complexities: Transportation of bulk commodities from remote mining locations to global markets.
- Market Price Volatility: Fluctuations in global potash prices can affect profitability for producers.
Emerging Opportunities in Potash Ores Market
Emerging opportunities in the Potash Ores Market are centered on enhancing sustainable agriculture practices and exploring new market geographies. The development of advanced potash formulations, such as slow-release and controlled-release fertilizers, caters to the growing demand for precision agriculture and reduced environmental impact. Untapped markets in Africa and parts of Southeast Asia, where fertilizer adoption rates are still relatively low but agricultural potential is high, present significant growth prospects. Furthermore, research into the synergistic effects of potash with bio-fertilizers and soil amendments opens avenues for integrated nutrient management solutions. The increasing focus on soil health and long-term fertility management also creates demand for high-quality potash products that contribute to robust soil ecosystems.
Growth Accelerators in the Potash Ores Market Industry
Several catalysts are accelerating the growth of the Potash Ores Market. Technological breakthroughs in in-situ leaching and enhanced mining efficiencies are reducing production costs and increasing output. Strategic partnerships between mining companies and fertilizer distributors are crucial for expanding market reach and ensuring consistent supply to end-users. Market expansion strategies, including exploring new geographical regions and developing tailored product offerings for specific crop and soil needs, are also driving growth. The increasing adoption of digital farming technologies that provide data-driven insights into nutrient requirements further fuels the demand for precisely applied potash.
Key Players Shaping the Potash Ores Market Market
- The Mosaic Co
- Coromandel International Ltd
- Nutrien Limited
- Sociedad Química y Minera (SQM)
- Petrokemija DD Fertilizer Factory
- Sinofert Holdings Ltd
- Eurochem
- Intrepid Potash Inc
- K+S AKTIENGESELLSCHAFT
Notable Milestones in Potash Ores Market Sector
- March 2022: EuroChem Group announced the completion of its purchase of controlling shares (51.48%) in Brazilian distributor Fertilizantes Heringer SA, strengthening its production and distribution capacity in Brazil.
- March 2021: Mosaic partnered with Sound Agriculture to develop and distribute a nutrient efficiency product leveraging bio-inspired chemistry to activate soil microbiomes and optimize fertilizer inputs. The product was expected to be released in the US market in 2023.
- February 2019: Nutrien Ltd. acquired Van Horn, Inc., a leading US retailer and agricultural services provider, to expand its retail business and customer base.
In-Depth Potash Ores Market Market Outlook
The future outlook for the Potash Ores Market is exceptionally promising, driven by an unwavering global demand for food and the imperative for sustainable agricultural intensification. Growth accelerators such as technological advancements in extraction and fertilizer application, alongside strategic collaborations and expansions into emerging markets, are poised to significantly shape the market trajectory. The increasing recognition of potash's critical role in crop resilience, yield optimization, and overall plant health, coupled with evolving consumer preferences for responsibly produced food, positions the market for sustained expansion. Future growth will also be influenced by the industry's ability to navigate environmental challenges and adapt to changing regulatory landscapes, ensuring a consistent and responsible supply of this essential nutrient for global agriculture.
Potash Ores Market Segmentation
- 1. Production Analysis
- 2. Consumption Analysis
- 3. Import Market Analysis (Value & Volume)
- 4. Export Market Analysis (Value & Volume)
- 5. Price Trend Analysis
Potash Ores Market Segmentation By Geography
-
1. North America
- 1.1. United States
- 1.2. Canada
- 1.3. Mexico
-
2. South America
- 2.1. Brazil
- 2.2. Argentina
- 2.3. Rest of South America
-
3. Europe
- 3.1. United Kingdom
- 3.2. Germany
- 3.3. France
- 3.4. Italy
- 3.5. Spain
- 3.6. Russia
- 3.7. Benelux
- 3.8. Nordics
- 3.9. Rest of Europe
-
4. Middle East & Africa
- 4.1. Turkey
- 4.2. Israel
- 4.3. GCC
- 4.4. North Africa
- 4.5. South Africa
- 4.6. Rest of Middle East & Africa
-
5. Asia Pacific
- 5.1. China
- 5.2. India
- 5.3. Japan
- 5.4. South Korea
- 5.5. ASEAN
- 5.6. Oceania
- 5.7. Rest of Asia Pacific
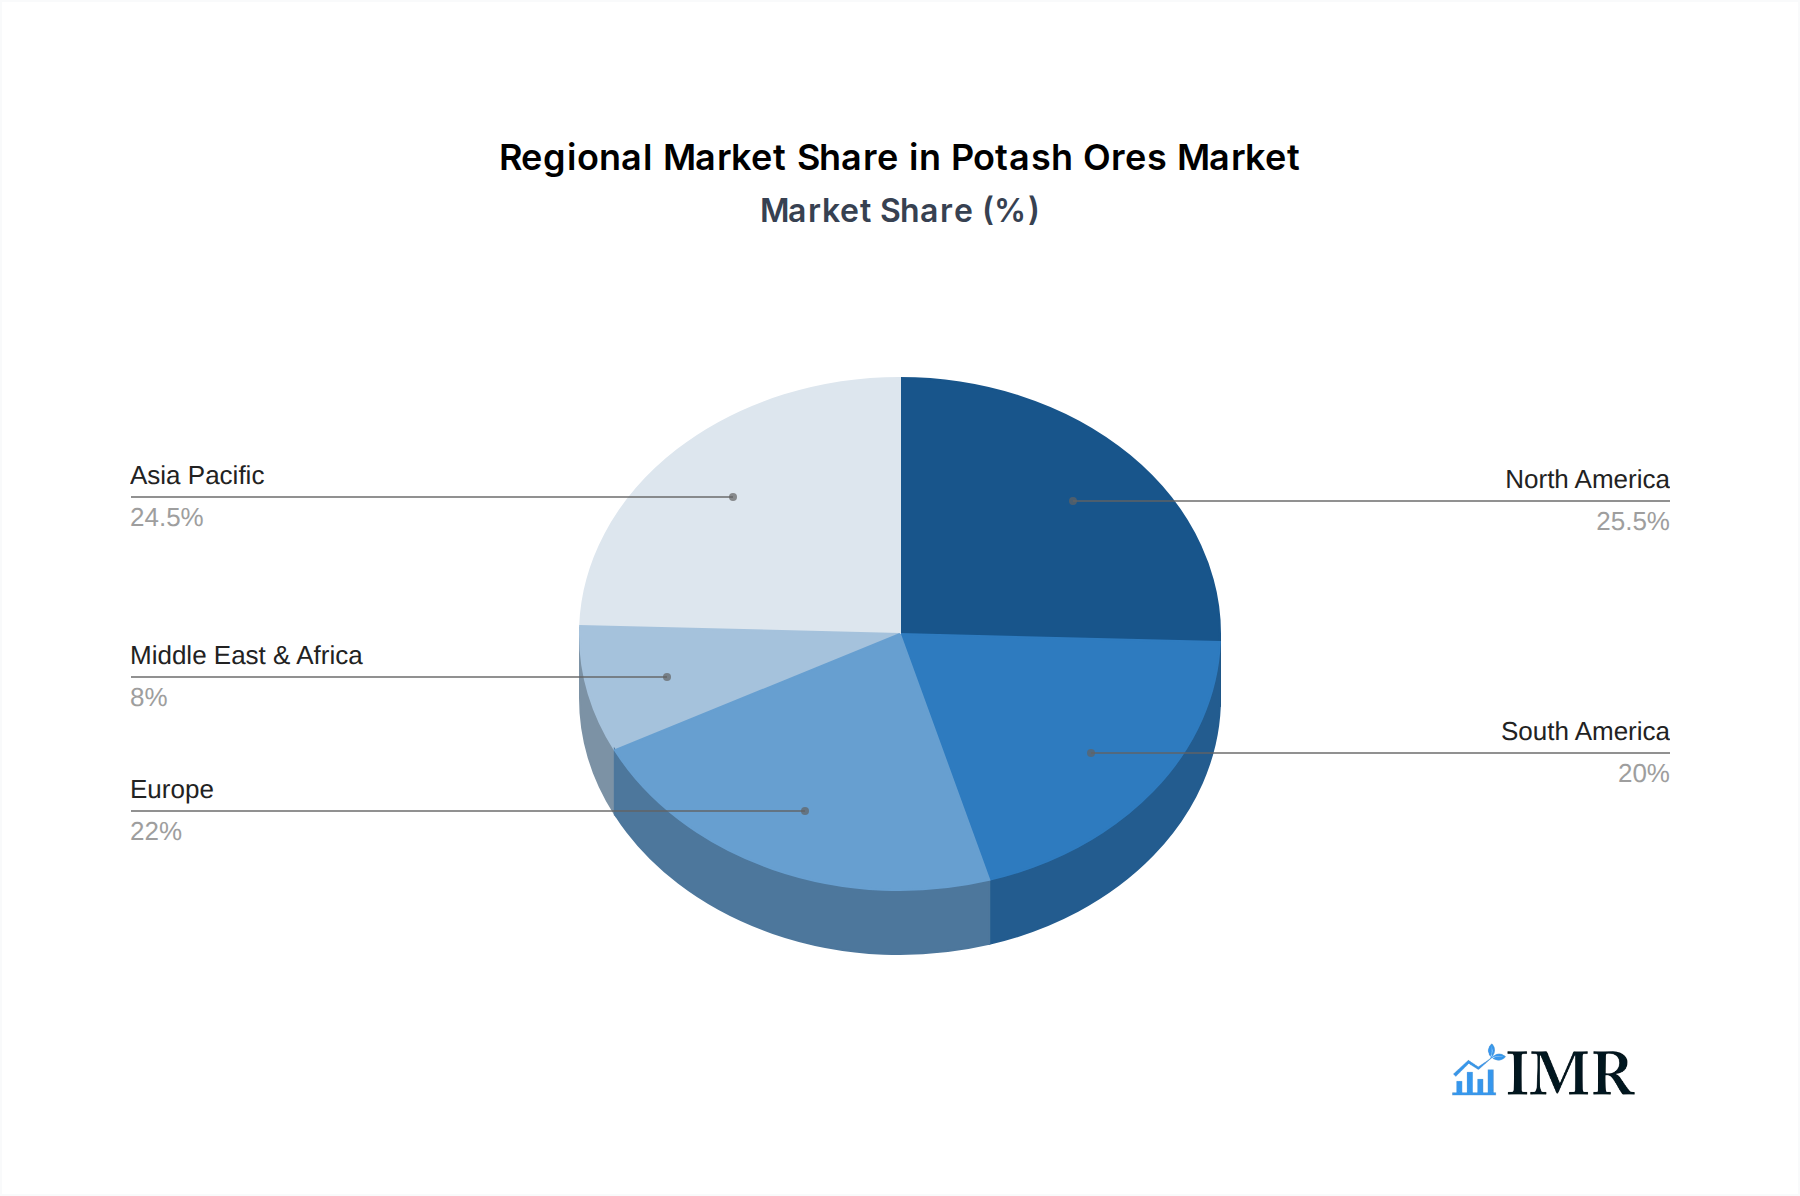
Potash Ores Market Regional Market Share
Geographic Coverage of Potash Ores Market
Potash Ores Market REPORT HIGHLIGHTS
| Aspects | Details |
|---|---|
| Study Period | 2020-2034 |
| Base Year | 2025 |
| Estimated Year | 2026 |
| Forecast Period | 2026-2034 |
| Historical Period | 2020-2025 |
| Growth Rate | CAGR of 8.9% from 2020-2034 |
| Segmentation |
|
Table of Contents
- 1. Introduction
- 1.1. Research Scope
- 1.2. Market Segmentation
- 1.3. Research Objective
- 1.4. Definitions and Assumptions
- 2. Executive Summary
- 2.1. Market Snapshot
- 3. Market Dynamics
- 3.1. Market Drivers
- 3.2. Market Restrains
- 3.3. Market Trends
- 3.4. Market Opportunities
- 4. Market Factor Analysis
- 4.1. Porters Five Forces
- 4.1.1. Bargaining Power of Suppliers
- 4.1.2. Bargaining Power of Buyers
- 4.1.3. Threat of New Entrants
- 4.1.4. Threat of Substitutes
- 4.1.5. Competitive Rivalry
- 4.2. PESTEL analysis
- 4.3. BCG Analysis
- 4.3.1. Stars (High Growth, High Market Share)
- 4.3.2. Cash Cows (Low Growth, High Market Share)
- 4.3.3. Question Mark (High Growth, Low Market Share)
- 4.3.4. Dogs (Low Growth, Low Market Share)
- 4.4. Ansoff Matrix Analysis
- 4.5. Supply Chain Analysis
- 4.6. Regulatory Landscape
- 4.7. Current Market Potential and Opportunity Assessment (TAM–SAM–SOM Framework)
- 4.8. IMR Analyst Note
- 4.1. Porters Five Forces
- 5. Market Analysis, Insights and Forecast 2021-2033
- 5.1. Market Analysis, Insights and Forecast - by Production Analysis
- 5.2. Market Analysis, Insights and Forecast - by Consumption Analysis
- 5.3. Market Analysis, Insights and Forecast - by Import Market Analysis (Value & Volume)
- 5.4. Market Analysis, Insights and Forecast - by Export Market Analysis (Value & Volume)
- 5.5. Market Analysis, Insights and Forecast - by Price Trend Analysis
- 5.6. Market Analysis, Insights and Forecast - by Region
- 5.6.1. North America
- 5.6.2. South America
- 5.6.3. Europe
- 5.6.4. Middle East & Africa
- 5.6.5. Asia Pacific
- 6. Global Potash Ores Market Analysis, Insights and Forecast, 2021-2033
- 6.1. Market Analysis, Insights and Forecast - by Production Analysis
- 6.2. Market Analysis, Insights and Forecast - by Consumption Analysis
- 6.3. Market Analysis, Insights and Forecast - by Import Market Analysis (Value & Volume)
- 6.4. Market Analysis, Insights and Forecast - by Export Market Analysis (Value & Volume)
- 6.5. Market Analysis, Insights and Forecast - by Price Trend Analysis
- 7. North America Potash Ores Market Analysis, Insights and Forecast, 2020-2032
- 7.1. Market Analysis, Insights and Forecast - by Production Analysis
- 7.2. Market Analysis, Insights and Forecast - by Consumption Analysis
- 7.3. Market Analysis, Insights and Forecast - by Import Market Analysis (Value & Volume)
- 7.4. Market Analysis, Insights and Forecast - by Export Market Analysis (Value & Volume)
- 7.5. Market Analysis, Insights and Forecast - by Price Trend Analysis
- 8. South America Potash Ores Market Analysis, Insights and Forecast, 2020-2032
- 8.1. Market Analysis, Insights and Forecast - by Production Analysis
- 8.2. Market Analysis, Insights and Forecast - by Consumption Analysis
- 8.3. Market Analysis, Insights and Forecast - by Import Market Analysis (Value & Volume)
- 8.4. Market Analysis, Insights and Forecast - by Export Market Analysis (Value & Volume)
- 8.5. Market Analysis, Insights and Forecast - by Price Trend Analysis
- 9. Europe Potash Ores Market Analysis, Insights and Forecast, 2020-2032
- 9.1. Market Analysis, Insights and Forecast - by Production Analysis
- 9.2. Market Analysis, Insights and Forecast - by Consumption Analysis
- 9.3. Market Analysis, Insights and Forecast - by Import Market Analysis (Value & Volume)
- 9.4. Market Analysis, Insights and Forecast - by Export Market Analysis (Value & Volume)
- 9.5. Market Analysis, Insights and Forecast - by Price Trend Analysis
- 10. Middle East & Africa Potash Ores Market Analysis, Insights and Forecast, 2020-2032
- 10.1. Market Analysis, Insights and Forecast - by Production Analysis
- 10.2. Market Analysis, Insights and Forecast - by Consumption Analysis
- 10.3. Market Analysis, Insights and Forecast - by Import Market Analysis (Value & Volume)
- 10.4. Market Analysis, Insights and Forecast - by Export Market Analysis (Value & Volume)
- 10.5. Market Analysis, Insights and Forecast - by Price Trend Analysis
- 11. Asia Pacific Potash Ores Market Analysis, Insights and Forecast, 2020-2032
- 11.1. Market Analysis, Insights and Forecast - by Production Analysis
- 11.2. Market Analysis, Insights and Forecast - by Consumption Analysis
- 11.3. Market Analysis, Insights and Forecast - by Import Market Analysis (Value & Volume)
- 11.4. Market Analysis, Insights and Forecast - by Export Market Analysis (Value & Volume)
- 11.5. Market Analysis, Insights and Forecast - by Price Trend Analysis
- 12. Competitive Analysis
- 12.1. Company Profiles
- 12.1.1 The Mosaic Co
- 12.1.1.1. Company Overview
- 12.1.1.2. Products
- 12.1.1.3. Company Financials
- 12.1.1.4. SWOT Analysis
- 12.1.2 Coromandel International Ltd
- 12.1.2.1. Company Overview
- 12.1.2.2. Products
- 12.1.2.3. Company Financials
- 12.1.2.4. SWOT Analysis
- 12.1.3 Nutrien Limited
- 12.1.3.1. Company Overview
- 12.1.3.2. Products
- 12.1.3.3. Company Financials
- 12.1.3.4. SWOT Analysis
- 12.1.4 Sociedad Química y Minera (SQM)
- 12.1.4.1. Company Overview
- 12.1.4.2. Products
- 12.1.4.3. Company Financials
- 12.1.4.4. SWOT Analysis
- 12.1.5 Petrokemija DD Fertilizer Factory
- 12.1.5.1. Company Overview
- 12.1.5.2. Products
- 12.1.5.3. Company Financials
- 12.1.5.4. SWOT Analysis
- 12.1.6 Sinofert Holdings Ltd
- 12.1.6.1. Company Overview
- 12.1.6.2. Products
- 12.1.6.3. Company Financials
- 12.1.6.4. SWOT Analysis
- 12.1.7 Eurochem
- 12.1.7.1. Company Overview
- 12.1.7.2. Products
- 12.1.7.3. Company Financials
- 12.1.7.4. SWOT Analysis
- 12.1.8 Intrepid Potash Inc
- 12.1.8.1. Company Overview
- 12.1.8.2. Products
- 12.1.8.3. Company Financials
- 12.1.8.4. SWOT Analysis
- 12.1.9 K+S AKTIENGESELLSCHAFT
- 12.1.9.1. Company Overview
- 12.1.9.2. Products
- 12.1.9.3. Company Financials
- 12.1.9.4. SWOT Analysis
- 12.1.1 The Mosaic Co
- 12.2. Market Entropy
- 12.2.1 Company's Key Areas Served
- 12.2.2 Recent Developments
- 12.3. Company Market Share Analysis 2025
- 12.3.1 Top 5 Companies Market Share Analysis
- 12.3.2 Top 3 Companies Market Share Analysis
- 12.4. List of Potential Customers
- 13. Research Methodology
List of Figures
- Figure 1: Global Potash Ores Market Revenue Breakdown (billion, %) by Region 2025 & 2033
- Figure 2: North America Potash Ores Market Revenue (billion), by Production Analysis 2025 & 2033
- Figure 3: North America Potash Ores Market Revenue Share (%), by Production Analysis 2025 & 2033
- Figure 4: North America Potash Ores Market Revenue (billion), by Consumption Analysis 2025 & 2033
- Figure 5: North America Potash Ores Market Revenue Share (%), by Consumption Analysis 2025 & 2033
- Figure 6: North America Potash Ores Market Revenue (billion), by Import Market Analysis (Value & Volume) 2025 & 2033
- Figure 7: North America Potash Ores Market Revenue Share (%), by Import Market Analysis (Value & Volume) 2025 & 2033
- Figure 8: North America Potash Ores Market Revenue (billion), by Export Market Analysis (Value & Volume) 2025 & 2033
- Figure 9: North America Potash Ores Market Revenue Share (%), by Export Market Analysis (Value & Volume) 2025 & 2033
- Figure 10: North America Potash Ores Market Revenue (billion), by Price Trend Analysis 2025 & 2033
- Figure 11: North America Potash Ores Market Revenue Share (%), by Price Trend Analysis 2025 & 2033
- Figure 12: North America Potash Ores Market Revenue (billion), by Country 2025 & 2033
- Figure 13: North America Potash Ores Market Revenue Share (%), by Country 2025 & 2033
- Figure 14: South America Potash Ores Market Revenue (billion), by Production Analysis 2025 & 2033
- Figure 15: South America Potash Ores Market Revenue Share (%), by Production Analysis 2025 & 2033
- Figure 16: South America Potash Ores Market Revenue (billion), by Consumption Analysis 2025 & 2033
- Figure 17: South America Potash Ores Market Revenue Share (%), by Consumption Analysis 2025 & 2033
- Figure 18: South America Potash Ores Market Revenue (billion), by Import Market Analysis (Value & Volume) 2025 & 2033
- Figure 19: South America Potash Ores Market Revenue Share (%), by Import Market Analysis (Value & Volume) 2025 & 2033
- Figure 20: South America Potash Ores Market Revenue (billion), by Export Market Analysis (Value & Volume) 2025 & 2033
- Figure 21: South America Potash Ores Market Revenue Share (%), by Export Market Analysis (Value & Volume) 2025 & 2033
- Figure 22: South America Potash Ores Market Revenue (billion), by Price Trend Analysis 2025 & 2033
- Figure 23: South America Potash Ores Market Revenue Share (%), by Price Trend Analysis 2025 & 2033
- Figure 24: South America Potash Ores Market Revenue (billion), by Country 2025 & 2033
- Figure 25: South America Potash Ores Market Revenue Share (%), by Country 2025 & 2033
- Figure 26: Europe Potash Ores Market Revenue (billion), by Production Analysis 2025 & 2033
- Figure 27: Europe Potash Ores Market Revenue Share (%), by Production Analysis 2025 & 2033
- Figure 28: Europe Potash Ores Market Revenue (billion), by Consumption Analysis 2025 & 2033
- Figure 29: Europe Potash Ores Market Revenue Share (%), by Consumption Analysis 2025 & 2033
- Figure 30: Europe Potash Ores Market Revenue (billion), by Import Market Analysis (Value & Volume) 2025 & 2033
- Figure 31: Europe Potash Ores Market Revenue Share (%), by Import Market Analysis (Value & Volume) 2025 & 2033
- Figure 32: Europe Potash Ores Market Revenue (billion), by Export Market Analysis (Value & Volume) 2025 & 2033
- Figure 33: Europe Potash Ores Market Revenue Share (%), by Export Market Analysis (Value & Volume) 2025 & 2033
- Figure 34: Europe Potash Ores Market Revenue (billion), by Price Trend Analysis 2025 & 2033
- Figure 35: Europe Potash Ores Market Revenue Share (%), by Price Trend Analysis 2025 & 2033
- Figure 36: Europe Potash Ores Market Revenue (billion), by Country 2025 & 2033
- Figure 37: Europe Potash Ores Market Revenue Share (%), by Country 2025 & 2033
- Figure 38: Middle East & Africa Potash Ores Market Revenue (billion), by Production Analysis 2025 & 2033
- Figure 39: Middle East & Africa Potash Ores Market Revenue Share (%), by Production Analysis 2025 & 2033
- Figure 40: Middle East & Africa Potash Ores Market Revenue (billion), by Consumption Analysis 2025 & 2033
- Figure 41: Middle East & Africa Potash Ores Market Revenue Share (%), by Consumption Analysis 2025 & 2033
- Figure 42: Middle East & Africa Potash Ores Market Revenue (billion), by Import Market Analysis (Value & Volume) 2025 & 2033
- Figure 43: Middle East & Africa Potash Ores Market Revenue Share (%), by Import Market Analysis (Value & Volume) 2025 & 2033
- Figure 44: Middle East & Africa Potash Ores Market Revenue (billion), by Export Market Analysis (Value & Volume) 2025 & 2033
- Figure 45: Middle East & Africa Potash Ores Market Revenue Share (%), by Export Market Analysis (Value & Volume) 2025 & 2033
- Figure 46: Middle East & Africa Potash Ores Market Revenue (billion), by Price Trend Analysis 2025 & 2033
- Figure 47: Middle East & Africa Potash Ores Market Revenue Share (%), by Price Trend Analysis 2025 & 2033
- Figure 48: Middle East & Africa Potash Ores Market Revenue (billion), by Country 2025 & 2033
- Figure 49: Middle East & Africa Potash Ores Market Revenue Share (%), by Country 2025 & 2033
- Figure 50: Asia Pacific Potash Ores Market Revenue (billion), by Production Analysis 2025 & 2033
- Figure 51: Asia Pacific Potash Ores Market Revenue Share (%), by Production Analysis 2025 & 2033
- Figure 52: Asia Pacific Potash Ores Market Revenue (billion), by Consumption Analysis 2025 & 2033
- Figure 53: Asia Pacific Potash Ores Market Revenue Share (%), by Consumption Analysis 2025 & 2033
- Figure 54: Asia Pacific Potash Ores Market Revenue (billion), by Import Market Analysis (Value & Volume) 2025 & 2033
- Figure 55: Asia Pacific Potash Ores Market Revenue Share (%), by Import Market Analysis (Value & Volume) 2025 & 2033
- Figure 56: Asia Pacific Potash Ores Market Revenue (billion), by Export Market Analysis (Value & Volume) 2025 & 2033
- Figure 57: Asia Pacific Potash Ores Market Revenue Share (%), by Export Market Analysis (Value & Volume) 2025 & 2033
- Figure 58: Asia Pacific Potash Ores Market Revenue (billion), by Price Trend Analysis 2025 & 2033
- Figure 59: Asia Pacific Potash Ores Market Revenue Share (%), by Price Trend Analysis 2025 & 2033
- Figure 60: Asia Pacific Potash Ores Market Revenue (billion), by Country 2025 & 2033
- Figure 61: Asia Pacific Potash Ores Market Revenue Share (%), by Country 2025 & 2033
List of Tables
- Table 1: Global Potash Ores Market Revenue billion Forecast, by Production Analysis 2020 & 2033
- Table 2: Global Potash Ores Market Revenue billion Forecast, by Consumption Analysis 2020 & 2033
- Table 3: Global Potash Ores Market Revenue billion Forecast, by Import Market Analysis (Value & Volume) 2020 & 2033
- Table 4: Global Potash Ores Market Revenue billion Forecast, by Export Market Analysis (Value & Volume) 2020 & 2033
- Table 5: Global Potash Ores Market Revenue billion Forecast, by Price Trend Analysis 2020 & 2033
- Table 6: Global Potash Ores Market Revenue billion Forecast, by Region 2020 & 2033
- Table 7: Global Potash Ores Market Revenue billion Forecast, by Production Analysis 2020 & 2033
- Table 8: Global Potash Ores Market Revenue billion Forecast, by Consumption Analysis 2020 & 2033
- Table 9: Global Potash Ores Market Revenue billion Forecast, by Import Market Analysis (Value & Volume) 2020 & 2033
- Table 10: Global Potash Ores Market Revenue billion Forecast, by Export Market Analysis (Value & Volume) 2020 & 2033
- Table 11: Global Potash Ores Market Revenue billion Forecast, by Price Trend Analysis 2020 & 2033
- Table 12: Global Potash Ores Market Revenue billion Forecast, by Country 2020 & 2033
- Table 13: United States Potash Ores Market Revenue (billion) Forecast, by Application 2020 & 2033
- Table 14: Canada Potash Ores Market Revenue (billion) Forecast, by Application 2020 & 2033
- Table 15: Mexico Potash Ores Market Revenue (billion) Forecast, by Application 2020 & 2033
- Table 16: Global Potash Ores Market Revenue billion Forecast, by Production Analysis 2020 & 2033
- Table 17: Global Potash Ores Market Revenue billion Forecast, by Consumption Analysis 2020 & 2033
- Table 18: Global Potash Ores Market Revenue billion Forecast, by Import Market Analysis (Value & Volume) 2020 & 2033
- Table 19: Global Potash Ores Market Revenue billion Forecast, by Export Market Analysis (Value & Volume) 2020 & 2033
- Table 20: Global Potash Ores Market Revenue billion Forecast, by Price Trend Analysis 2020 & 2033
- Table 21: Global Potash Ores Market Revenue billion Forecast, by Country 2020 & 2033
- Table 22: Brazil Potash Ores Market Revenue (billion) Forecast, by Application 2020 & 2033
- Table 23: Argentina Potash Ores Market Revenue (billion) Forecast, by Application 2020 & 2033
- Table 24: Rest of South America Potash Ores Market Revenue (billion) Forecast, by Application 2020 & 2033
- Table 25: Global Potash Ores Market Revenue billion Forecast, by Production Analysis 2020 & 2033
- Table 26: Global Potash Ores Market Revenue billion Forecast, by Consumption Analysis 2020 & 2033
- Table 27: Global Potash Ores Market Revenue billion Forecast, by Import Market Analysis (Value & Volume) 2020 & 2033
- Table 28: Global Potash Ores Market Revenue billion Forecast, by Export Market Analysis (Value & Volume) 2020 & 2033
- Table 29: Global Potash Ores Market Revenue billion Forecast, by Price Trend Analysis 2020 & 2033
- Table 30: Global Potash Ores Market Revenue billion Forecast, by Country 2020 & 2033
- Table 31: United Kingdom Potash Ores Market Revenue (billion) Forecast, by Application 2020 & 2033
- Table 32: Germany Potash Ores Market Revenue (billion) Forecast, by Application 2020 & 2033
- Table 33: France Potash Ores Market Revenue (billion) Forecast, by Application 2020 & 2033
- Table 34: Italy Potash Ores Market Revenue (billion) Forecast, by Application 2020 & 2033
- Table 35: Spain Potash Ores Market Revenue (billion) Forecast, by Application 2020 & 2033
- Table 36: Russia Potash Ores Market Revenue (billion) Forecast, by Application 2020 & 2033
- Table 37: Benelux Potash Ores Market Revenue (billion) Forecast, by Application 2020 & 2033
- Table 38: Nordics Potash Ores Market Revenue (billion) Forecast, by Application 2020 & 2033
- Table 39: Rest of Europe Potash Ores Market Revenue (billion) Forecast, by Application 2020 & 2033
- Table 40: Global Potash Ores Market Revenue billion Forecast, by Production Analysis 2020 & 2033
- Table 41: Global Potash Ores Market Revenue billion Forecast, by Consumption Analysis 2020 & 2033
- Table 42: Global Potash Ores Market Revenue billion Forecast, by Import Market Analysis (Value & Volume) 2020 & 2033
- Table 43: Global Potash Ores Market Revenue billion Forecast, by Export Market Analysis (Value & Volume) 2020 & 2033
- Table 44: Global Potash Ores Market Revenue billion Forecast, by Price Trend Analysis 2020 & 2033
- Table 45: Global Potash Ores Market Revenue billion Forecast, by Country 2020 & 2033
- Table 46: Turkey Potash Ores Market Revenue (billion) Forecast, by Application 2020 & 2033
- Table 47: Israel Potash Ores Market Revenue (billion) Forecast, by Application 2020 & 2033
- Table 48: GCC Potash Ores Market Revenue (billion) Forecast, by Application 2020 & 2033
- Table 49: North Africa Potash Ores Market Revenue (billion) Forecast, by Application 2020 & 2033
- Table 50: South Africa Potash Ores Market Revenue (billion) Forecast, by Application 2020 & 2033
- Table 51: Rest of Middle East & Africa Potash Ores Market Revenue (billion) Forecast, by Application 2020 & 2033
- Table 52: Global Potash Ores Market Revenue billion Forecast, by Production Analysis 2020 & 2033
- Table 53: Global Potash Ores Market Revenue billion Forecast, by Consumption Analysis 2020 & 2033
- Table 54: Global Potash Ores Market Revenue billion Forecast, by Import Market Analysis (Value & Volume) 2020 & 2033
- Table 55: Global Potash Ores Market Revenue billion Forecast, by Export Market Analysis (Value & Volume) 2020 & 2033
- Table 56: Global Potash Ores Market Revenue billion Forecast, by Price Trend Analysis 2020 & 2033
- Table 57: Global Potash Ores Market Revenue billion Forecast, by Country 2020 & 2033
- Table 58: China Potash Ores Market Revenue (billion) Forecast, by Application 2020 & 2033
- Table 59: India Potash Ores Market Revenue (billion) Forecast, by Application 2020 & 2033
- Table 60: Japan Potash Ores Market Revenue (billion) Forecast, by Application 2020 & 2033
- Table 61: South Korea Potash Ores Market Revenue (billion) Forecast, by Application 2020 & 2033
- Table 62: ASEAN Potash Ores Market Revenue (billion) Forecast, by Application 2020 & 2033
- Table 63: Oceania Potash Ores Market Revenue (billion) Forecast, by Application 2020 & 2033
- Table 64: Rest of Asia Pacific Potash Ores Market Revenue (billion) Forecast, by Application 2020 & 2033
Frequently Asked Questions
1. What is the projected Compound Annual Growth Rate (CAGR) of the Potash Ores Market?
The projected CAGR is approximately 8.9%.
2. Which companies are prominent players in the Potash Ores Market?
Key companies in the market include The Mosaic Co, Coromandel International Ltd, Nutrien Limited, Sociedad Química y Minera (SQM), Petrokemija DD Fertilizer Factory, Sinofert Holdings Ltd, Eurochem, Intrepid Potash Inc, K+S AKTIENGESELLSCHAFT.
3. What are the main segments of the Potash Ores Market?
The market segments include Production Analysis, Consumption Analysis, Import Market Analysis (Value & Volume), Export Market Analysis (Value & Volume), Price Trend Analysis.
4. Can you provide details about the market size?
The market size is estimated to be USD 66.11 billion as of 2022.
5. What are some drivers contributing to market growth?
Shortage of Skilled Labor; Government Support to Enhance Farm Mechanization.
6. What are the notable trends driving market growth?
MoP is the largest segment by Product..
7. Are there any restraints impacting market growth?
Heavy Initial Procurement Cost and High Expenditure on Maintenance.
8. Can you provide examples of recent developments in the market?
March 2022: EuroChem Group announced that it has completed the purchase of the share holding control of Brazilian distributor Fertilizantes Heringer SA, with 51.48% of the shares, further strengthening its production and distribution capacity in Brazil.March 2021: Mosaic announced a partnership with Sound Agriculture to develop and distribute a nutrient efficiency product. Sound Agriculture will focus on manufacturing of the active ingredient and product formulation, while Mosaic will oversee field development, regulatory, sales and marketing efforts. The product leverage Sound Agrculture Bio-inspired chemistry that activates the soil microbiome to give plants access to important nutrients and allow growers to optimize fertilizer inputs.It is expected to release in 2023 for US market.February 2019: Nutrien Ltd. acquired Van Horn, Inc. (Van Horn), a leading US retailer and agricultural services provider which serve over 5,000 customers in 18 counties to grow their Retail business.
9. What pricing options are available for accessing the report?
Pricing options include single-user, multi-user, and enterprise licenses priced at USD 3800, USD 4500, and USD 5800 respectively.
10. Is the market size provided in terms of value or volume?
The market size is provided in terms of value, measured in billion.
11. Are there any specific market keywords associated with the report?
Yes, the market keyword associated with the report is "Potash Ores Market," which aids in identifying and referencing the specific market segment covered.
12. How do I determine which pricing option suits my needs best?
The pricing options vary based on user requirements and access needs. Individual users may opt for single-user licenses, while businesses requiring broader access may choose multi-user or enterprise licenses for cost-effective access to the report.
13. Are there any additional resources or data provided in the Potash Ores Market report?
While the report offers comprehensive insights, it's advisable to review the specific contents or supplementary materials provided to ascertain if additional resources or data are available.
14. How can I stay updated on further developments or reports in the Potash Ores Market?
To stay informed about further developments, trends, and reports in the Potash Ores Market, consider subscribing to industry newsletters, following relevant companies and organizations, or regularly checking reputable industry news sources and publications.
Methodology
Step 1 - Identification of Relevant Samples Size from Population Database


Step 2 - Approaches for Defining Global Market Size (Value, Volume* & Price*)

Note*: In applicable scenarios
Step 3 - Data Sources
Primary Research
- Web Analytics
- Survey Reports
- Research Institute
- Latest Research Reports
- Opinion Leaders
Secondary Research
- Annual Reports
- White Paper
- Latest Press Release
- Industry Association
- Paid Database
- Investor Presentations

Step 4 - Data Triangulation
Involves using different sources of information in order to increase the validity of a study
These sources are likely to be stakeholders in a program - participants, other researchers, program staff, other community members, and so on.
Then we put all data in single framework & apply various statistical tools to find out the dynamic on the market.
During the analysis stage, feedback from the stakeholder groups would be compared to determine areas of agreement as well as areas of divergence