

Key Insights
The Asia-Pacific (APAC) cashew industry presents a robust market opportunity, projected to reach a substantial size driven by rising consumer demand for healthy snacks and the increasing popularity of cashew-based products in diverse applications. The market's 4.44% Compound Annual Growth Rate (CAGR) from 2019-2024 indicates consistent expansion, a trend expected to continue through 2033. Key drivers include the growing middle class in developing APAC nations, escalating disposable incomes fueling premium food consumption, and increased awareness of cashews' nutritional benefits. This is further propelled by innovation in cashew product development, with new confectionery items, nutraceuticals, and ready-to-eat snacks leveraging cashews' versatility. The dominance of processed cashew nuts over raw cashews reflects consumer preference for convenience and ready-to-consume options. The food industry remains the largest application segment, but the nutraceutical industry showcases significant growth potential as health-conscious consumers seek natural sources of nutrients. Retail channels dominate distribution, although online sales are steadily gaining traction, mirroring broader e-commerce growth across APAC. Major players like Olam International and Sime Darby Oils are strategically positioned to capitalize on these trends, while regional associations such as the Vietnam Cashew Association play a vital role in industry standardization and promotion.
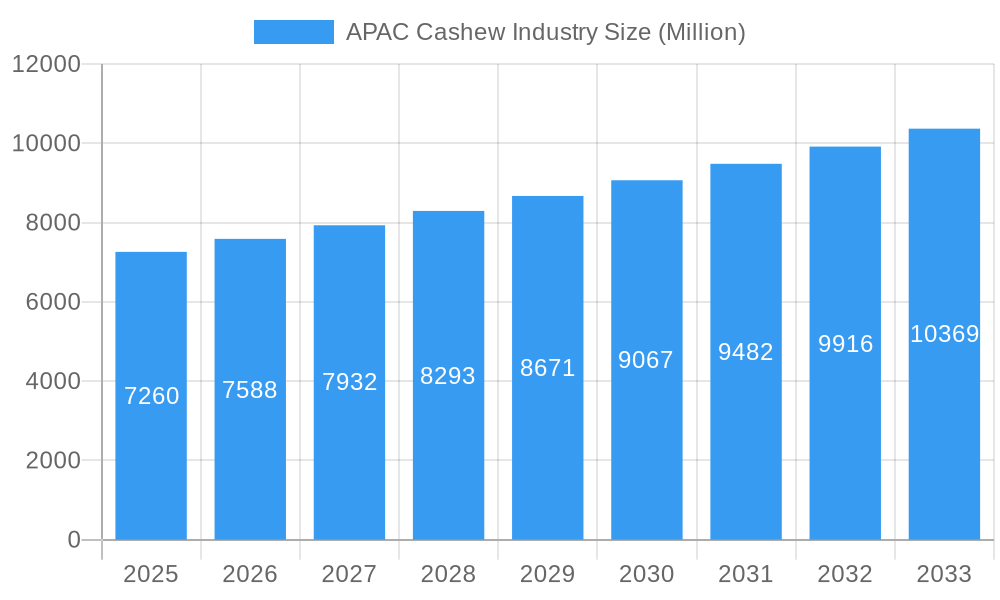
APAC Cashew Industry Market Size (In Billion)
The APAC cashew market's growth is, however, subject to certain restraints. Fluctuations in cashew prices due to factors such as weather patterns and supply chain disruptions pose challenges. Furthermore, stringent regulations regarding food safety and quality standards may affect smaller players. Competition from other nuts and snacks necessitates continuous product innovation and brand building to maintain market share. Despite these challenges, the overall outlook for the APAC cashew industry remains positive, with considerable scope for growth in diverse segments and regions within APAC. China, India, and Vietnam are expected to remain key markets, fueled by significant domestic consumption and export opportunities. Strategies focusing on sustainable sourcing, efficient processing, and targeted marketing campaigns will be crucial for success in this dynamic and expanding market.
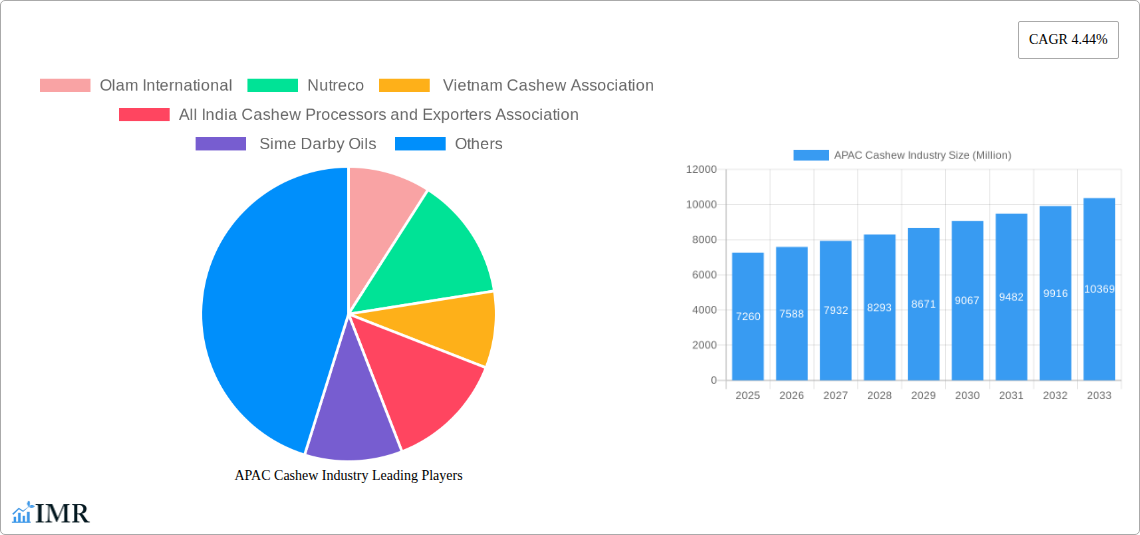
APAC Cashew Industry Company Market Share
APAC Cashew Industry: A Comprehensive Market Report (2019-2033)
This comprehensive report provides an in-depth analysis of the Asia-Pacific (APAC) cashew industry, covering market dynamics, growth trends, key players, and future outlook. With a study period spanning 2019-2033, a base year of 2025, and a forecast period of 2025-2033, this report is an essential resource for industry professionals, investors, and strategic decision-makers. The report meticulously analyzes the parent market (APAC Nuts and Seeds market) and its child market (APAC Cashew market), offering granular insights into market segmentation by type (Raw Cashew Nuts, Processed Cashew Nuts), application (Food Industry, Confectionery Industry, Nutraceutical Industry), and distribution channel (Retail, Food Service, Online).
APAC Cashew Industry Market Dynamics & Structure
The APAC cashew market is characterized by a moderately concentrated structure, with key players like Olam International, Nutreco, and Sime Darby Oils holding significant market share. Technological innovations, particularly in processing and packaging, are driving efficiency and product diversification. Regulatory frameworks governing food safety and labeling vary across countries, impacting market access and competitiveness. Substitutes like almonds and macadamia nuts exert some competitive pressure, while evolving consumer preferences for healthier snacks and functional foods are driving demand for cashews. M&A activity in the sector has been moderate, with a focus on strengthening supply chains and expanding geographical reach. The xx million USD market saw approximately xx M&A deals in the last five years, resulting in a xx% market share shift.
- Market Concentration: Moderately concentrated, with top 5 players holding xx% market share.
- Technological Innovation: Focus on automation, improved processing techniques, and sustainable packaging.
- Regulatory Landscape: Varying regulations across countries create market access challenges.
- Competitive Substitutes: Almonds, macadamia nuts, and other nuts pose some competition.
- End-User Demographics: Growing middle class and increasing health consciousness are key drivers.
- M&A Trends: Moderate activity focusing on supply chain consolidation and market expansion.
APAC Cashew Industry Growth Trends & Insights
The APAC cashew market has witnessed robust growth in recent years, driven by increasing demand from both domestic and international markets. The market size, valued at xx million units in 2024, is projected to reach xx million units by 2033, exhibiting a CAGR of xx% during the forecast period. This growth is fueled by rising disposable incomes, changing dietary habits, and the increasing popularity of cashew-based products in various applications. Technological advancements in processing and packaging have enhanced the quality and shelf life of cashew products, further boosting market growth. Consumer preference shifts towards convenient, healthy snacks are also significantly impacting adoption rates. The market penetration rate for processed cashew nuts is currently at xx%, expected to reach xx% by 2033.
Dominant Regions, Countries, or Segments in APAC Cashew Industry
India and Vietnam are currently the dominant players in the APAC cashew market, accounting for a combined xx% of the total market share. The processed cashew nut segment holds the largest market share, driven by increasing demand from the food and confectionery industries. The food industry, in particular, is a significant driver of growth, with cashews used extensively as ingredients in various food products. Online distribution channels are witnessing rapid growth, fueled by the rising popularity of e-commerce platforms.
- Key Drivers in India: Government initiatives like MIDH and RKVY to boost domestic production, coupled with a large and growing consumer base.
- Key Drivers in Vietnam: Favorable climate conditions, efficient processing infrastructure, and strategic export partnerships.
- Processed Cashews Dominance: Driven by convenience, longer shelf-life, and varied applications.
- Food Industry Application: High demand for cashew nuts as ingredients and snacks.
- Online Distribution: Rapid growth fueled by e-commerce and changing consumer behavior.
APAC Cashew Industry Product Landscape
The APAC cashew industry offers a diverse range of products, from raw cashew nuts to various processed forms like roasted, salted, and flavored cashews. Technological advancements have led to the development of innovative products with enhanced nutritional value and extended shelf life. The industry also sees a rising trend of organic and sustainably sourced cashews, appealing to health-conscious consumers. Unique selling propositions often focus on quality, taste, origin, and certifications such as organic or Fairtrade. Technological advancements include automated processing lines, advanced packaging, and quality control measures.
Key Drivers, Barriers & Challenges in APAC Cashew Industry
Key Drivers: Rising disposable incomes in APAC, increasing health consciousness, expanding food processing industry, and government support for cashew cultivation.
Challenges: Fluctuations in raw cashew prices, competition from substitute products, dependence on imports of raw materials (in some countries), and stringent regulatory compliance requirements. Supply chain disruptions caused by pandemics and geopolitical instability have also negatively impacted the industry, resulting in a xx% increase in prices in 2022.
Emerging Opportunities in APAC Cashew Industry
Growing demand for healthier snacks, the rise of nut-based beverages and other cashew derivatives, expansion into untapped markets in Southeast Asia, and the potential for strategic partnerships with food manufacturers present significant opportunities for growth in the APAC cashew industry. The development of value-added products and exploring new applications in nutraceuticals and cosmetics also hold potential.
Growth Accelerators in the APAC Cashew Industry
Technological advancements in processing, efficient supply chain management, strategic partnerships, and focused marketing efforts promoting the health benefits of cashews are accelerating growth in the industry. Government incentives and expanding retail channels also play a crucial role.
Key Players Shaping the APAC Cashew Industry Market
- Olam International
- Nutreco
- Vietnam Cashew Association
- All India Cashew Processors and Exporters Association
- Sime Darby Oils
Notable Milestones in APAC Cashew Industry Sector
- January 2023: Indian cashew processing industry revenue exceeded USD 300,000 million, a 15% year-on-year increase (CRISIL).
- July 2022: DAC&FW approved a program to expand cashew cultivation by 1.20 lakh hectares under MIDH and RKVY.
- February 2021: Bangladesh's DAE launched a project to increase cashew cultivation area through new varieties and processing mills.
In-Depth APAC Cashew Industry Market Outlook
The APAC cashew industry is poised for sustained growth, driven by favorable demographics, evolving consumer preferences, and technological advancements. Strategic investments in sustainable farming practices, innovative product development, and efficient supply chain management will be crucial for capitalizing on the market’s vast potential. The market is expected to see significant consolidation and further technological advancements, leading to increased efficiency and product diversification. The focus on health and wellness will further propel demand for cashews and cashew-derived products in the coming years.
APAC Cashew Industry Segmentation
- 1. Production Analysis
- 2. Consumption Analysis
- 3. Import Market Analysis (Value & Volume)
- 4. Export Market Analysis (Value & Volume)
- 5. Price Trend Analysis
APAC Cashew Industry Segmentation By Geography
- 1. China
- 2. Vietnam
- 3. India
- 4. Indonesia
- 5. Sri Lanka
- 6. Japan
- 7. Philippines
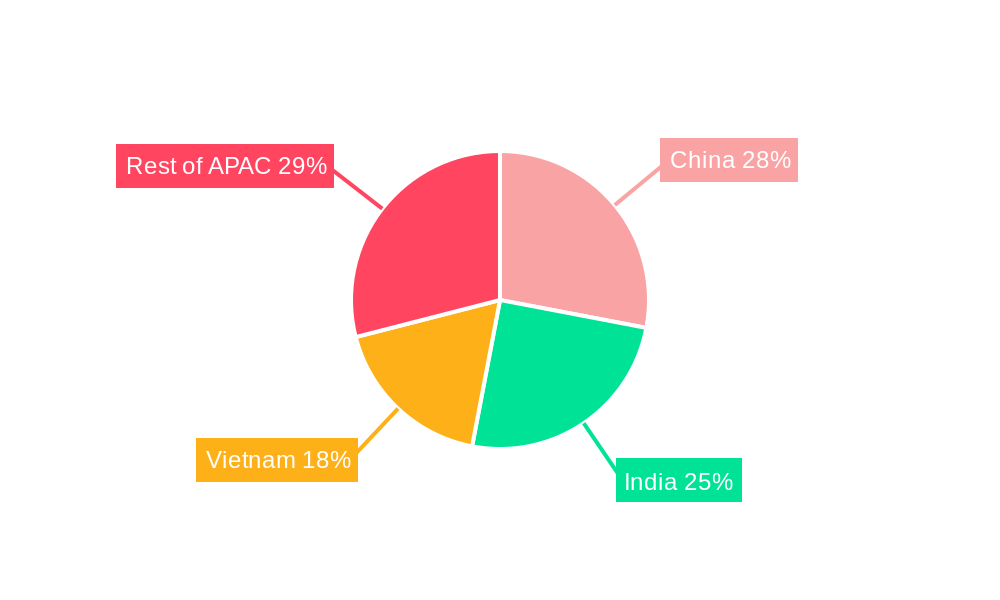
APAC Cashew Industry Regional Market Share
Geographic Coverage of APAC Cashew Industry
APAC Cashew Industry REPORT HIGHLIGHTS
| Aspects | Details |
|---|---|
| Study Period | 2020-2034 |
| Base Year | 2025 |
| Estimated Year | 2026 |
| Forecast Period | 2026-2034 |
| Historical Period | 2020-2025 |
| Growth Rate | CAGR of 4.44% from 2020-2034 |
| Segmentation |
|
Table of Contents
- 1. Introduction
- 1.1. Research Scope
- 1.2. Market Segmentation
- 1.3. Research Objective
- 1.4. Definitions and Assumptions
- 2. Executive Summary
- 2.1. Market Snapshot
- 3. Market Dynamics
- 3.1. Market Drivers
- 3.2. Market Restrains
- 3.3. Market Trends
- 3.4. Market Opportunities
- 4. Market Factor Analysis
- 4.1. Porters Five Forces
- 4.1.1. Bargaining Power of Suppliers
- 4.1.2. Bargaining Power of Buyers
- 4.1.3. Threat of New Entrants
- 4.1.4. Threat of Substitutes
- 4.1.5. Competitive Rivalry
- 4.2. PESTEL analysis
- 4.3. BCG Analysis
- 4.3.1. Stars (High Growth, High Market Share)
- 4.3.2. Cash Cows (Low Growth, High Market Share)
- 4.3.3. Question Mark (High Growth, Low Market Share)
- 4.3.4. Dogs (Low Growth, Low Market Share)
- 4.4. Ansoff Matrix Analysis
- 4.5. Supply Chain Analysis
- 4.6. Regulatory Landscape
- 4.7. Current Market Potential and Opportunity Assessment (TAM–SAM–SOM Framework)
- 4.8. IMR Analyst Note
- 4.1. Porters Five Forces
- 5. Market Analysis, Insights and Forecast 2021-2033
- 5.1. Market Analysis, Insights and Forecast - by Production Analysis
- 5.2. Market Analysis, Insights and Forecast - by Consumption Analysis
- 5.3. Market Analysis, Insights and Forecast - by Import Market Analysis (Value & Volume)
- 5.4. Market Analysis, Insights and Forecast - by Export Market Analysis (Value & Volume)
- 5.5. Market Analysis, Insights and Forecast - by Price Trend Analysis
- 5.6. Market Analysis, Insights and Forecast - by Region
- 5.6.1. China
- 5.6.2. Vietnam
- 5.6.3. India
- 5.6.4. Indonesia
- 5.6.5. Sri Lanka
- 5.6.6. Japan
- 5.6.7. Philippines
- 6. Global APAC Cashew Industry Analysis, Insights and Forecast, 2021-2033
- 6.1. Market Analysis, Insights and Forecast - by Production Analysis
- 6.2. Market Analysis, Insights and Forecast - by Consumption Analysis
- 6.3. Market Analysis, Insights and Forecast - by Import Market Analysis (Value & Volume)
- 6.4. Market Analysis, Insights and Forecast - by Export Market Analysis (Value & Volume)
- 6.5. Market Analysis, Insights and Forecast - by Price Trend Analysis
- 7. China APAC Cashew Industry Analysis, Insights and Forecast, 2020-2032
- 7.1. Market Analysis, Insights and Forecast - by Production Analysis
- 7.2. Market Analysis, Insights and Forecast - by Consumption Analysis
- 7.3. Market Analysis, Insights and Forecast - by Import Market Analysis (Value & Volume)
- 7.4. Market Analysis, Insights and Forecast - by Export Market Analysis (Value & Volume)
- 7.5. Market Analysis, Insights and Forecast - by Price Trend Analysis
- 8. Vietnam APAC Cashew Industry Analysis, Insights and Forecast, 2020-2032
- 8.1. Market Analysis, Insights and Forecast - by Production Analysis
- 8.2. Market Analysis, Insights and Forecast - by Consumption Analysis
- 8.3. Market Analysis, Insights and Forecast - by Import Market Analysis (Value & Volume)
- 8.4. Market Analysis, Insights and Forecast - by Export Market Analysis (Value & Volume)
- 8.5. Market Analysis, Insights and Forecast - by Price Trend Analysis
- 9. India APAC Cashew Industry Analysis, Insights and Forecast, 2020-2032
- 9.1. Market Analysis, Insights and Forecast - by Production Analysis
- 9.2. Market Analysis, Insights and Forecast - by Consumption Analysis
- 9.3. Market Analysis, Insights and Forecast - by Import Market Analysis (Value & Volume)
- 9.4. Market Analysis, Insights and Forecast - by Export Market Analysis (Value & Volume)
- 9.5. Market Analysis, Insights and Forecast - by Price Trend Analysis
- 10. Indonesia APAC Cashew Industry Analysis, Insights and Forecast, 2020-2032
- 10.1. Market Analysis, Insights and Forecast - by Production Analysis
- 10.2. Market Analysis, Insights and Forecast - by Consumption Analysis
- 10.3. Market Analysis, Insights and Forecast - by Import Market Analysis (Value & Volume)
- 10.4. Market Analysis, Insights and Forecast - by Export Market Analysis (Value & Volume)
- 10.5. Market Analysis, Insights and Forecast - by Price Trend Analysis
- 11. Sri Lanka APAC Cashew Industry Analysis, Insights and Forecast, 2020-2032
- 11.1. Market Analysis, Insights and Forecast - by Production Analysis
- 11.2. Market Analysis, Insights and Forecast - by Consumption Analysis
- 11.3. Market Analysis, Insights and Forecast - by Import Market Analysis (Value & Volume)
- 11.4. Market Analysis, Insights and Forecast - by Export Market Analysis (Value & Volume)
- 11.5. Market Analysis, Insights and Forecast - by Price Trend Analysis
- 12. Japan APAC Cashew Industry Analysis, Insights and Forecast, 2020-2032
- 12.1. Market Analysis, Insights and Forecast - by Production Analysis
- 12.2. Market Analysis, Insights and Forecast - by Consumption Analysis
- 12.3. Market Analysis, Insights and Forecast - by Import Market Analysis (Value & Volume)
- 12.4. Market Analysis, Insights and Forecast - by Export Market Analysis (Value & Volume)
- 12.5. Market Analysis, Insights and Forecast - by Price Trend Analysis
- 13. Philippines APAC Cashew Industry Analysis, Insights and Forecast, 2020-2032
- 13.1. Market Analysis, Insights and Forecast - by Production Analysis
- 13.2. Market Analysis, Insights and Forecast - by Consumption Analysis
- 13.3. Market Analysis, Insights and Forecast - by Import Market Analysis (Value & Volume)
- 13.4. Market Analysis, Insights and Forecast - by Export Market Analysis (Value & Volume)
- 13.5. Market Analysis, Insights and Forecast - by Price Trend Analysis
- 14. Competitive Analysis
- 14.1. Company Profiles
- 14.1.1 Olam International
- 14.1.1.1. Company Overview
- 14.1.1.2. Products
- 14.1.1.3. Company Financials
- 14.1.1.4. SWOT Analysis
- 14.1.2 Nutreco
- 14.1.2.1. Company Overview
- 14.1.2.2. Products
- 14.1.2.3. Company Financials
- 14.1.2.4. SWOT Analysis
- 14.1.3 Vietnam Cashew Association
- 14.1.3.1. Company Overview
- 14.1.3.2. Products
- 14.1.3.3. Company Financials
- 14.1.3.4. SWOT Analysis
- 14.1.4 All India Cashew Processors and Exporters Association
- 14.1.4.1. Company Overview
- 14.1.4.2. Products
- 14.1.4.3. Company Financials
- 14.1.4.4. SWOT Analysis
- 14.1.5 Sime Darby Oils
- 14.1.5.1. Company Overview
- 14.1.5.2. Products
- 14.1.5.3. Company Financials
- 14.1.5.4. SWOT Analysis
- 14.1.1 Olam International
- 14.2. Market Entropy
- 14.2.1 Company's Key Areas Served
- 14.2.2 Recent Developments
- 14.3. Company Market Share Analysis 2025
- 14.3.1 Top 5 Companies Market Share Analysis
- 14.3.2 Top 3 Companies Market Share Analysis
- 14.4. List of Potential Customers
- 15. Research Methodology
List of Figures
- Figure 1: Global APAC Cashew Industry Revenue Breakdown (Million, %) by Region 2025 & 2033
- Figure 2: Global APAC Cashew Industry Volume Breakdown (Kiloton, %) by Region 2025 & 2033
- Figure 3: China APAC Cashew Industry Revenue (Million), by Production Analysis 2025 & 2033
- Figure 4: China APAC Cashew Industry Volume (Kiloton), by Production Analysis 2025 & 2033
- Figure 5: China APAC Cashew Industry Revenue Share (%), by Production Analysis 2025 & 2033
- Figure 6: China APAC Cashew Industry Volume Share (%), by Production Analysis 2025 & 2033
- Figure 7: China APAC Cashew Industry Revenue (Million), by Consumption Analysis 2025 & 2033
- Figure 8: China APAC Cashew Industry Volume (Kiloton), by Consumption Analysis 2025 & 2033
- Figure 9: China APAC Cashew Industry Revenue Share (%), by Consumption Analysis 2025 & 2033
- Figure 10: China APAC Cashew Industry Volume Share (%), by Consumption Analysis 2025 & 2033
- Figure 11: China APAC Cashew Industry Revenue (Million), by Import Market Analysis (Value & Volume) 2025 & 2033
- Figure 12: China APAC Cashew Industry Volume (Kiloton), by Import Market Analysis (Value & Volume) 2025 & 2033
- Figure 13: China APAC Cashew Industry Revenue Share (%), by Import Market Analysis (Value & Volume) 2025 & 2033
- Figure 14: China APAC Cashew Industry Volume Share (%), by Import Market Analysis (Value & Volume) 2025 & 2033
- Figure 15: China APAC Cashew Industry Revenue (Million), by Export Market Analysis (Value & Volume) 2025 & 2033
- Figure 16: China APAC Cashew Industry Volume (Kiloton), by Export Market Analysis (Value & Volume) 2025 & 2033
- Figure 17: China APAC Cashew Industry Revenue Share (%), by Export Market Analysis (Value & Volume) 2025 & 2033
- Figure 18: China APAC Cashew Industry Volume Share (%), by Export Market Analysis (Value & Volume) 2025 & 2033
- Figure 19: China APAC Cashew Industry Revenue (Million), by Price Trend Analysis 2025 & 2033
- Figure 20: China APAC Cashew Industry Volume (Kiloton), by Price Trend Analysis 2025 & 2033
- Figure 21: China APAC Cashew Industry Revenue Share (%), by Price Trend Analysis 2025 & 2033
- Figure 22: China APAC Cashew Industry Volume Share (%), by Price Trend Analysis 2025 & 2033
- Figure 23: China APAC Cashew Industry Revenue (Million), by Country 2025 & 2033
- Figure 24: China APAC Cashew Industry Volume (Kiloton), by Country 2025 & 2033
- Figure 25: China APAC Cashew Industry Revenue Share (%), by Country 2025 & 2033
- Figure 26: China APAC Cashew Industry Volume Share (%), by Country 2025 & 2033
- Figure 27: Vietnam APAC Cashew Industry Revenue (Million), by Production Analysis 2025 & 2033
- Figure 28: Vietnam APAC Cashew Industry Volume (Kiloton), by Production Analysis 2025 & 2033
- Figure 29: Vietnam APAC Cashew Industry Revenue Share (%), by Production Analysis 2025 & 2033
- Figure 30: Vietnam APAC Cashew Industry Volume Share (%), by Production Analysis 2025 & 2033
- Figure 31: Vietnam APAC Cashew Industry Revenue (Million), by Consumption Analysis 2025 & 2033
- Figure 32: Vietnam APAC Cashew Industry Volume (Kiloton), by Consumption Analysis 2025 & 2033
- Figure 33: Vietnam APAC Cashew Industry Revenue Share (%), by Consumption Analysis 2025 & 2033
- Figure 34: Vietnam APAC Cashew Industry Volume Share (%), by Consumption Analysis 2025 & 2033
- Figure 35: Vietnam APAC Cashew Industry Revenue (Million), by Import Market Analysis (Value & Volume) 2025 & 2033
- Figure 36: Vietnam APAC Cashew Industry Volume (Kiloton), by Import Market Analysis (Value & Volume) 2025 & 2033
- Figure 37: Vietnam APAC Cashew Industry Revenue Share (%), by Import Market Analysis (Value & Volume) 2025 & 2033
- Figure 38: Vietnam APAC Cashew Industry Volume Share (%), by Import Market Analysis (Value & Volume) 2025 & 2033
- Figure 39: Vietnam APAC Cashew Industry Revenue (Million), by Export Market Analysis (Value & Volume) 2025 & 2033
- Figure 40: Vietnam APAC Cashew Industry Volume (Kiloton), by Export Market Analysis (Value & Volume) 2025 & 2033
- Figure 41: Vietnam APAC Cashew Industry Revenue Share (%), by Export Market Analysis (Value & Volume) 2025 & 2033
- Figure 42: Vietnam APAC Cashew Industry Volume Share (%), by Export Market Analysis (Value & Volume) 2025 & 2033
- Figure 43: Vietnam APAC Cashew Industry Revenue (Million), by Price Trend Analysis 2025 & 2033
- Figure 44: Vietnam APAC Cashew Industry Volume (Kiloton), by Price Trend Analysis 2025 & 2033
- Figure 45: Vietnam APAC Cashew Industry Revenue Share (%), by Price Trend Analysis 2025 & 2033
- Figure 46: Vietnam APAC Cashew Industry Volume Share (%), by Price Trend Analysis 2025 & 2033
- Figure 47: Vietnam APAC Cashew Industry Revenue (Million), by Country 2025 & 2033
- Figure 48: Vietnam APAC Cashew Industry Volume (Kiloton), by Country 2025 & 2033
- Figure 49: Vietnam APAC Cashew Industry Revenue Share (%), by Country 2025 & 2033
- Figure 50: Vietnam APAC Cashew Industry Volume Share (%), by Country 2025 & 2033
- Figure 51: India APAC Cashew Industry Revenue (Million), by Production Analysis 2025 & 2033
- Figure 52: India APAC Cashew Industry Volume (Kiloton), by Production Analysis 2025 & 2033
- Figure 53: India APAC Cashew Industry Revenue Share (%), by Production Analysis 2025 & 2033
- Figure 54: India APAC Cashew Industry Volume Share (%), by Production Analysis 2025 & 2033
- Figure 55: India APAC Cashew Industry Revenue (Million), by Consumption Analysis 2025 & 2033
- Figure 56: India APAC Cashew Industry Volume (Kiloton), by Consumption Analysis 2025 & 2033
- Figure 57: India APAC Cashew Industry Revenue Share (%), by Consumption Analysis 2025 & 2033
- Figure 58: India APAC Cashew Industry Volume Share (%), by Consumption Analysis 2025 & 2033
- Figure 59: India APAC Cashew Industry Revenue (Million), by Import Market Analysis (Value & Volume) 2025 & 2033
- Figure 60: India APAC Cashew Industry Volume (Kiloton), by Import Market Analysis (Value & Volume) 2025 & 2033
- Figure 61: India APAC Cashew Industry Revenue Share (%), by Import Market Analysis (Value & Volume) 2025 & 2033
- Figure 62: India APAC Cashew Industry Volume Share (%), by Import Market Analysis (Value & Volume) 2025 & 2033
- Figure 63: India APAC Cashew Industry Revenue (Million), by Export Market Analysis (Value & Volume) 2025 & 2033
- Figure 64: India APAC Cashew Industry Volume (Kiloton), by Export Market Analysis (Value & Volume) 2025 & 2033
- Figure 65: India APAC Cashew Industry Revenue Share (%), by Export Market Analysis (Value & Volume) 2025 & 2033
- Figure 66: India APAC Cashew Industry Volume Share (%), by Export Market Analysis (Value & Volume) 2025 & 2033
- Figure 67: India APAC Cashew Industry Revenue (Million), by Price Trend Analysis 2025 & 2033
- Figure 68: India APAC Cashew Industry Volume (Kiloton), by Price Trend Analysis 2025 & 2033
- Figure 69: India APAC Cashew Industry Revenue Share (%), by Price Trend Analysis 2025 & 2033
- Figure 70: India APAC Cashew Industry Volume Share (%), by Price Trend Analysis 2025 & 2033
- Figure 71: India APAC Cashew Industry Revenue (Million), by Country 2025 & 2033
- Figure 72: India APAC Cashew Industry Volume (Kiloton), by Country 2025 & 2033
- Figure 73: India APAC Cashew Industry Revenue Share (%), by Country 2025 & 2033
- Figure 74: India APAC Cashew Industry Volume Share (%), by Country 2025 & 2033
- Figure 75: Indonesia APAC Cashew Industry Revenue (Million), by Production Analysis 2025 & 2033
- Figure 76: Indonesia APAC Cashew Industry Volume (Kiloton), by Production Analysis 2025 & 2033
- Figure 77: Indonesia APAC Cashew Industry Revenue Share (%), by Production Analysis 2025 & 2033
- Figure 78: Indonesia APAC Cashew Industry Volume Share (%), by Production Analysis 2025 & 2033
- Figure 79: Indonesia APAC Cashew Industry Revenue (Million), by Consumption Analysis 2025 & 2033
- Figure 80: Indonesia APAC Cashew Industry Volume (Kiloton), by Consumption Analysis 2025 & 2033
- Figure 81: Indonesia APAC Cashew Industry Revenue Share (%), by Consumption Analysis 2025 & 2033
- Figure 82: Indonesia APAC Cashew Industry Volume Share (%), by Consumption Analysis 2025 & 2033
- Figure 83: Indonesia APAC Cashew Industry Revenue (Million), by Import Market Analysis (Value & Volume) 2025 & 2033
- Figure 84: Indonesia APAC Cashew Industry Volume (Kiloton), by Import Market Analysis (Value & Volume) 2025 & 2033
- Figure 85: Indonesia APAC Cashew Industry Revenue Share (%), by Import Market Analysis (Value & Volume) 2025 & 2033
- Figure 86: Indonesia APAC Cashew Industry Volume Share (%), by Import Market Analysis (Value & Volume) 2025 & 2033
- Figure 87: Indonesia APAC Cashew Industry Revenue (Million), by Export Market Analysis (Value & Volume) 2025 & 2033
- Figure 88: Indonesia APAC Cashew Industry Volume (Kiloton), by Export Market Analysis (Value & Volume) 2025 & 2033
- Figure 89: Indonesia APAC Cashew Industry Revenue Share (%), by Export Market Analysis (Value & Volume) 2025 & 2033
- Figure 90: Indonesia APAC Cashew Industry Volume Share (%), by Export Market Analysis (Value & Volume) 2025 & 2033
- Figure 91: Indonesia APAC Cashew Industry Revenue (Million), by Price Trend Analysis 2025 & 2033
- Figure 92: Indonesia APAC Cashew Industry Volume (Kiloton), by Price Trend Analysis 2025 & 2033
- Figure 93: Indonesia APAC Cashew Industry Revenue Share (%), by Price Trend Analysis 2025 & 2033
- Figure 94: Indonesia APAC Cashew Industry Volume Share (%), by Price Trend Analysis 2025 & 2033
- Figure 95: Indonesia APAC Cashew Industry Revenue (Million), by Country 2025 & 2033
- Figure 96: Indonesia APAC Cashew Industry Volume (Kiloton), by Country 2025 & 2033
- Figure 97: Indonesia APAC Cashew Industry Revenue Share (%), by Country 2025 & 2033
- Figure 98: Indonesia APAC Cashew Industry Volume Share (%), by Country 2025 & 2033
- Figure 99: Sri Lanka APAC Cashew Industry Revenue (Million), by Production Analysis 2025 & 2033
- Figure 100: Sri Lanka APAC Cashew Industry Volume (Kiloton), by Production Analysis 2025 & 2033
- Figure 101: Sri Lanka APAC Cashew Industry Revenue Share (%), by Production Analysis 2025 & 2033
- Figure 102: Sri Lanka APAC Cashew Industry Volume Share (%), by Production Analysis 2025 & 2033
- Figure 103: Sri Lanka APAC Cashew Industry Revenue (Million), by Consumption Analysis 2025 & 2033
- Figure 104: Sri Lanka APAC Cashew Industry Volume (Kiloton), by Consumption Analysis 2025 & 2033
- Figure 105: Sri Lanka APAC Cashew Industry Revenue Share (%), by Consumption Analysis 2025 & 2033
- Figure 106: Sri Lanka APAC Cashew Industry Volume Share (%), by Consumption Analysis 2025 & 2033
- Figure 107: Sri Lanka APAC Cashew Industry Revenue (Million), by Import Market Analysis (Value & Volume) 2025 & 2033
- Figure 108: Sri Lanka APAC Cashew Industry Volume (Kiloton), by Import Market Analysis (Value & Volume) 2025 & 2033
- Figure 109: Sri Lanka APAC Cashew Industry Revenue Share (%), by Import Market Analysis (Value & Volume) 2025 & 2033
- Figure 110: Sri Lanka APAC Cashew Industry Volume Share (%), by Import Market Analysis (Value & Volume) 2025 & 2033
- Figure 111: Sri Lanka APAC Cashew Industry Revenue (Million), by Export Market Analysis (Value & Volume) 2025 & 2033
- Figure 112: Sri Lanka APAC Cashew Industry Volume (Kiloton), by Export Market Analysis (Value & Volume) 2025 & 2033
- Figure 113: Sri Lanka APAC Cashew Industry Revenue Share (%), by Export Market Analysis (Value & Volume) 2025 & 2033
- Figure 114: Sri Lanka APAC Cashew Industry Volume Share (%), by Export Market Analysis (Value & Volume) 2025 & 2033
- Figure 115: Sri Lanka APAC Cashew Industry Revenue (Million), by Price Trend Analysis 2025 & 2033
- Figure 116: Sri Lanka APAC Cashew Industry Volume (Kiloton), by Price Trend Analysis 2025 & 2033
- Figure 117: Sri Lanka APAC Cashew Industry Revenue Share (%), by Price Trend Analysis 2025 & 2033
- Figure 118: Sri Lanka APAC Cashew Industry Volume Share (%), by Price Trend Analysis 2025 & 2033
- Figure 119: Sri Lanka APAC Cashew Industry Revenue (Million), by Country 2025 & 2033
- Figure 120: Sri Lanka APAC Cashew Industry Volume (Kiloton), by Country 2025 & 2033
- Figure 121: Sri Lanka APAC Cashew Industry Revenue Share (%), by Country 2025 & 2033
- Figure 122: Sri Lanka APAC Cashew Industry Volume Share (%), by Country 2025 & 2033
- Figure 123: Japan APAC Cashew Industry Revenue (Million), by Production Analysis 2025 & 2033
- Figure 124: Japan APAC Cashew Industry Volume (Kiloton), by Production Analysis 2025 & 2033
- Figure 125: Japan APAC Cashew Industry Revenue Share (%), by Production Analysis 2025 & 2033
- Figure 126: Japan APAC Cashew Industry Volume Share (%), by Production Analysis 2025 & 2033
- Figure 127: Japan APAC Cashew Industry Revenue (Million), by Consumption Analysis 2025 & 2033
- Figure 128: Japan APAC Cashew Industry Volume (Kiloton), by Consumption Analysis 2025 & 2033
- Figure 129: Japan APAC Cashew Industry Revenue Share (%), by Consumption Analysis 2025 & 2033
- Figure 130: Japan APAC Cashew Industry Volume Share (%), by Consumption Analysis 2025 & 2033
- Figure 131: Japan APAC Cashew Industry Revenue (Million), by Import Market Analysis (Value & Volume) 2025 & 2033
- Figure 132: Japan APAC Cashew Industry Volume (Kiloton), by Import Market Analysis (Value & Volume) 2025 & 2033
- Figure 133: Japan APAC Cashew Industry Revenue Share (%), by Import Market Analysis (Value & Volume) 2025 & 2033
- Figure 134: Japan APAC Cashew Industry Volume Share (%), by Import Market Analysis (Value & Volume) 2025 & 2033
- Figure 135: Japan APAC Cashew Industry Revenue (Million), by Export Market Analysis (Value & Volume) 2025 & 2033
- Figure 136: Japan APAC Cashew Industry Volume (Kiloton), by Export Market Analysis (Value & Volume) 2025 & 2033
- Figure 137: Japan APAC Cashew Industry Revenue Share (%), by Export Market Analysis (Value & Volume) 2025 & 2033
- Figure 138: Japan APAC Cashew Industry Volume Share (%), by Export Market Analysis (Value & Volume) 2025 & 2033
- Figure 139: Japan APAC Cashew Industry Revenue (Million), by Price Trend Analysis 2025 & 2033
- Figure 140: Japan APAC Cashew Industry Volume (Kiloton), by Price Trend Analysis 2025 & 2033
- Figure 141: Japan APAC Cashew Industry Revenue Share (%), by Price Trend Analysis 2025 & 2033
- Figure 142: Japan APAC Cashew Industry Volume Share (%), by Price Trend Analysis 2025 & 2033
- Figure 143: Japan APAC Cashew Industry Revenue (Million), by Country 2025 & 2033
- Figure 144: Japan APAC Cashew Industry Volume (Kiloton), by Country 2025 & 2033
- Figure 145: Japan APAC Cashew Industry Revenue Share (%), by Country 2025 & 2033
- Figure 146: Japan APAC Cashew Industry Volume Share (%), by Country 2025 & 2033
- Figure 147: Philippines APAC Cashew Industry Revenue (Million), by Production Analysis 2025 & 2033
- Figure 148: Philippines APAC Cashew Industry Volume (Kiloton), by Production Analysis 2025 & 2033
- Figure 149: Philippines APAC Cashew Industry Revenue Share (%), by Production Analysis 2025 & 2033
- Figure 150: Philippines APAC Cashew Industry Volume Share (%), by Production Analysis 2025 & 2033
- Figure 151: Philippines APAC Cashew Industry Revenue (Million), by Consumption Analysis 2025 & 2033
- Figure 152: Philippines APAC Cashew Industry Volume (Kiloton), by Consumption Analysis 2025 & 2033
- Figure 153: Philippines APAC Cashew Industry Revenue Share (%), by Consumption Analysis 2025 & 2033
- Figure 154: Philippines APAC Cashew Industry Volume Share (%), by Consumption Analysis 2025 & 2033
- Figure 155: Philippines APAC Cashew Industry Revenue (Million), by Import Market Analysis (Value & Volume) 2025 & 2033
- Figure 156: Philippines APAC Cashew Industry Volume (Kiloton), by Import Market Analysis (Value & Volume) 2025 & 2033
- Figure 157: Philippines APAC Cashew Industry Revenue Share (%), by Import Market Analysis (Value & Volume) 2025 & 2033
- Figure 158: Philippines APAC Cashew Industry Volume Share (%), by Import Market Analysis (Value & Volume) 2025 & 2033
- Figure 159: Philippines APAC Cashew Industry Revenue (Million), by Export Market Analysis (Value & Volume) 2025 & 2033
- Figure 160: Philippines APAC Cashew Industry Volume (Kiloton), by Export Market Analysis (Value & Volume) 2025 & 2033
- Figure 161: Philippines APAC Cashew Industry Revenue Share (%), by Export Market Analysis (Value & Volume) 2025 & 2033
- Figure 162: Philippines APAC Cashew Industry Volume Share (%), by Export Market Analysis (Value & Volume) 2025 & 2033
- Figure 163: Philippines APAC Cashew Industry Revenue (Million), by Price Trend Analysis 2025 & 2033
- Figure 164: Philippines APAC Cashew Industry Volume (Kiloton), by Price Trend Analysis 2025 & 2033
- Figure 165: Philippines APAC Cashew Industry Revenue Share (%), by Price Trend Analysis 2025 & 2033
- Figure 166: Philippines APAC Cashew Industry Volume Share (%), by Price Trend Analysis 2025 & 2033
- Figure 167: Philippines APAC Cashew Industry Revenue (Million), by Country 2025 & 2033
- Figure 168: Philippines APAC Cashew Industry Volume (Kiloton), by Country 2025 & 2033
- Figure 169: Philippines APAC Cashew Industry Revenue Share (%), by Country 2025 & 2033
- Figure 170: Philippines APAC Cashew Industry Volume Share (%), by Country 2025 & 2033
List of Tables
- Table 1: Global APAC Cashew Industry Revenue Million Forecast, by Production Analysis 2020 & 2033
- Table 2: Global APAC Cashew Industry Volume Kiloton Forecast, by Production Analysis 2020 & 2033
- Table 3: Global APAC Cashew Industry Revenue Million Forecast, by Consumption Analysis 2020 & 2033
- Table 4: Global APAC Cashew Industry Volume Kiloton Forecast, by Consumption Analysis 2020 & 2033
- Table 5: Global APAC Cashew Industry Revenue Million Forecast, by Import Market Analysis (Value & Volume) 2020 & 2033
- Table 6: Global APAC Cashew Industry Volume Kiloton Forecast, by Import Market Analysis (Value & Volume) 2020 & 2033
- Table 7: Global APAC Cashew Industry Revenue Million Forecast, by Export Market Analysis (Value & Volume) 2020 & 2033
- Table 8: Global APAC Cashew Industry Volume Kiloton Forecast, by Export Market Analysis (Value & Volume) 2020 & 2033
- Table 9: Global APAC Cashew Industry Revenue Million Forecast, by Price Trend Analysis 2020 & 2033
- Table 10: Global APAC Cashew Industry Volume Kiloton Forecast, by Price Trend Analysis 2020 & 2033
- Table 11: Global APAC Cashew Industry Revenue Million Forecast, by Region 2020 & 2033
- Table 12: Global APAC Cashew Industry Volume Kiloton Forecast, by Region 2020 & 2033
- Table 13: Global APAC Cashew Industry Revenue Million Forecast, by Production Analysis 2020 & 2033
- Table 14: Global APAC Cashew Industry Volume Kiloton Forecast, by Production Analysis 2020 & 2033
- Table 15: Global APAC Cashew Industry Revenue Million Forecast, by Consumption Analysis 2020 & 2033
- Table 16: Global APAC Cashew Industry Volume Kiloton Forecast, by Consumption Analysis 2020 & 2033
- Table 17: Global APAC Cashew Industry Revenue Million Forecast, by Import Market Analysis (Value & Volume) 2020 & 2033
- Table 18: Global APAC Cashew Industry Volume Kiloton Forecast, by Import Market Analysis (Value & Volume) 2020 & 2033
- Table 19: Global APAC Cashew Industry Revenue Million Forecast, by Export Market Analysis (Value & Volume) 2020 & 2033
- Table 20: Global APAC Cashew Industry Volume Kiloton Forecast, by Export Market Analysis (Value & Volume) 2020 & 2033
- Table 21: Global APAC Cashew Industry Revenue Million Forecast, by Price Trend Analysis 2020 & 2033
- Table 22: Global APAC Cashew Industry Volume Kiloton Forecast, by Price Trend Analysis 2020 & 2033
- Table 23: Global APAC Cashew Industry Revenue Million Forecast, by Country 2020 & 2033
- Table 24: Global APAC Cashew Industry Volume Kiloton Forecast, by Country 2020 & 2033
- Table 25: Global APAC Cashew Industry Revenue Million Forecast, by Production Analysis 2020 & 2033
- Table 26: Global APAC Cashew Industry Volume Kiloton Forecast, by Production Analysis 2020 & 2033
- Table 27: Global APAC Cashew Industry Revenue Million Forecast, by Consumption Analysis 2020 & 2033
- Table 28: Global APAC Cashew Industry Volume Kiloton Forecast, by Consumption Analysis 2020 & 2033
- Table 29: Global APAC Cashew Industry Revenue Million Forecast, by Import Market Analysis (Value & Volume) 2020 & 2033
- Table 30: Global APAC Cashew Industry Volume Kiloton Forecast, by Import Market Analysis (Value & Volume) 2020 & 2033
- Table 31: Global APAC Cashew Industry Revenue Million Forecast, by Export Market Analysis (Value & Volume) 2020 & 2033
- Table 32: Global APAC Cashew Industry Volume Kiloton Forecast, by Export Market Analysis (Value & Volume) 2020 & 2033
- Table 33: Global APAC Cashew Industry Revenue Million Forecast, by Price Trend Analysis 2020 & 2033
- Table 34: Global APAC Cashew Industry Volume Kiloton Forecast, by Price Trend Analysis 2020 & 2033
- Table 35: Global APAC Cashew Industry Revenue Million Forecast, by Country 2020 & 2033
- Table 36: Global APAC Cashew Industry Volume Kiloton Forecast, by Country 2020 & 2033
- Table 37: Global APAC Cashew Industry Revenue Million Forecast, by Production Analysis 2020 & 2033
- Table 38: Global APAC Cashew Industry Volume Kiloton Forecast, by Production Analysis 2020 & 2033
- Table 39: Global APAC Cashew Industry Revenue Million Forecast, by Consumption Analysis 2020 & 2033
- Table 40: Global APAC Cashew Industry Volume Kiloton Forecast, by Consumption Analysis 2020 & 2033
- Table 41: Global APAC Cashew Industry Revenue Million Forecast, by Import Market Analysis (Value & Volume) 2020 & 2033
- Table 42: Global APAC Cashew Industry Volume Kiloton Forecast, by Import Market Analysis (Value & Volume) 2020 & 2033
- Table 43: Global APAC Cashew Industry Revenue Million Forecast, by Export Market Analysis (Value & Volume) 2020 & 2033
- Table 44: Global APAC Cashew Industry Volume Kiloton Forecast, by Export Market Analysis (Value & Volume) 2020 & 2033
- Table 45: Global APAC Cashew Industry Revenue Million Forecast, by Price Trend Analysis 2020 & 2033
- Table 46: Global APAC Cashew Industry Volume Kiloton Forecast, by Price Trend Analysis 2020 & 2033
- Table 47: Global APAC Cashew Industry Revenue Million Forecast, by Country 2020 & 2033
- Table 48: Global APAC Cashew Industry Volume Kiloton Forecast, by Country 2020 & 2033
- Table 49: Global APAC Cashew Industry Revenue Million Forecast, by Production Analysis 2020 & 2033
- Table 50: Global APAC Cashew Industry Volume Kiloton Forecast, by Production Analysis 2020 & 2033
- Table 51: Global APAC Cashew Industry Revenue Million Forecast, by Consumption Analysis 2020 & 2033
- Table 52: Global APAC Cashew Industry Volume Kiloton Forecast, by Consumption Analysis 2020 & 2033
- Table 53: Global APAC Cashew Industry Revenue Million Forecast, by Import Market Analysis (Value & Volume) 2020 & 2033
- Table 54: Global APAC Cashew Industry Volume Kiloton Forecast, by Import Market Analysis (Value & Volume) 2020 & 2033
- Table 55: Global APAC Cashew Industry Revenue Million Forecast, by Export Market Analysis (Value & Volume) 2020 & 2033
- Table 56: Global APAC Cashew Industry Volume Kiloton Forecast, by Export Market Analysis (Value & Volume) 2020 & 2033
- Table 57: Global APAC Cashew Industry Revenue Million Forecast, by Price Trend Analysis 2020 & 2033
- Table 58: Global APAC Cashew Industry Volume Kiloton Forecast, by Price Trend Analysis 2020 & 2033
- Table 59: Global APAC Cashew Industry Revenue Million Forecast, by Country 2020 & 2033
- Table 60: Global APAC Cashew Industry Volume Kiloton Forecast, by Country 2020 & 2033
- Table 61: Global APAC Cashew Industry Revenue Million Forecast, by Production Analysis 2020 & 2033
- Table 62: Global APAC Cashew Industry Volume Kiloton Forecast, by Production Analysis 2020 & 2033
- Table 63: Global APAC Cashew Industry Revenue Million Forecast, by Consumption Analysis 2020 & 2033
- Table 64: Global APAC Cashew Industry Volume Kiloton Forecast, by Consumption Analysis 2020 & 2033
- Table 65: Global APAC Cashew Industry Revenue Million Forecast, by Import Market Analysis (Value & Volume) 2020 & 2033
- Table 66: Global APAC Cashew Industry Volume Kiloton Forecast, by Import Market Analysis (Value & Volume) 2020 & 2033
- Table 67: Global APAC Cashew Industry Revenue Million Forecast, by Export Market Analysis (Value & Volume) 2020 & 2033
- Table 68: Global APAC Cashew Industry Volume Kiloton Forecast, by Export Market Analysis (Value & Volume) 2020 & 2033
- Table 69: Global APAC Cashew Industry Revenue Million Forecast, by Price Trend Analysis 2020 & 2033
- Table 70: Global APAC Cashew Industry Volume Kiloton Forecast, by Price Trend Analysis 2020 & 2033
- Table 71: Global APAC Cashew Industry Revenue Million Forecast, by Country 2020 & 2033
- Table 72: Global APAC Cashew Industry Volume Kiloton Forecast, by Country 2020 & 2033
- Table 73: Global APAC Cashew Industry Revenue Million Forecast, by Production Analysis 2020 & 2033
- Table 74: Global APAC Cashew Industry Volume Kiloton Forecast, by Production Analysis 2020 & 2033
- Table 75: Global APAC Cashew Industry Revenue Million Forecast, by Consumption Analysis 2020 & 2033
- Table 76: Global APAC Cashew Industry Volume Kiloton Forecast, by Consumption Analysis 2020 & 2033
- Table 77: Global APAC Cashew Industry Revenue Million Forecast, by Import Market Analysis (Value & Volume) 2020 & 2033
- Table 78: Global APAC Cashew Industry Volume Kiloton Forecast, by Import Market Analysis (Value & Volume) 2020 & 2033
- Table 79: Global APAC Cashew Industry Revenue Million Forecast, by Export Market Analysis (Value & Volume) 2020 & 2033
- Table 80: Global APAC Cashew Industry Volume Kiloton Forecast, by Export Market Analysis (Value & Volume) 2020 & 2033
- Table 81: Global APAC Cashew Industry Revenue Million Forecast, by Price Trend Analysis 2020 & 2033
- Table 82: Global APAC Cashew Industry Volume Kiloton Forecast, by Price Trend Analysis 2020 & 2033
- Table 83: Global APAC Cashew Industry Revenue Million Forecast, by Country 2020 & 2033
- Table 84: Global APAC Cashew Industry Volume Kiloton Forecast, by Country 2020 & 2033
- Table 85: Global APAC Cashew Industry Revenue Million Forecast, by Production Analysis 2020 & 2033
- Table 86: Global APAC Cashew Industry Volume Kiloton Forecast, by Production Analysis 2020 & 2033
- Table 87: Global APAC Cashew Industry Revenue Million Forecast, by Consumption Analysis 2020 & 2033
- Table 88: Global APAC Cashew Industry Volume Kiloton Forecast, by Consumption Analysis 2020 & 2033
- Table 89: Global APAC Cashew Industry Revenue Million Forecast, by Import Market Analysis (Value & Volume) 2020 & 2033
- Table 90: Global APAC Cashew Industry Volume Kiloton Forecast, by Import Market Analysis (Value & Volume) 2020 & 2033
- Table 91: Global APAC Cashew Industry Revenue Million Forecast, by Export Market Analysis (Value & Volume) 2020 & 2033
- Table 92: Global APAC Cashew Industry Volume Kiloton Forecast, by Export Market Analysis (Value & Volume) 2020 & 2033
- Table 93: Global APAC Cashew Industry Revenue Million Forecast, by Price Trend Analysis 2020 & 2033
- Table 94: Global APAC Cashew Industry Volume Kiloton Forecast, by Price Trend Analysis 2020 & 2033
- Table 95: Global APAC Cashew Industry Revenue Million Forecast, by Country 2020 & 2033
- Table 96: Global APAC Cashew Industry Volume Kiloton Forecast, by Country 2020 & 2033
Frequently Asked Questions
1. What is the projected Compound Annual Growth Rate (CAGR) of the APAC Cashew Industry?
The projected CAGR is approximately 4.44%.
2. Which companies are prominent players in the APAC Cashew Industry?
Key companies in the market include Olam International, Nutreco, Vietnam Cashew Association , All India Cashew Processors and Exporters Association, Sime Darby Oils .
3. What are the main segments of the APAC Cashew Industry?
The market segments include Production Analysis, Consumption Analysis, Import Market Analysis (Value & Volume), Export Market Analysis (Value & Volume), Price Trend Analysis.
4. Can you provide details about the market size?
The market size is estimated to be USD 7.26 Million as of 2022.
5. What are some drivers contributing to market growth?
Rising Consumption of Cashew Nuts as a Healthy Snack; Increasing Government initiatives; Growing Cashew Nut Imports in The United States.
6. What are the notable trends driving market growth?
Increased Cashew Application in Food Industry to boost the Market.
7. Are there any restraints impacting market growth?
Hazardous Climatic Condition Hinders Cashew Production; Stringent Regulations Related To Food Quality Standards.
8. Can you provide examples of recent developments in the market?
January 2023: According to CRISIL (an Indian consulting firm offering ratings, analysis, risk, and policy advice) and a branch of S&P Global, the Indian cashew processing industry is driving demand for cashews, which extended beyond USD 300,000 million in 2022, an increase of 15% year-on-year growth in revenue.
9. What pricing options are available for accessing the report?
Pricing options include single-user, multi-user, and enterprise licenses priced at USD 4750, USD 5250, and USD 8750 respectively.
10. Is the market size provided in terms of value or volume?
The market size is provided in terms of value, measured in Million and volume, measured in Kiloton.
11. Are there any specific market keywords associated with the report?
Yes, the market keyword associated with the report is "APAC Cashew Industry," which aids in identifying and referencing the specific market segment covered.
12. How do I determine which pricing option suits my needs best?
The pricing options vary based on user requirements and access needs. Individual users may opt for single-user licenses, while businesses requiring broader access may choose multi-user or enterprise licenses for cost-effective access to the report.
13. Are there any additional resources or data provided in the APAC Cashew Industry report?
While the report offers comprehensive insights, it's advisable to review the specific contents or supplementary materials provided to ascertain if additional resources or data are available.
14. How can I stay updated on further developments or reports in the APAC Cashew Industry?
To stay informed about further developments, trends, and reports in the APAC Cashew Industry, consider subscribing to industry newsletters, following relevant companies and organizations, or regularly checking reputable industry news sources and publications.
Methodology
Step 1 - Identification of Relevant Samples Size from Population Database


Step 2 - Approaches for Defining Global Market Size (Value, Volume* & Price*)

Note*: In applicable scenarios
Step 3 - Data Sources
Primary Research
- Web Analytics
- Survey Reports
- Research Institute
- Latest Research Reports
- Opinion Leaders
Secondary Research
- Annual Reports
- White Paper
- Latest Press Release
- Industry Association
- Paid Database
- Investor Presentations

Step 4 - Data Triangulation
Involves using different sources of information in order to increase the validity of a study
These sources are likely to be stakeholders in a program - participants, other researchers, program staff, other community members, and so on.
Then we put all data in single framework & apply various statistical tools to find out the dynamic on the market.
During the analysis stage, feedback from the stakeholder groups would be compared to determine areas of agreement as well as areas of divergence