

Key Insights
The Asia-Pacific Anti-Money Laundering (AML) solutions market is poised for substantial expansion, driven by escalating financial crime, stringent regulatory compliance mandates, and the pervasive adoption of digital financial services across the region. The market, valued at $4.13 billion in 2025, is projected to achieve a Compound Annual Growth Rate (CAGR) of 17.8% through 2033. Key growth catalysts include increasing cross-border financial transactions, the sophistication of money laundering techniques, and heightened pressure on financial institutions to effectively detect and prevent illicit activities. Significant growth is observed in economies like China and India, propelled by their expanding economic footprints and burgeoning digital finance ecosystems. The market is segmented by solution type (Know Your Customer (KYC) systems, compliance reporting, transaction monitoring, auditing & reporting, and others), deployment (on-premise and cloud), and industry (healthcare, BFSI, retail, IT & telecom, and government). The cloud deployment model is rapidly gaining favor due to its inherent scalability, cost-efficiency, and robust security features. While the integration of advanced technologies such as Artificial Intelligence (AI) and machine learning is a significant trend fueling market growth, persistent challenges include data privacy concerns, integration complexities, and the critical need for skilled professionals to manage and interpret AML solutions effectively. The competitive landscape features established industry leaders like IBM, Oracle, and BAE Systems, alongside agile, specialized AML solution providers.
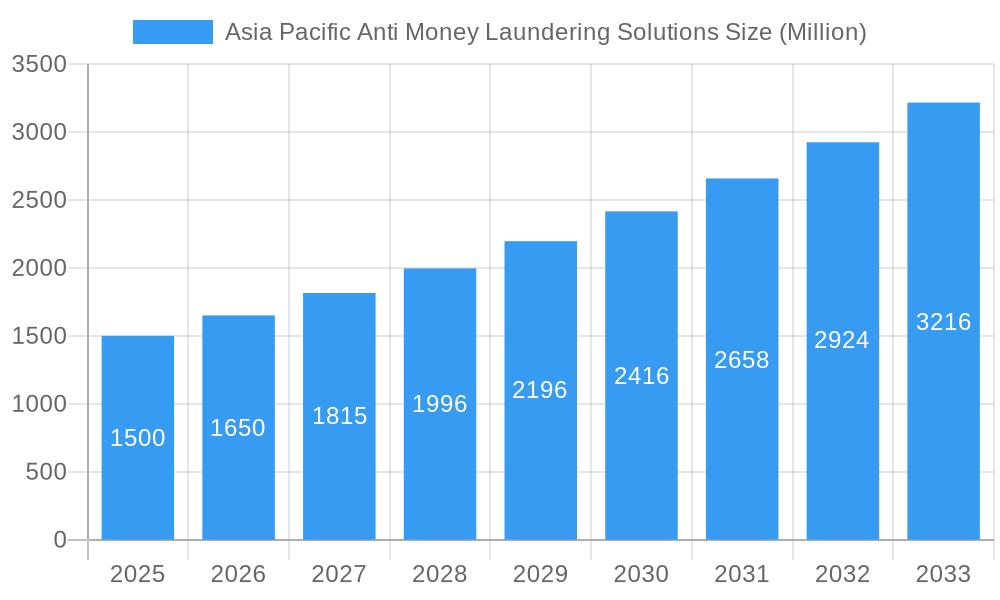
Asia Pacific Anti Money Laundering Solutions Market Size (In Billion)
The considerable growth trajectory of the Asia-Pacific AML solutions market is further underscored by heightened awareness among businesses and governments regarding the financial and reputational ramifications of money laundering. Evolving AML regulations and escalating penalties for non-compliance compel organizations to invest in comprehensive AML solutions. The region's dynamic financial sector, encompassing traditional banking and nascent fintech industries, presents a multifaceted environment of opportunities and challenges for AML solution providers. Future expansion will likely be shaped by the continuous development of advanced AML technologies, including the integration of blockchain and AI for enhanced fraud detection and prevention. Organizations are increasingly prioritizing integrated solutions that address the entire AML lifecycle, from customer onboarding and transaction monitoring to reporting and auditing. The sustained proliferation of digital finance and e-commerce within the region will further accelerate the adoption of these critical solutions.
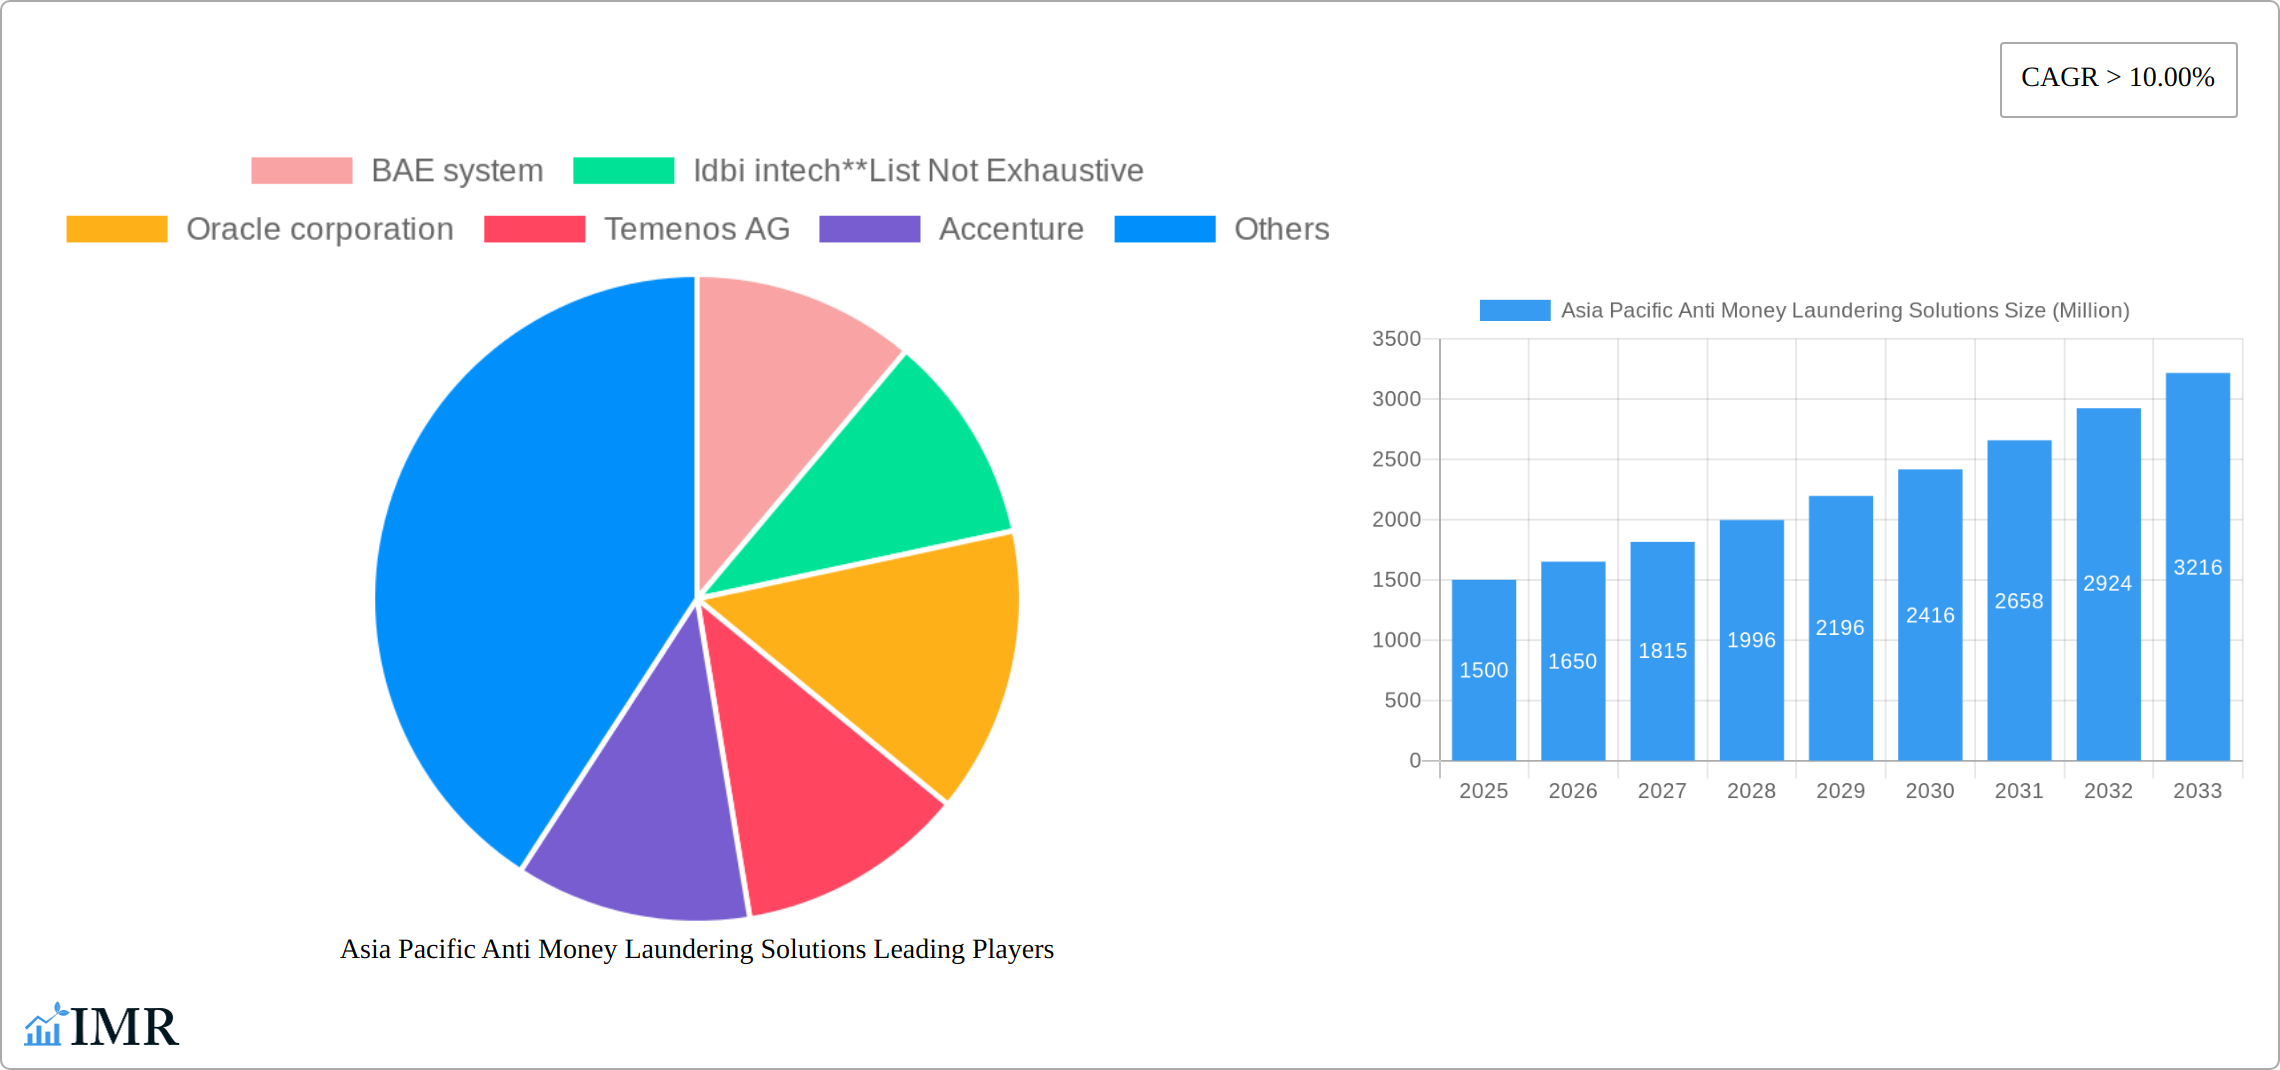
Asia Pacific Anti Money Laundering Solutions Company Market Share
This report delivers a comprehensive analysis of the Asia-Pacific Anti-Money Laundering (AML) Solutions market, detailing market size, growth trends, competitive dynamics, and future outlook. The study period spans from 2019 to 2033, with 2025 designated as the base year and a forecast period extending from 2025 to 2033. Market segmentation includes country (China, India, Australia, Japan, Singapore, South Korea, Rest of Asia-Pacific), type (Software, Services), deployment (On-premise, Cloud), solution (Know Your Customer (KYC) systems, Compliance reporting, Transaction monitoring, Auditing & reporting, Other solutions), and industry (Healthcare, BFSI, Retail, IT & Telecom, Government & Others). Key market players analyzed include BAE Systems, IDBI Intech, Oracle Corporation, Temenos AG, Accenture, Open Text Corporation, Eastnets, ACI Worldwide, IBM Corporation, SAS Institute, Fiserv, and NICE Systems. The total market size in 2025 is estimated at $4.13 billion.
Asia Pacific Anti-Money Laundering Solutions Market Dynamics & Structure
The Asia Pacific AML solutions market is characterized by a moderately concentrated landscape with several large multinational players and numerous regional vendors. Technological innovation, driven by advancements in artificial intelligence (AI), machine learning (ML), and big data analytics, is a key driver. Stringent regulatory frameworks, varying across countries, are shaping market growth, while the emergence of sophisticated financial crimes necessitates continuous innovation. The market faces competition from alternative solutions focusing on simplified compliance. M&A activity remains significant, with larger players strategically acquiring smaller, specialized firms to expand their capabilities and market reach.
- Market Concentration: Moderately concentrated, with top 5 players holding an estimated xx% market share in 2025.
- Technological Innovation: AI, ML, and big data analytics are accelerating KYC and transaction monitoring efficiency.
- Regulatory Frameworks: Compliance with regulations like the Financial Action Task Force (FATF) recommendations is a major driver.
- Competitive Substitutes: Simplified compliance solutions and cloud-based platforms pose competitive pressure.
- M&A Trends: Consolidation through acquisitions is expected to continue, driven by the need for enhanced technology and broader geographical reach. An estimated xx M&A deals occurred between 2019-2024.
- Innovation Barriers: High initial investment costs, integration complexities, and data privacy concerns can impede innovation.
Asia Pacific Anti-Money Laundering Solutions Growth Trends & Insights
The Asia Pacific AML solutions market experienced significant growth during the historical period (2019-2024), fueled by increasing regulatory scrutiny, rising cross-border transactions, and the growing sophistication of financial crimes. The market is projected to maintain a robust Compound Annual Growth Rate (CAGR) of xx% during the forecast period (2025-2033). Cloud-based solutions are gaining traction due to their scalability, cost-effectiveness, and accessibility. Consumer behavior shifts towards digital transactions are further driving the demand for advanced AML solutions. Market penetration in key segments like BFSI is increasing gradually, while adoption in other sectors like healthcare remains at an early stage.
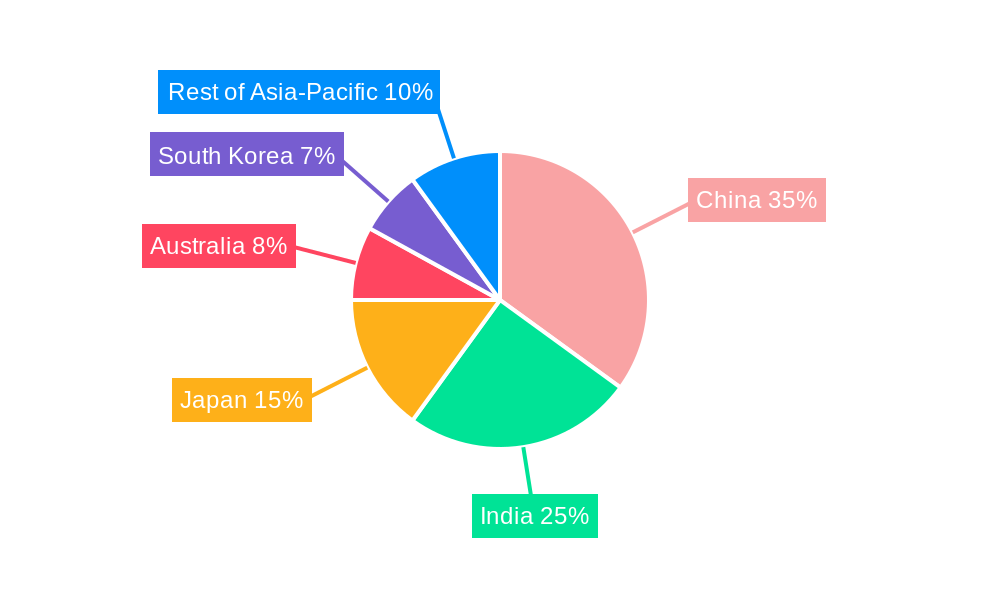
Dominant Regions, Countries, or Segments in Asia Pacific Anti-Money Laundering Solutions
China and India are the dominant markets, driven by their large economies, expanding financial sectors, and increased regulatory focus. The BFSI sector is the largest adopter of AML solutions, followed by the government sector and retail sectors. Software solutions dominate the market due to their ease of integration and flexibility. Cloud-based deployments are gaining traction, exhibiting faster growth compared to on-premise solutions. Transaction monitoring is the most significant segment, accounting for xx% of the market share in 2025.
- Key Drivers: Stringent AML regulations, increasing digital transactions, and growing instances of financial crimes.
- China: Largest market driven by robust economic growth and increasing digitalization.
- India: Second largest market driven by a growing digital economy and rising regulatory pressures.
- BFSI Sector: Highest adoption rate due to stringent regulatory requirements and the high risk of financial crimes.
- Software: Ease of integration and flexibility are driving this segment's growth.
- Transaction Monitoring: The largest segment by solution type, driven by the need to detect suspicious activities in real-time.
Asia Pacific Anti-Money Laundering Solutions Product Landscape
The AML solutions market showcases continuous innovation with products incorporating AI, ML, and blockchain technologies. These advancements enhance accuracy, speed, and efficiency in detecting and preventing financial crimes. Key features include automated alerts, real-time transaction monitoring, advanced analytics, and regulatory reporting capabilities. Unique selling propositions include advanced threat intelligence, seamless integration with existing systems, and user-friendly interfaces.
Key Drivers, Barriers & Challenges in Asia Pacific Anti-Money Laundering Solutions
Key Drivers:
- Increasing regulatory scrutiny and penalties for non-compliance.
- Growing volume of digital transactions and cross-border payments.
- Rise in sophisticated financial crimes, including money laundering and terrorist financing.
- Technological advancements in AI, ML, and big data analytics.
Challenges & Restraints:
- High initial investment costs and ongoing maintenance expenses can deter smaller organizations.
- Data privacy concerns and regulatory compliance requirements pose significant hurdles.
- Integration complexities with legacy systems and limited skilled resources can hinder adoption.
- Competitive pressures from both established players and emerging fintech companies.
Emerging Opportunities in Asia Pacific Anti-Money Laundering Solutions
- Expanding adoption of AML solutions in emerging markets within the region.
- Growth of cloud-based solutions offering greater scalability and cost-efficiency.
- Increased focus on integrating AI and ML for enhanced detection capabilities.
- Development of specialized solutions catering to specific industries and regulatory frameworks.
Growth Accelerators in the Asia Pacific Anti-Money Laundering Solutions Industry
Strategic partnerships between technology providers and financial institutions are key to accelerating market growth. Government initiatives promoting financial inclusion and digitalization will drive demand for AML solutions. The continued development and adoption of innovative technologies, like blockchain and distributed ledger technology (DLT), will further enhance security and transparency within financial transactions, fostering market expansion.
Key Players Shaping the Asia Pacific Anti-Money Laundering Solutions Market
Notable Milestones in Asia Pacific Anti-Money Laundering Solutions Sector
- 2020: Increased regulatory scrutiny following several high-profile financial crime cases.
- 2021: Launch of several AI-powered AML solutions by major vendors.
- 2022: Significant M&A activity, with several large players acquiring smaller AML solution providers.
- 2023: Growing adoption of cloud-based AML solutions.
In-Depth Asia Pacific Anti-Money Laundering Solutions Market Outlook
The Asia Pacific AML solutions market is poised for sustained growth, driven by continued technological advancements, stringent regulatory measures, and the increasing sophistication of financial crimes. Strategic partnerships and investments in innovative technologies will be crucial for market players to capitalize on the significant opportunities ahead. The market is expected to experience substantial expansion in untapped markets, with growth being particularly strong in cloud-based solutions and AI-powered transaction monitoring systems.
Asia Pacific Anti Money Laundering Solutions Segmentation
-
1. Type
- 1.1. Software
- 1.2. Services
-
2. Deployment
- 2.1. On-premise
- 2.2. cloud
-
3. Solution
- 3.1. Know your customer systems
- 3.2. Compliance reporting
- 3.3. Transaction monitoring
- 3.4. Auditing & reporting
- 3.5. Other solutions
-
4. Industry
- 4.1. Healthcare
- 4.2. BFSI
- 4.3. Retail
- 4.4. IT & telecom
- 4.5. Government & others
Asia Pacific Anti Money Laundering Solutions Segmentation By Geography
-
1. Asia Pacific
- 1.1. China
- 1.2. Japan
- 1.3. South Korea
- 1.4. India
- 1.5. Australia
- 1.6. New Zealand
- 1.7. Indonesia
- 1.8. Malaysia
- 1.9. Singapore
- 1.10. Thailand
- 1.11. Vietnam
- 1.12. Philippines
Asia Pacific Anti Money Laundering Solutions Regional Market Share
Geographic Coverage of Asia Pacific Anti Money Laundering Solutions
Asia Pacific Anti Money Laundering Solutions REPORT HIGHLIGHTS
| Aspects | Details |
|---|---|
| Study Period | 2020-2034 |
| Base Year | 2025 |
| Estimated Year | 2026 |
| Forecast Period | 2026-2034 |
| Historical Period | 2020-2025 |
| Growth Rate | CAGR of 17.8% from 2020-2034 |
| Segmentation |
|
Table of Contents
- 1. Introduction
- 1.1. Research Scope
- 1.2. Market Segmentation
- 1.3. Research Objective
- 1.4. Definitions and Assumptions
- 2. Executive Summary
- 2.1. Market Snapshot
- 3. Market Dynamics
- 3.1. Market Drivers
- 3.2. Market Restrains
- 3.3. Market Trends
- 3.4. Market Opportunities
- 4. Market Factor Analysis
- 4.1. Porters Five Forces
- 4.1.1. Bargaining Power of Suppliers
- 4.1.2. Bargaining Power of Buyers
- 4.1.3. Threat of New Entrants
- 4.1.4. Threat of Substitutes
- 4.1.5. Competitive Rivalry
- 4.2. PESTEL analysis
- 4.3. BCG Analysis
- 4.3.1. Stars (High Growth, High Market Share)
- 4.3.2. Cash Cows (Low Growth, High Market Share)
- 4.3.3. Question Mark (High Growth, Low Market Share)
- 4.3.4. Dogs (Low Growth, Low Market Share)
- 4.4. Ansoff Matrix Analysis
- 4.5. Supply Chain Analysis
- 4.6. Regulatory Landscape
- 4.7. Current Market Potential and Opportunity Assessment (TAM–SAM–SOM Framework)
- 4.8. IMR Analyst Note
- 4.1. Porters Five Forces
- 5. Market Analysis, Insights and Forecast 2021-2033
- 5.1. Market Analysis, Insights and Forecast - by Type
- 5.1.1. Software
- 5.1.2. Services
- 5.2. Market Analysis, Insights and Forecast - by Deployment
- 5.2.1. On-premise
- 5.2.2. cloud
- 5.3. Market Analysis, Insights and Forecast - by Solution
- 5.3.1. Know your customer systems
- 5.3.2. Compliance reporting
- 5.3.3. Transaction monitoring
- 5.3.4. Auditing & reporting
- 5.3.5. Other solutions
- 5.4. Market Analysis, Insights and Forecast - by Industry
- 5.4.1. Healthcare
- 5.4.2. BFSI
- 5.4.3. Retail
- 5.4.4. IT & telecom
- 5.4.5. Government & others
- 5.5. Market Analysis, Insights and Forecast - by Region
- 5.5.1. Asia Pacific
- 5.1. Market Analysis, Insights and Forecast - by Type
- 6. Asia Pacific Anti Money Laundering Solutions Analysis, Insights and Forecast, 2021-2033
- 6.1. Market Analysis, Insights and Forecast - by Type
- 6.1.1. Software
- 6.1.2. Services
- 6.2. Market Analysis, Insights and Forecast - by Deployment
- 6.2.1. On-premise
- 6.2.2. cloud
- 6.3. Market Analysis, Insights and Forecast - by Solution
- 6.3.1. Know your customer systems
- 6.3.2. Compliance reporting
- 6.3.3. Transaction monitoring
- 6.3.4. Auditing & reporting
- 6.3.5. Other solutions
- 6.4. Market Analysis, Insights and Forecast - by Industry
- 6.4.1. Healthcare
- 6.4.2. BFSI
- 6.4.3. Retail
- 6.4.4. IT & telecom
- 6.4.5. Government & others
- 6.1. Market Analysis, Insights and Forecast - by Type
- 7. Competitive Analysis
- 7.1. Company Profiles
- 7.1.1 BAE system
- 7.1.1.1. Company Overview
- 7.1.1.2. Products
- 7.1.1.3. Company Financials
- 7.1.1.4. SWOT Analysis
- 7.1.2 Idbi intech**List Not Exhaustive
- 7.1.2.1. Company Overview
- 7.1.2.2. Products
- 7.1.2.3. Company Financials
- 7.1.2.4. SWOT Analysis
- 7.1.3 Oracle corporation
- 7.1.3.1. Company Overview
- 7.1.3.2. Products
- 7.1.3.3. Company Financials
- 7.1.3.4. SWOT Analysis
- 7.1.4 Temenos AG
- 7.1.4.1. Company Overview
- 7.1.4.2. Products
- 7.1.4.3. Company Financials
- 7.1.4.4. SWOT Analysis
- 7.1.5 Accenture
- 7.1.5.1. Company Overview
- 7.1.5.2. Products
- 7.1.5.3. Company Financials
- 7.1.5.4. SWOT Analysis
- 7.1.6 Open text corporation
- 7.1.6.1. Company Overview
- 7.1.6.2. Products
- 7.1.6.3. Company Financials
- 7.1.6.4. SWOT Analysis
- 7.1.7 eastnets
- 7.1.7.1. Company Overview
- 7.1.7.2. Products
- 7.1.7.3. Company Financials
- 7.1.7.4. SWOT Analysis
- 7.1.8 ACI worldwide
- 7.1.8.1. Company Overview
- 7.1.8.2. Products
- 7.1.8.3. Company Financials
- 7.1.8.4. SWOT Analysis
- 7.1.9 IBM corporation
- 7.1.9.1. Company Overview
- 7.1.9.2. Products
- 7.1.9.3. Company Financials
- 7.1.9.4. SWOT Analysis
- 7.1.10 SAS Institute
- 7.1.10.1. Company Overview
- 7.1.10.2. Products
- 7.1.10.3. Company Financials
- 7.1.10.4. SWOT Analysis
- 7.1.11 Fiserv
- 7.1.11.1. Company Overview
- 7.1.11.2. Products
- 7.1.11.3. Company Financials
- 7.1.11.4. SWOT Analysis
- 7.1.12 NICE systems
- 7.1.12.1. Company Overview
- 7.1.12.2. Products
- 7.1.12.3. Company Financials
- 7.1.12.4. SWOT Analysis
- 7.1.1 BAE system
- 7.2. Market Entropy
- 7.2.1 Company's Key Areas Served
- 7.2.2 Recent Developments
- 7.3. Company Market Share Analysis 2025
- 7.3.1 Top 5 Companies Market Share Analysis
- 7.3.2 Top 3 Companies Market Share Analysis
- 7.4. List of Potential Customers
- 8. Research Methodology
List of Figures
- Figure 1: Asia Pacific Anti Money Laundering Solutions Revenue Breakdown (billion, %) by Product 2025 & 2033
- Figure 2: Asia Pacific Anti Money Laundering Solutions Share (%) by Company 2025
List of Tables
- Table 1: Asia Pacific Anti Money Laundering Solutions Revenue billion Forecast, by Type 2020 & 2033
- Table 2: Asia Pacific Anti Money Laundering Solutions Revenue billion Forecast, by Deployment 2020 & 2033
- Table 3: Asia Pacific Anti Money Laundering Solutions Revenue billion Forecast, by Solution 2020 & 2033
- Table 4: Asia Pacific Anti Money Laundering Solutions Revenue billion Forecast, by Industry 2020 & 2033
- Table 5: Asia Pacific Anti Money Laundering Solutions Revenue billion Forecast, by Region 2020 & 2033
- Table 6: Asia Pacific Anti Money Laundering Solutions Revenue billion Forecast, by Type 2020 & 2033
- Table 7: Asia Pacific Anti Money Laundering Solutions Revenue billion Forecast, by Deployment 2020 & 2033
- Table 8: Asia Pacific Anti Money Laundering Solutions Revenue billion Forecast, by Solution 2020 & 2033
- Table 9: Asia Pacific Anti Money Laundering Solutions Revenue billion Forecast, by Industry 2020 & 2033
- Table 10: Asia Pacific Anti Money Laundering Solutions Revenue billion Forecast, by Country 2020 & 2033
- Table 11: China Asia Pacific Anti Money Laundering Solutions Revenue (billion) Forecast, by Application 2020 & 2033
- Table 12: Japan Asia Pacific Anti Money Laundering Solutions Revenue (billion) Forecast, by Application 2020 & 2033
- Table 13: South Korea Asia Pacific Anti Money Laundering Solutions Revenue (billion) Forecast, by Application 2020 & 2033
- Table 14: India Asia Pacific Anti Money Laundering Solutions Revenue (billion) Forecast, by Application 2020 & 2033
- Table 15: Australia Asia Pacific Anti Money Laundering Solutions Revenue (billion) Forecast, by Application 2020 & 2033
- Table 16: New Zealand Asia Pacific Anti Money Laundering Solutions Revenue (billion) Forecast, by Application 2020 & 2033
- Table 17: Indonesia Asia Pacific Anti Money Laundering Solutions Revenue (billion) Forecast, by Application 2020 & 2033
- Table 18: Malaysia Asia Pacific Anti Money Laundering Solutions Revenue (billion) Forecast, by Application 2020 & 2033
- Table 19: Singapore Asia Pacific Anti Money Laundering Solutions Revenue (billion) Forecast, by Application 2020 & 2033
- Table 20: Thailand Asia Pacific Anti Money Laundering Solutions Revenue (billion) Forecast, by Application 2020 & 2033
- Table 21: Vietnam Asia Pacific Anti Money Laundering Solutions Revenue (billion) Forecast, by Application 2020 & 2033
- Table 22: Philippines Asia Pacific Anti Money Laundering Solutions Revenue (billion) Forecast, by Application 2020 & 2033
Frequently Asked Questions
1. What is the projected Compound Annual Growth Rate (CAGR) of the Asia Pacific Anti Money Laundering Solutions?
The projected CAGR is approximately 17.8%.
2. Which companies are prominent players in the Asia Pacific Anti Money Laundering Solutions?
Key companies in the market include BAE system, Idbi intech**List Not Exhaustive, Oracle corporation, Temenos AG, Accenture, Open text corporation, eastnets, ACI worldwide, IBM corporation, SAS Institute, Fiserv, NICE systems.
3. What are the main segments of the Asia Pacific Anti Money Laundering Solutions?
The market segments include Type, Deployment, Solution, Industry.
4. Can you provide details about the market size?
The market size is estimated to be USD 4.13 billion as of 2022.
5. What are some drivers contributing to market growth?
Embedded Insurance is Driving the Market.
6. What are the notable trends driving market growth?
Rise in the Volume of Wired Transactions Driving the Market.
7. Are there any restraints impacting market growth?
Inflation is Restraining the Property and Casualty Insurance Market of Singapore.
8. Can you provide examples of recent developments in the market?
N/A
9. What pricing options are available for accessing the report?
Pricing options include single-user, multi-user, and enterprise licenses priced at USD 3800, USD 4500, and USD 5800 respectively.
10. Is the market size provided in terms of value or volume?
The market size is provided in terms of value, measured in billion.
11. Are there any specific market keywords associated with the report?
Yes, the market keyword associated with the report is "Asia Pacific Anti Money Laundering Solutions," which aids in identifying and referencing the specific market segment covered.
12. How do I determine which pricing option suits my needs best?
The pricing options vary based on user requirements and access needs. Individual users may opt for single-user licenses, while businesses requiring broader access may choose multi-user or enterprise licenses for cost-effective access to the report.
13. Are there any additional resources or data provided in the Asia Pacific Anti Money Laundering Solutions report?
While the report offers comprehensive insights, it's advisable to review the specific contents or supplementary materials provided to ascertain if additional resources or data are available.
14. How can I stay updated on further developments or reports in the Asia Pacific Anti Money Laundering Solutions?
To stay informed about further developments, trends, and reports in the Asia Pacific Anti Money Laundering Solutions, consider subscribing to industry newsletters, following relevant companies and organizations, or regularly checking reputable industry news sources and publications.
Methodology
Step 1 - Identification of Relevant Samples Size from Population Database


Step 2 - Approaches for Defining Global Market Size (Value, Volume* & Price*)

Note*: In applicable scenarios
Step 3 - Data Sources
Primary Research
- Web Analytics
- Survey Reports
- Research Institute
- Latest Research Reports
- Opinion Leaders
Secondary Research
- Annual Reports
- White Paper
- Latest Press Release
- Industry Association
- Paid Database
- Investor Presentations

Step 4 - Data Triangulation
Involves using different sources of information in order to increase the validity of a study
These sources are likely to be stakeholders in a program - participants, other researchers, program staff, other community members, and so on.
Then we put all data in single framework & apply various statistical tools to find out the dynamic on the market.
During the analysis stage, feedback from the stakeholder groups would be compared to determine areas of agreement as well as areas of divergence