

Key Insights
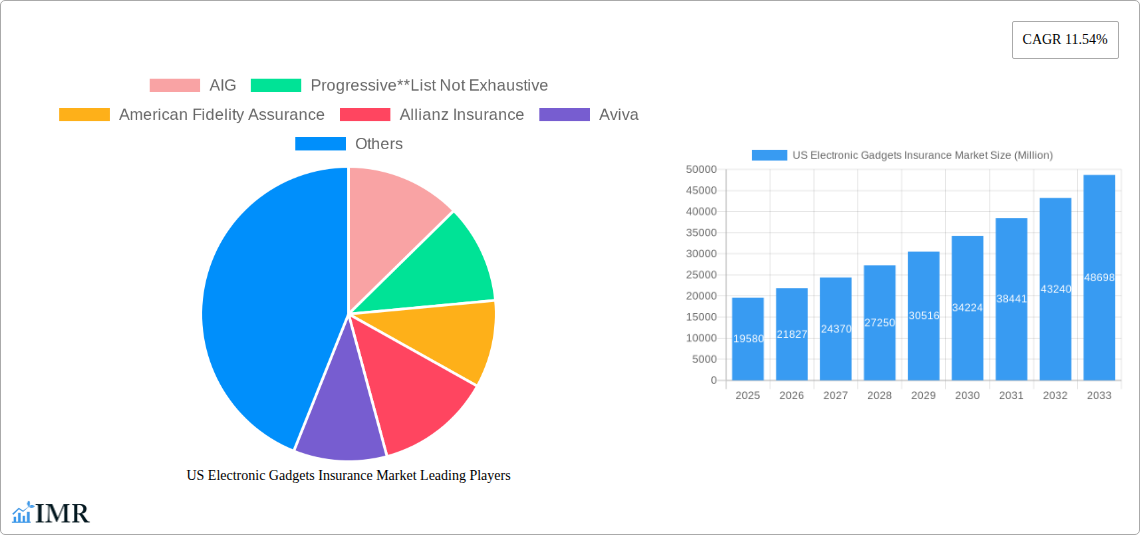
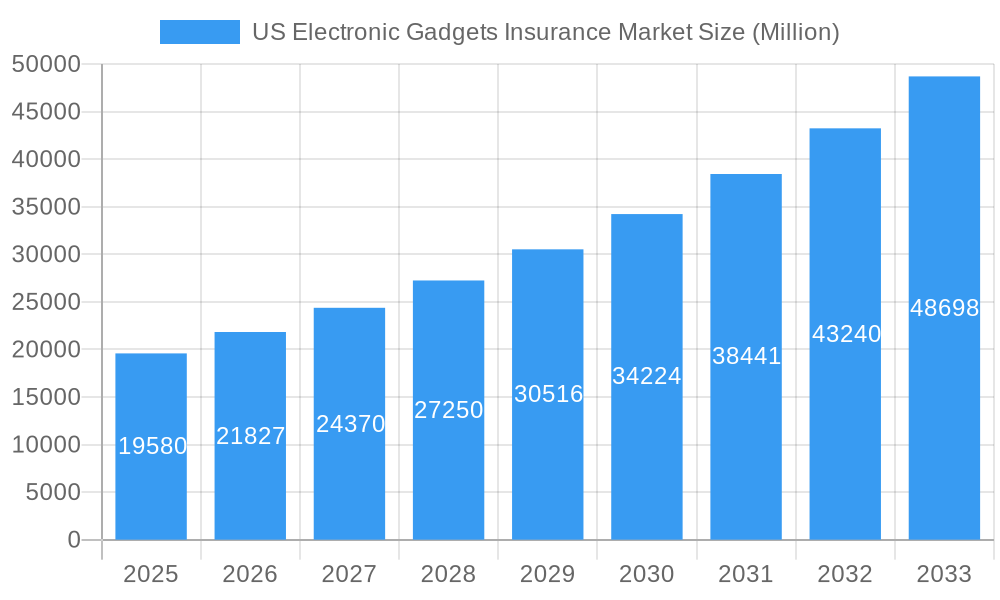
The US electronic gadgets insurance market is experiencing robust growth, projected to reach \$19.58 billion in 2025 and maintain a Compound Annual Growth Rate (CAGR) of 11.54% from 2025 to 2033. This expansion is fueled by several key factors. The increasing ownership of expensive electronic devices like smartphones, laptops, and drones, coupled with rising consumer awareness of the risks associated with accidental damage, theft, and loss, are driving demand for comprehensive insurance coverage. Furthermore, the market is segmented by coverage type (accidental damage, theft and loss), device type (laptops, computers, cameras, mobile devices, drones), and end-users (corporate, individual). The corporate segment, particularly in sectors reliant on technology, is a significant contributor to market growth, driven by the need to protect company-owned assets and ensure business continuity. The prevalence of mobile devices, particularly smartphones, as integral parts of daily life further boosts demand. Competitive players such as AIG, Progressive, Allianz, and others are shaping the market landscape through innovative product offerings and strategic partnerships. Growth is particularly notable in the mobile device and laptop insurance segments due to their high replacement costs and frequent usage. While market restraints could include the perception of insurance as an unnecessary expense or the availability of manufacturer warranties, the overall market outlook remains strongly positive.
US Electronic Gadgets Insurance Market Market Size (In Billion)
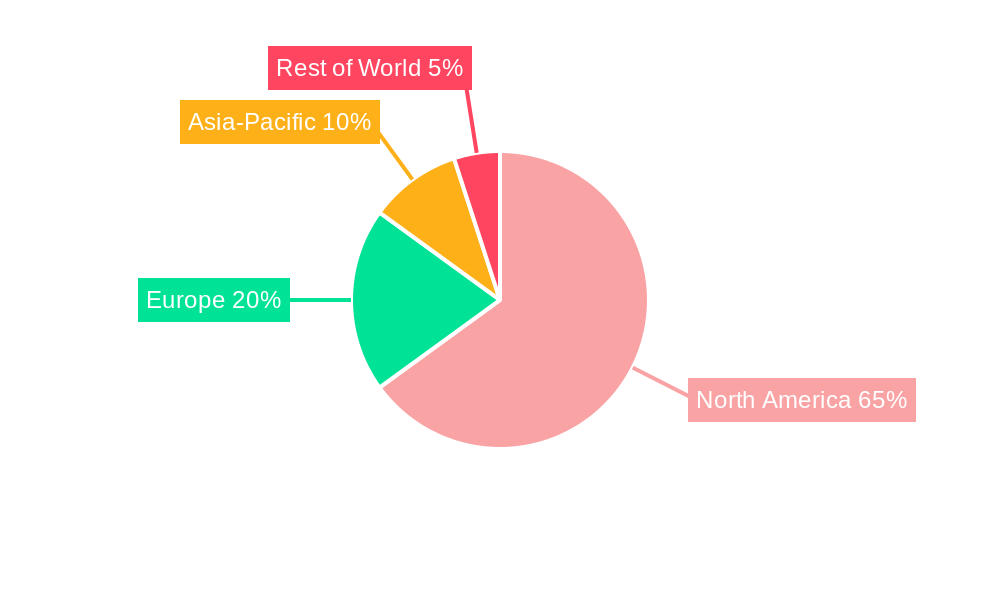
The North American region, specifically the United States, is expected to dominate the market due to high per capita income, high smartphone penetration rates, and a sophisticated insurance market. The market's expansion is further supported by increasing awareness of cybersecurity threats, leading to demand for data protection and recovery services bundled with insurance plans. The continued development and affordability of smart devices, along with increasing concerns about data breaches and the overall value of personal electronic devices, will continue to propel market growth in the coming years. The integration of insurance services within broader technology and communication packages offered by companies like AT&T further contributes to expanding reach and market penetration. The market will likely witness intensified competition, further driving innovation and affordability in electronic gadgets insurance options.
US Electronic Gadgets Insurance Market Company Market Share
US Electronic Gadgets Insurance Market: A Comprehensive Market Report (2019-2033)
This in-depth report provides a comprehensive analysis of the US Electronic Gadgets Insurance Market, covering market dynamics, growth trends, regional segmentation, product landscape, key players, and future outlook. The study period spans from 2019 to 2033, with 2025 serving as the base and estimated year. The report is essential for industry professionals, investors, and stakeholders seeking a detailed understanding of this rapidly evolving market. Market values are presented in million units.
US Electronic Gadgets Insurance Market Market Dynamics & Structure
This section analyzes the competitive landscape, technological advancements, regulatory environment, and market trends within the US Electronic Gadgets Insurance Market. We delve into market concentration, examining the market share held by key players like AIG, Progressive, American Fidelity Assurance, Allianz Insurance, Aviva, AXA, Chubb, Assurant Inc, AT&T Inc, and Amica Mutual Insurance (list not exhaustive). The analysis also explores the impact of mergers and acquisitions (M&A) activity, quantifying deal volumes and assessing their influence on market structure.
- Market Concentration: The US Electronic Gadgets Insurance market exhibits a [xx]% concentration ratio, indicating [Describe the level of concentration - highly concentrated, moderately concentrated, fragmented, etc.].
- Technological Innovation: Advancements in IoT, AI-powered claims processing, and personalized insurance packages are key innovation drivers. However, data security concerns and integration complexities present significant barriers.
- Regulatory Framework: Compliance with data privacy regulations (e.g., CCPA, GDPR implications) significantly impacts market operations. Future regulatory changes could further shape the market landscape.
- Competitive Substitutes: Extended warranties and self-insurance represent key substitutes, impacting the market penetration of dedicated insurance products.
- End-User Demographics: The market is segmented by end-users (corporate and individual), with [xx]% attributed to corporate users and [xx]% to individual users in 2024. This segment breakdown is crucial for targeted marketing strategies.
- M&A Trends: A total of [xx] M&A deals were recorded between [Start Year] and [End Year], with [xx]% focused on expanding product portfolios and [xx]% aimed at geographical expansion.
US Electronic Gadgets Insurance Market Growth Trends & Insights
This section leverages extensive market research data to analyze the market size evolution, adoption rates, and disruptive technologies impacting the US Electronic Gadgets Insurance Market. We project a Compound Annual Growth Rate (CAGR) of [xx]% during the forecast period (2025-2033), driven by increasing electronic gadget ownership and rising consumer awareness of protection needs. Market penetration is expected to reach [xx]% by 2033. The analysis considers evolving consumer behavior patterns, influencing demand for specific coverage types and device categories. The impact of technological disruptions, such as the rise of embedded insurance solutions, will be thoroughly examined.
Dominant Regions, Countries, or Segments in US Electronic Gadgets Insurance Market
This section identifies the leading regions, countries, and segments within the US Electronic Gadgets Insurance market. Analysis focuses on key drivers and dominance factors, including market share and growth potential across different coverage types (Accidental Damage, Theft and Loss), device types (Laptops, Computers, Cameras, Mobile Devices, Drones), and end-users (Corporate, Individual).
- By Coverage Type: Accidental Damage insurance holds the largest market share ([xx]%) due to [Reasons for dominance]. Theft and Loss coverage is expected to witness significant growth in the coming years.
- By Device Type: Mobile Devices dominate the market ([xx]%), followed by Laptops ([xx]%). The Drone insurance segment exhibits the highest growth potential due to the expanding drone industry and related risks.
- By End-Users: The Corporate segment holds a larger market share ([xx]%) compared to the Individual segment ([xx]%), driven by higher gadget ownership and corporate liability concerns.
- Geographic Dominance: [Specify the dominant region/state and reasons for its dominance, e.g., higher electronic gadget adoption rates, favorable regulatory landscape, presence of major players].
US Electronic Gadgets Insurance Market Product Landscape
The US Electronic Gadgets Insurance Market offers a diverse range of products catering to various customer needs and device types. Innovations include tailored insurance packages, integrated claims processing apps, and extended coverage options for specialized devices like drones. These products often leverage technological advancements like AI and IoT for improved risk assessment and claims management. Unique selling propositions include personalized coverage, seamless claims processing, and competitive pricing strategies.
Key Drivers, Barriers & Challenges in US Electronic Gadgets Insurance Market
Key Drivers:
The market is propelled by factors like increasing electronic gadget ownership, rising consumer spending power, growing awareness of device vulnerability, and the development of innovative insurance products incorporating AI and IoT. Government initiatives promoting technological adoption also contribute positively.
Challenges & Restraints:
Key challenges include high customer acquisition costs, intense competition from established insurers and warranty providers, and regulatory complexities surrounding data privacy and security. Supply chain disruptions and the risk of cyberattacks further present significant obstacles to market growth.
Emerging Opportunities in US Electronic Gadgets Insurance Market
Emerging opportunities lie in leveraging IoT and AI for real-time risk assessment and personalized pricing. Untapped markets include niche gadget segments and expanding insurance coverage to include repair and replacement services. The rise of embedded finance presents further growth potential by integrating insurance seamlessly within gadget purchase experiences.
Growth Accelerators in the US Electronic Gadgets Insurance Market Industry
Long-term growth will be driven by the adoption of innovative technologies, strategic partnerships between insurers and tech companies, and expansion into new geographic areas and customer segments. The development of customized insurance solutions for specific devices and emerging technologies will further accelerate market growth.
Key Players Shaping the US Electronic Gadgets Insurance Market Market
- AIG
- Progressive
- American Fidelity Assurance
- Allianz Insurance
- Aviva
- AXA
- Chubb
- Assurant Inc
- AT&T Inc
- Amica Mutual Insurance
Notable Milestones in US Electronic Gadgets Insurance Market Sector
- October 2023: Bolttech and Allianz Partners partnered to launch insurance solutions for embedded devices and appliances in the United States. This significantly increases access to insurance for a broader range of electronic devices.
- February 2023: Moonrock Insurance, in collaboration with Apollo Insurance, launched innovative drone insurance, covering non-standard operations (BVLOS flights, heavy lift, swarm displays, crop spraying). This expands insurance coverage to a previously underserved market segment.
In-Depth US Electronic Gadgets Insurance Market Market Outlook
The future of the US Electronic Gadgets Insurance Market appears promising, with sustained growth expected throughout the forecast period. Strategic partnerships, technological innovation, and expanding consumer demand will continue to drive market expansion. Companies that successfully adapt to evolving consumer preferences, leverage data analytics, and address emerging technological advancements will be best positioned for long-term success.
US Electronic Gadgets Insurance Market Segmentation
-
1. Coverage Type
- 1.1. Accidental Damage
- 1.2. Theft and Loss
-
2. Device Type
- 2.1. Laptops
- 2.2. Computers
- 2.3. Cameras
- 2.4. Mobile Devices
- 2.5. Drones
-
3. End Users
- 3.1. Corporate
- 3.2. Individual
US Electronic Gadgets Insurance Market Segmentation By Geography
-
1. North America
- 1.1. United States
- 1.2. Canada
- 1.3. Mexico
-
2. South America
- 2.1. Brazil
- 2.2. Argentina
- 2.3. Rest of South America
-
3. Europe
- 3.1. United Kingdom
- 3.2. Germany
- 3.3. France
- 3.4. Italy
- 3.5. Spain
- 3.6. Russia
- 3.7. Benelux
- 3.8. Nordics
- 3.9. Rest of Europe
-
4. Middle East & Africa
- 4.1. Turkey
- 4.2. Israel
- 4.3. GCC
- 4.4. North Africa
- 4.5. South Africa
- 4.6. Rest of Middle East & Africa
-
5. Asia Pacific
- 5.1. China
- 5.2. India
- 5.3. Japan
- 5.4. South Korea
- 5.5. ASEAN
- 5.6. Oceania
- 5.7. Rest of Asia Pacific
US Electronic Gadgets Insurance Market Regional Market Share
Geographic Coverage of US Electronic Gadgets Insurance Market
US Electronic Gadgets Insurance Market REPORT HIGHLIGHTS
| Aspects | Details |
|---|---|
| Study Period | 2020-2034 |
| Base Year | 2025 |
| Estimated Year | 2026 |
| Forecast Period | 2026-2034 |
| Historical Period | 2020-2025 |
| Growth Rate | CAGR of 11.54% from 2020-2034 |
| Segmentation |
|
Table of Contents
- 1. Introduction
- 1.1. Research Scope
- 1.2. Market Segmentation
- 1.3. Research Objective
- 1.4. Definitions and Assumptions
- 2. Executive Summary
- 2.1. Market Snapshot
- 3. Market Dynamics
- 3.1. Market Drivers
- 3.2. Market Restrains
- 3.3. Market Trends
- 3.4. Market Opportunities
- 4. Market Factor Analysis
- 4.1. Porters Five Forces
- 4.1.1. Bargaining Power of Suppliers
- 4.1.2. Bargaining Power of Buyers
- 4.1.3. Threat of New Entrants
- 4.1.4. Threat of Substitutes
- 4.1.5. Competitive Rivalry
- 4.2. PESTEL analysis
- 4.3. BCG Analysis
- 4.3.1. Stars (High Growth, High Market Share)
- 4.3.2. Cash Cows (Low Growth, High Market Share)
- 4.3.3. Question Mark (High Growth, Low Market Share)
- 4.3.4. Dogs (Low Growth, Low Market Share)
- 4.4. Ansoff Matrix Analysis
- 4.5. Supply Chain Analysis
- 4.6. Regulatory Landscape
- 4.7. Current Market Potential and Opportunity Assessment (TAM–SAM–SOM Framework)
- 4.8. IMR Analyst Note
- 4.1. Porters Five Forces
- 5. Market Analysis, Insights and Forecast 2021-2033
- 5.1. Market Analysis, Insights and Forecast - by Coverage Type
- 5.1.1. Accidental Damage
- 5.1.2. Theft and Loss
- 5.2. Market Analysis, Insights and Forecast - by Device Type
- 5.2.1. Laptops
- 5.2.2. Computers
- 5.2.3. Cameras
- 5.2.4. Mobile Devices
- 5.2.5. Drones
- 5.3. Market Analysis, Insights and Forecast - by End Users
- 5.3.1. Corporate
- 5.3.2. Individual
- 5.4. Market Analysis, Insights and Forecast - by Region
- 5.4.1. North America
- 5.4.2. South America
- 5.4.3. Europe
- 5.4.4. Middle East & Africa
- 5.4.5. Asia Pacific
- 5.1. Market Analysis, Insights and Forecast - by Coverage Type
- 6. Global US Electronic Gadgets Insurance Market Analysis, Insights and Forecast, 2021-2033
- 6.1. Market Analysis, Insights and Forecast - by Coverage Type
- 6.1.1. Accidental Damage
- 6.1.2. Theft and Loss
- 6.2. Market Analysis, Insights and Forecast - by Device Type
- 6.2.1. Laptops
- 6.2.2. Computers
- 6.2.3. Cameras
- 6.2.4. Mobile Devices
- 6.2.5. Drones
- 6.3. Market Analysis, Insights and Forecast - by End Users
- 6.3.1. Corporate
- 6.3.2. Individual
- 6.1. Market Analysis, Insights and Forecast - by Coverage Type
- 7. North America US Electronic Gadgets Insurance Market Analysis, Insights and Forecast, 2020-2032
- 7.1. Market Analysis, Insights and Forecast - by Coverage Type
- 7.1.1. Accidental Damage
- 7.1.2. Theft and Loss
- 7.2. Market Analysis, Insights and Forecast - by Device Type
- 7.2.1. Laptops
- 7.2.2. Computers
- 7.2.3. Cameras
- 7.2.4. Mobile Devices
- 7.2.5. Drones
- 7.3. Market Analysis, Insights and Forecast - by End Users
- 7.3.1. Corporate
- 7.3.2. Individual
- 7.1. Market Analysis, Insights and Forecast - by Coverage Type
- 8. South America US Electronic Gadgets Insurance Market Analysis, Insights and Forecast, 2020-2032
- 8.1. Market Analysis, Insights and Forecast - by Coverage Type
- 8.1.1. Accidental Damage
- 8.1.2. Theft and Loss
- 8.2. Market Analysis, Insights and Forecast - by Device Type
- 8.2.1. Laptops
- 8.2.2. Computers
- 8.2.3. Cameras
- 8.2.4. Mobile Devices
- 8.2.5. Drones
- 8.3. Market Analysis, Insights and Forecast - by End Users
- 8.3.1. Corporate
- 8.3.2. Individual
- 8.1. Market Analysis, Insights and Forecast - by Coverage Type
- 9. Europe US Electronic Gadgets Insurance Market Analysis, Insights and Forecast, 2020-2032
- 9.1. Market Analysis, Insights and Forecast - by Coverage Type
- 9.1.1. Accidental Damage
- 9.1.2. Theft and Loss
- 9.2. Market Analysis, Insights and Forecast - by Device Type
- 9.2.1. Laptops
- 9.2.2. Computers
- 9.2.3. Cameras
- 9.2.4. Mobile Devices
- 9.2.5. Drones
- 9.3. Market Analysis, Insights and Forecast - by End Users
- 9.3.1. Corporate
- 9.3.2. Individual
- 9.1. Market Analysis, Insights and Forecast - by Coverage Type
- 10. Middle East & Africa US Electronic Gadgets Insurance Market Analysis, Insights and Forecast, 2020-2032
- 10.1. Market Analysis, Insights and Forecast - by Coverage Type
- 10.1.1. Accidental Damage
- 10.1.2. Theft and Loss
- 10.2. Market Analysis, Insights and Forecast - by Device Type
- 10.2.1. Laptops
- 10.2.2. Computers
- 10.2.3. Cameras
- 10.2.4. Mobile Devices
- 10.2.5. Drones
- 10.3. Market Analysis, Insights and Forecast - by End Users
- 10.3.1. Corporate
- 10.3.2. Individual
- 10.1. Market Analysis, Insights and Forecast - by Coverage Type
- 11. Asia Pacific US Electronic Gadgets Insurance Market Analysis, Insights and Forecast, 2020-2032
- 11.1. Market Analysis, Insights and Forecast - by Coverage Type
- 11.1.1. Accidental Damage
- 11.1.2. Theft and Loss
- 11.2. Market Analysis, Insights and Forecast - by Device Type
- 11.2.1. Laptops
- 11.2.2. Computers
- 11.2.3. Cameras
- 11.2.4. Mobile Devices
- 11.2.5. Drones
- 11.3. Market Analysis, Insights and Forecast - by End Users
- 11.3.1. Corporate
- 11.3.2. Individual
- 11.1. Market Analysis, Insights and Forecast - by Coverage Type
- 12. Competitive Analysis
- 12.1. Company Profiles
- 12.1.1 AIG
- 12.1.1.1. Company Overview
- 12.1.1.2. Products
- 12.1.1.3. Company Financials
- 12.1.1.4. SWOT Analysis
- 12.1.2 Progressive**List Not Exhaustive
- 12.1.2.1. Company Overview
- 12.1.2.2. Products
- 12.1.2.3. Company Financials
- 12.1.2.4. SWOT Analysis
- 12.1.3 American Fidelity Assurance
- 12.1.3.1. Company Overview
- 12.1.3.2. Products
- 12.1.3.3. Company Financials
- 12.1.3.4. SWOT Analysis
- 12.1.4 Allianz Insurance
- 12.1.4.1. Company Overview
- 12.1.4.2. Products
- 12.1.4.3. Company Financials
- 12.1.4.4. SWOT Analysis
- 12.1.5 Aviva
- 12.1.5.1. Company Overview
- 12.1.5.2. Products
- 12.1.5.3. Company Financials
- 12.1.5.4. SWOT Analysis
- 12.1.6 AXA
- 12.1.6.1. Company Overview
- 12.1.6.2. Products
- 12.1.6.3. Company Financials
- 12.1.6.4. SWOT Analysis
- 12.1.7 Chubb
- 12.1.7.1. Company Overview
- 12.1.7.2. Products
- 12.1.7.3. Company Financials
- 12.1.7.4. SWOT Analysis
- 12.1.8 Assurant Inc
- 12.1.8.1. Company Overview
- 12.1.8.2. Products
- 12.1.8.3. Company Financials
- 12.1.8.4. SWOT Analysis
- 12.1.9 AT&T Inc
- 12.1.9.1. Company Overview
- 12.1.9.2. Products
- 12.1.9.3. Company Financials
- 12.1.9.4. SWOT Analysis
- 12.1.10 Amica Mutual Insurance
- 12.1.10.1. Company Overview
- 12.1.10.2. Products
- 12.1.10.3. Company Financials
- 12.1.10.4. SWOT Analysis
- 12.1.1 AIG
- 12.2. Market Entropy
- 12.2.1 Company's Key Areas Served
- 12.2.2 Recent Developments
- 12.3. Company Market Share Analysis 2025
- 12.3.1 Top 5 Companies Market Share Analysis
- 12.3.2 Top 3 Companies Market Share Analysis
- 12.4. List of Potential Customers
- 13. Research Methodology
List of Figures
- Figure 1: Global US Electronic Gadgets Insurance Market Revenue Breakdown (Million, %) by Region 2025 & 2033
- Figure 2: North America US Electronic Gadgets Insurance Market Revenue (Million), by Coverage Type 2025 & 2033
- Figure 3: North America US Electronic Gadgets Insurance Market Revenue Share (%), by Coverage Type 2025 & 2033
- Figure 4: North America US Electronic Gadgets Insurance Market Revenue (Million), by Device Type 2025 & 2033
- Figure 5: North America US Electronic Gadgets Insurance Market Revenue Share (%), by Device Type 2025 & 2033
- Figure 6: North America US Electronic Gadgets Insurance Market Revenue (Million), by End Users 2025 & 2033
- Figure 7: North America US Electronic Gadgets Insurance Market Revenue Share (%), by End Users 2025 & 2033
- Figure 8: North America US Electronic Gadgets Insurance Market Revenue (Million), by Country 2025 & 2033
- Figure 9: North America US Electronic Gadgets Insurance Market Revenue Share (%), by Country 2025 & 2033
- Figure 10: South America US Electronic Gadgets Insurance Market Revenue (Million), by Coverage Type 2025 & 2033
- Figure 11: South America US Electronic Gadgets Insurance Market Revenue Share (%), by Coverage Type 2025 & 2033
- Figure 12: South America US Electronic Gadgets Insurance Market Revenue (Million), by Device Type 2025 & 2033
- Figure 13: South America US Electronic Gadgets Insurance Market Revenue Share (%), by Device Type 2025 & 2033
- Figure 14: South America US Electronic Gadgets Insurance Market Revenue (Million), by End Users 2025 & 2033
- Figure 15: South America US Electronic Gadgets Insurance Market Revenue Share (%), by End Users 2025 & 2033
- Figure 16: South America US Electronic Gadgets Insurance Market Revenue (Million), by Country 2025 & 2033
- Figure 17: South America US Electronic Gadgets Insurance Market Revenue Share (%), by Country 2025 & 2033
- Figure 18: Europe US Electronic Gadgets Insurance Market Revenue (Million), by Coverage Type 2025 & 2033
- Figure 19: Europe US Electronic Gadgets Insurance Market Revenue Share (%), by Coverage Type 2025 & 2033
- Figure 20: Europe US Electronic Gadgets Insurance Market Revenue (Million), by Device Type 2025 & 2033
- Figure 21: Europe US Electronic Gadgets Insurance Market Revenue Share (%), by Device Type 2025 & 2033
- Figure 22: Europe US Electronic Gadgets Insurance Market Revenue (Million), by End Users 2025 & 2033
- Figure 23: Europe US Electronic Gadgets Insurance Market Revenue Share (%), by End Users 2025 & 2033
- Figure 24: Europe US Electronic Gadgets Insurance Market Revenue (Million), by Country 2025 & 2033
- Figure 25: Europe US Electronic Gadgets Insurance Market Revenue Share (%), by Country 2025 & 2033
- Figure 26: Middle East & Africa US Electronic Gadgets Insurance Market Revenue (Million), by Coverage Type 2025 & 2033
- Figure 27: Middle East & Africa US Electronic Gadgets Insurance Market Revenue Share (%), by Coverage Type 2025 & 2033
- Figure 28: Middle East & Africa US Electronic Gadgets Insurance Market Revenue (Million), by Device Type 2025 & 2033
- Figure 29: Middle East & Africa US Electronic Gadgets Insurance Market Revenue Share (%), by Device Type 2025 & 2033
- Figure 30: Middle East & Africa US Electronic Gadgets Insurance Market Revenue (Million), by End Users 2025 & 2033
- Figure 31: Middle East & Africa US Electronic Gadgets Insurance Market Revenue Share (%), by End Users 2025 & 2033
- Figure 32: Middle East & Africa US Electronic Gadgets Insurance Market Revenue (Million), by Country 2025 & 2033
- Figure 33: Middle East & Africa US Electronic Gadgets Insurance Market Revenue Share (%), by Country 2025 & 2033
- Figure 34: Asia Pacific US Electronic Gadgets Insurance Market Revenue (Million), by Coverage Type 2025 & 2033
- Figure 35: Asia Pacific US Electronic Gadgets Insurance Market Revenue Share (%), by Coverage Type 2025 & 2033
- Figure 36: Asia Pacific US Electronic Gadgets Insurance Market Revenue (Million), by Device Type 2025 & 2033
- Figure 37: Asia Pacific US Electronic Gadgets Insurance Market Revenue Share (%), by Device Type 2025 & 2033
- Figure 38: Asia Pacific US Electronic Gadgets Insurance Market Revenue (Million), by End Users 2025 & 2033
- Figure 39: Asia Pacific US Electronic Gadgets Insurance Market Revenue Share (%), by End Users 2025 & 2033
- Figure 40: Asia Pacific US Electronic Gadgets Insurance Market Revenue (Million), by Country 2025 & 2033
- Figure 41: Asia Pacific US Electronic Gadgets Insurance Market Revenue Share (%), by Country 2025 & 2033
List of Tables
- Table 1: Global US Electronic Gadgets Insurance Market Revenue Million Forecast, by Coverage Type 2020 & 2033
- Table 2: Global US Electronic Gadgets Insurance Market Revenue Million Forecast, by Device Type 2020 & 2033
- Table 3: Global US Electronic Gadgets Insurance Market Revenue Million Forecast, by End Users 2020 & 2033
- Table 4: Global US Electronic Gadgets Insurance Market Revenue Million Forecast, by Region 2020 & 2033
- Table 5: Global US Electronic Gadgets Insurance Market Revenue Million Forecast, by Coverage Type 2020 & 2033
- Table 6: Global US Electronic Gadgets Insurance Market Revenue Million Forecast, by Device Type 2020 & 2033
- Table 7: Global US Electronic Gadgets Insurance Market Revenue Million Forecast, by End Users 2020 & 2033
- Table 8: Global US Electronic Gadgets Insurance Market Revenue Million Forecast, by Country 2020 & 2033
- Table 9: United States US Electronic Gadgets Insurance Market Revenue (Million) Forecast, by Application 2020 & 2033
- Table 10: Canada US Electronic Gadgets Insurance Market Revenue (Million) Forecast, by Application 2020 & 2033
- Table 11: Mexico US Electronic Gadgets Insurance Market Revenue (Million) Forecast, by Application 2020 & 2033
- Table 12: Global US Electronic Gadgets Insurance Market Revenue Million Forecast, by Coverage Type 2020 & 2033
- Table 13: Global US Electronic Gadgets Insurance Market Revenue Million Forecast, by Device Type 2020 & 2033
- Table 14: Global US Electronic Gadgets Insurance Market Revenue Million Forecast, by End Users 2020 & 2033
- Table 15: Global US Electronic Gadgets Insurance Market Revenue Million Forecast, by Country 2020 & 2033
- Table 16: Brazil US Electronic Gadgets Insurance Market Revenue (Million) Forecast, by Application 2020 & 2033
- Table 17: Argentina US Electronic Gadgets Insurance Market Revenue (Million) Forecast, by Application 2020 & 2033
- Table 18: Rest of South America US Electronic Gadgets Insurance Market Revenue (Million) Forecast, by Application 2020 & 2033
- Table 19: Global US Electronic Gadgets Insurance Market Revenue Million Forecast, by Coverage Type 2020 & 2033
- Table 20: Global US Electronic Gadgets Insurance Market Revenue Million Forecast, by Device Type 2020 & 2033
- Table 21: Global US Electronic Gadgets Insurance Market Revenue Million Forecast, by End Users 2020 & 2033
- Table 22: Global US Electronic Gadgets Insurance Market Revenue Million Forecast, by Country 2020 & 2033
- Table 23: United Kingdom US Electronic Gadgets Insurance Market Revenue (Million) Forecast, by Application 2020 & 2033
- Table 24: Germany US Electronic Gadgets Insurance Market Revenue (Million) Forecast, by Application 2020 & 2033
- Table 25: France US Electronic Gadgets Insurance Market Revenue (Million) Forecast, by Application 2020 & 2033
- Table 26: Italy US Electronic Gadgets Insurance Market Revenue (Million) Forecast, by Application 2020 & 2033
- Table 27: Spain US Electronic Gadgets Insurance Market Revenue (Million) Forecast, by Application 2020 & 2033
- Table 28: Russia US Electronic Gadgets Insurance Market Revenue (Million) Forecast, by Application 2020 & 2033
- Table 29: Benelux US Electronic Gadgets Insurance Market Revenue (Million) Forecast, by Application 2020 & 2033
- Table 30: Nordics US Electronic Gadgets Insurance Market Revenue (Million) Forecast, by Application 2020 & 2033
- Table 31: Rest of Europe US Electronic Gadgets Insurance Market Revenue (Million) Forecast, by Application 2020 & 2033
- Table 32: Global US Electronic Gadgets Insurance Market Revenue Million Forecast, by Coverage Type 2020 & 2033
- Table 33: Global US Electronic Gadgets Insurance Market Revenue Million Forecast, by Device Type 2020 & 2033
- Table 34: Global US Electronic Gadgets Insurance Market Revenue Million Forecast, by End Users 2020 & 2033
- Table 35: Global US Electronic Gadgets Insurance Market Revenue Million Forecast, by Country 2020 & 2033
- Table 36: Turkey US Electronic Gadgets Insurance Market Revenue (Million) Forecast, by Application 2020 & 2033
- Table 37: Israel US Electronic Gadgets Insurance Market Revenue (Million) Forecast, by Application 2020 & 2033
- Table 38: GCC US Electronic Gadgets Insurance Market Revenue (Million) Forecast, by Application 2020 & 2033
- Table 39: North Africa US Electronic Gadgets Insurance Market Revenue (Million) Forecast, by Application 2020 & 2033
- Table 40: South Africa US Electronic Gadgets Insurance Market Revenue (Million) Forecast, by Application 2020 & 2033
- Table 41: Rest of Middle East & Africa US Electronic Gadgets Insurance Market Revenue (Million) Forecast, by Application 2020 & 2033
- Table 42: Global US Electronic Gadgets Insurance Market Revenue Million Forecast, by Coverage Type 2020 & 2033
- Table 43: Global US Electronic Gadgets Insurance Market Revenue Million Forecast, by Device Type 2020 & 2033
- Table 44: Global US Electronic Gadgets Insurance Market Revenue Million Forecast, by End Users 2020 & 2033
- Table 45: Global US Electronic Gadgets Insurance Market Revenue Million Forecast, by Country 2020 & 2033
- Table 46: China US Electronic Gadgets Insurance Market Revenue (Million) Forecast, by Application 2020 & 2033
- Table 47: India US Electronic Gadgets Insurance Market Revenue (Million) Forecast, by Application 2020 & 2033
- Table 48: Japan US Electronic Gadgets Insurance Market Revenue (Million) Forecast, by Application 2020 & 2033
- Table 49: South Korea US Electronic Gadgets Insurance Market Revenue (Million) Forecast, by Application 2020 & 2033
- Table 50: ASEAN US Electronic Gadgets Insurance Market Revenue (Million) Forecast, by Application 2020 & 2033
- Table 51: Oceania US Electronic Gadgets Insurance Market Revenue (Million) Forecast, by Application 2020 & 2033
- Table 52: Rest of Asia Pacific US Electronic Gadgets Insurance Market Revenue (Million) Forecast, by Application 2020 & 2033
Frequently Asked Questions
1. What is the projected Compound Annual Growth Rate (CAGR) of the US Electronic Gadgets Insurance Market?
The projected CAGR is approximately 11.54%.
2. Which companies are prominent players in the US Electronic Gadgets Insurance Market?
Key companies in the market include AIG, Progressive**List Not Exhaustive, American Fidelity Assurance, Allianz Insurance, Aviva, AXA, Chubb, Assurant Inc, AT&T Inc, Amica Mutual Insurance.
3. What are the main segments of the US Electronic Gadgets Insurance Market?
The market segments include Coverage Type, Device Type, End Users.
4. Can you provide details about the market size?
The market size is estimated to be USD 19.58 Million as of 2022.
5. What are some drivers contributing to market growth?
Increse in Consumer spending for Electronic gadgets.; Rising living living standard of the the people.
6. What are the notable trends driving market growth?
Increase In Demand For Electronic Gadget Post Pandemic.
7. Are there any restraints impacting market growth?
Fluctuation in price of electronic gadgets raw material.; Fragmented market in electronic gadgets insurance business.
8. Can you provide examples of recent developments in the market?
In October 2023, Bolttech and Allianz Partners partnered to launch insurance solutions for embedded devices and appliances in the United States.
9. What pricing options are available for accessing the report?
Pricing options include single-user, multi-user, and enterprise licenses priced at USD 3800, USD 4500, and USD 5800 respectively.
10. Is the market size provided in terms of value or volume?
The market size is provided in terms of value, measured in Million.
11. Are there any specific market keywords associated with the report?
Yes, the market keyword associated with the report is "US Electronic Gadgets Insurance Market," which aids in identifying and referencing the specific market segment covered.
12. How do I determine which pricing option suits my needs best?
The pricing options vary based on user requirements and access needs. Individual users may opt for single-user licenses, while businesses requiring broader access may choose multi-user or enterprise licenses for cost-effective access to the report.
13. Are there any additional resources or data provided in the US Electronic Gadgets Insurance Market report?
While the report offers comprehensive insights, it's advisable to review the specific contents or supplementary materials provided to ascertain if additional resources or data are available.
14. How can I stay updated on further developments or reports in the US Electronic Gadgets Insurance Market?
To stay informed about further developments, trends, and reports in the US Electronic Gadgets Insurance Market, consider subscribing to industry newsletters, following relevant companies and organizations, or regularly checking reputable industry news sources and publications.
Methodology
Step 1 - Identification of Relevant Samples Size from Population Database


Step 2 - Approaches for Defining Global Market Size (Value, Volume* & Price*)

Note*: In applicable scenarios
Step 3 - Data Sources
Primary Research
- Web Analytics
- Survey Reports
- Research Institute
- Latest Research Reports
- Opinion Leaders
Secondary Research
- Annual Reports
- White Paper
- Latest Press Release
- Industry Association
- Paid Database
- Investor Presentations

Step 4 - Data Triangulation
Involves using different sources of information in order to increase the validity of a study
These sources are likely to be stakeholders in a program - participants, other researchers, program staff, other community members, and so on.
Then we put all data in single framework & apply various statistical tools to find out the dynamic on the market.
During the analysis stage, feedback from the stakeholder groups would be compared to determine areas of agreement as well as areas of divergence