

Key Insights
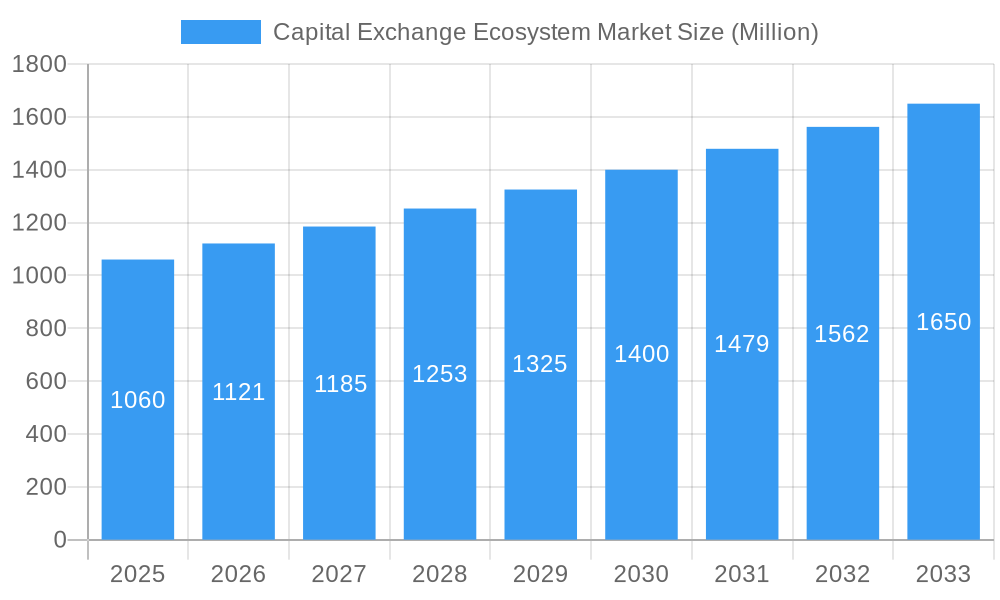
The global Capital Exchange Ecosystem Market is projected for robust expansion, currently valued at approximately USD 1.06 billion. With a Compound Annual Growth Rate (CAGR) of 5.80% anticipated between 2025 and 2033, the market is on track to reach significant valuations. This growth is primarily propelled by increasing sophistication in financial instruments, a surge in retail investor participation facilitated by digital platforms, and the ongoing globalization of capital flows. The market's complexity, encompassing primary and secondary markets, diverse stock and bond types, and a wide array of exchanges across major economic regions, underscores its fundamental role in global economic development. Technological advancements, such as blockchain and AI-driven trading, are expected to further optimize efficiency and accessibility within the ecosystem, acting as significant drivers.
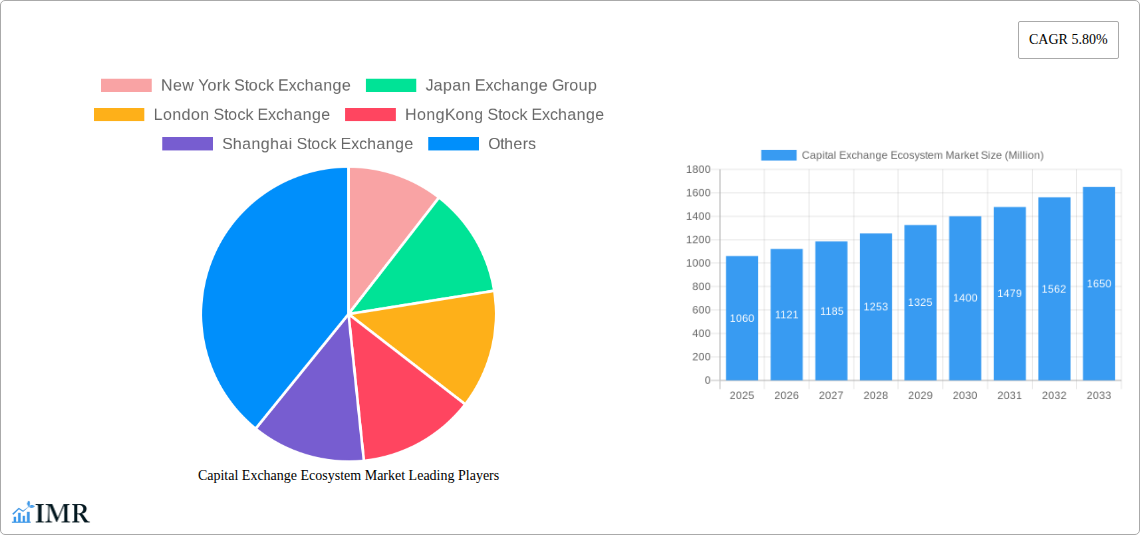
Capital Exchange Ecosystem Market Market Size (In Billion)
However, the market also faces certain constraints that could temper its growth trajectory. These include evolving regulatory landscapes across different jurisdictions, which can introduce compliance complexities and costs for market participants. Geopolitical uncertainties and macroeconomic volatility can also lead to increased market risk and investor caution, potentially impacting trading volumes and investment flows. Furthermore, cybersecurity threats pose an ever-present concern, necessitating continuous investment in robust security infrastructure. Despite these challenges, the inherent demand for capital formation and investment opportunities, coupled with innovative solutions designed to address market inefficiencies, positions the Capital Exchange Ecosystem Market for sustained and dynamic growth throughout the forecast period. The strategic importance of key exchanges like the New York Stock Exchange, Japan Exchange Group, and London Stock Exchange in facilitating these capital movements remains paramount.
Capital Exchange Ecosystem Market Company Market Share
Capital Exchange Ecosystem Market Report: Navigating Global Financial Landscapes (2019–2033)
This comprehensive report provides an in-depth analysis of the Capital Exchange Ecosystem Market, covering its dynamic structure, growth trajectories, regional dominance, product innovations, key drivers, emerging opportunities, and the pivotal players shaping its future. With a forecast period extending from 2025 to 2033, this report utilizes a base year of 2025 and draws insights from the historical period of 2019–2024. This detailed market research is essential for financial institutions, investors, policymakers, and technology providers seeking to understand and capitalize on the evolving global financial exchange landscape.
Capital Exchange Ecosystem Market Dynamics & Structure
The Capital Exchange Ecosystem Market is characterized by a complex interplay of market concentration, technological innovation, regulatory frameworks, and competitive dynamics. Dominant exchanges such as the New York Stock Exchange, Japan Exchange Group, London Stock Exchange, Hong Kong Stock Exchange, Shanghai Stock Exchange, National Stock Exchange, Euronext, NASDAQ, Bombay Stock Exchange, and Saudi Stock Exchange exert significant influence, managing a substantial portion of global trading volumes. Market concentration is evident in the continuous consolidation and strategic alliances aimed at expanding global reach and operational efficiency. Technological innovation remains a key driver, with advancements in AI, blockchain, and cloud computing revolutionizing trading platforms, clearing, and settlement processes, enhancing speed, security, and accessibility.
- Market Concentration: A few major global exchanges hold a significant market share, influencing pricing and listing standards.
- Technological Innovation: High-frequency trading, algorithmic trading, and the integration of AI are transforming market operations.
- Regulatory Frameworks: Evolving regulations, particularly concerning data privacy, cybersecurity, and investor protection, shape market operations and innovation.
- Competitive Product Substitutes: Over-the-counter (OTC) markets and decentralized finance (DeFi) platforms present growing competition to traditional exchanges.
- End-User Demographics: An increasing participation of retail investors, alongside institutional investors, is driving demand for user-friendly platforms and diverse investment products.
- M&A Trends: Strategic mergers and acquisitions are common as exchanges seek to broaden their product offerings and geographic footprints. For instance, the reported M&A deal volume in the capital markets sector reached an estimated $500 million in 2024.
Capital Exchange Ecosystem Market Growth Trends & Insights
The Capital Exchange Ecosystem Market is poised for substantial growth, driven by increasing globalization, technological advancements, and a burgeoning investor base. The market size is projected to expand significantly, with a Compound Annual Growth Rate (CAGR) of approximately 7.5% predicted over the forecast period. This growth is underpinned by rising adoption rates of digital trading platforms and a paradigm shift in consumer behavior towards more accessible and diversified investment options. Technological disruptions, including the integration of AI for market surveillance, predictive analytics, and automated trading strategies, are not only enhancing efficiency but also creating new avenues for revenue generation.
Furthermore, the increasing participation of retail investors, especially in emerging economies, is a significant trend. This surge in interest is fueled by greater financial literacy, wider availability of online brokerage services, and a desire for wealth creation. The shift in consumer behavior is also evident in the growing demand for Exchange Traded Funds (ETFs) and other passive investment products, offering diversification and lower management fees. The market penetration of digital investment tools has seen a considerable increase, reaching an estimated 40% in developed economies and showing rapid growth in developing regions.
The integration of blockchain technology, while still in its nascent stages for some applications, holds immense potential for streamlining post-trade processes, reducing settlement times, and enhancing transparency. This technological disruption is expected to lower operational costs and create more efficient capital markets. The growing emphasis on Environmental, Social, and Governance (ESG) investing is also influencing market trends, with an increasing number of listings and products catering to sustainable investment preferences.
The evolution of trading algorithms and the increasing sophistication of market data analytics are further accelerating growth. These advancements enable market participants to make more informed decisions and respond more rapidly to market fluctuations. The accessibility provided by mobile trading applications has democratized access to financial markets, attracting a younger demographic and contributing to the overall expansion of the investor base. This sustained growth trajectory is indicative of a dynamic market that is continuously adapting to technological advancements and evolving investor needs.
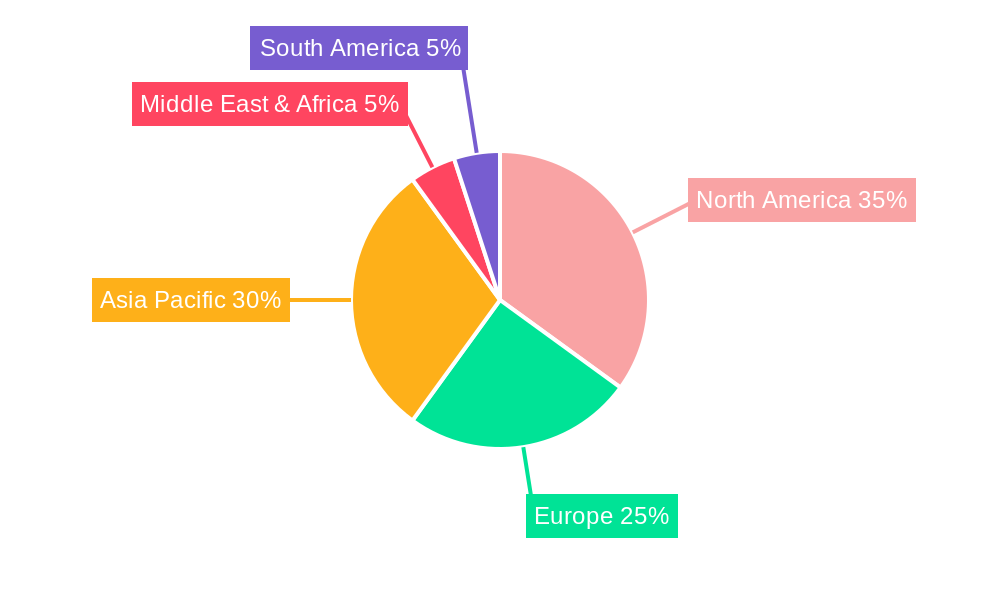
Dominant Regions, Countries, or Segments in Capital Exchange Ecosystem Market
The Capital Market: Stocks segment, particularly within the Primary and Secondary market composition, stands out as a dominant force driving growth within the Capital Exchange Ecosystem Market. This dominance is intrinsically linked to the fundamental role of stock exchanges in facilitating capital formation and liquidity for corporations worldwide. Regions with robust economies, established legal frameworks, and a strong culture of investment are at the forefront.
North America, led by the United States, continues to be a powerhouse, with the New York Stock Exchange and NASDAQ setting global benchmarks for trading volumes, listings, and technological innovation. The sheer depth of the U.S. equity market, characterized by a vast array of Common Stock and Preferred Stock offerings, including a significant proportion of Growth Stock and Value Stock, attracts substantial domestic and international capital. The presence of well-regulated financial institutions and sophisticated investor demographics further solidifies its leadership.
Asia-Pacific, spearheaded by the Hong Kong Stock Exchange and Shanghai Stock Exchange, is experiencing rapid expansion. The burgeoning economies, increasing disposable incomes, and a growing middle class are fueling a surge in both retail and institutional investment in equities. China's commitment to opening its capital markets and the ongoing development of its financial infrastructure are key drivers. Japan Exchange Group, despite mature market conditions, remains a crucial player with a diverse range of listed companies.
Europe, represented by Euronext and the London Stock Exchange, maintains a significant presence, benefiting from deep liquidity, established financial expertise, and a focus on diversified equity offerings. The increasing emphasis on sustainable investments, with a growing demand for Defensive Stock and ESG-compliant companies, also contributes to the segment's resilience.
The bond market, encompassing Government Bonds, Corporate Bonds, Municipal Bonds, and Mortgage-Backed Securities, forms a critical counterpart to equities, providing essential funding avenues and investment diversification. While stock markets often garner more public attention, the sheer volume and foundational nature of bond trading contribute significantly to the overall ecosystem. The growth in fixed-income markets is closely tied to macroeconomic factors, interest rate policies, and the demand for stable, income-generating assets. The increasing issuance of corporate bonds by companies seeking alternative financing to equity, and government bonds for fiscal management, underscores their enduring importance.
Capital Exchange Ecosystem Market Product Landscape
The Capital Exchange Ecosystem Market is witnessing a wave of product innovation aimed at enhancing trading efficiency, expanding investment opportunities, and catering to diverse investor needs. Advanced trading platforms now incorporate AI-driven analytics for predictive insights and automated trading strategies, offering unparalleled speed and precision. The proliferation of Exchange Traded Funds (ETFs) has diversified investment options, providing access to specific asset classes, sectors, and even thematic investments like ESG-focused portfolios. Blockchain technology is being explored and implemented for streamlining settlement processes, reducing counterparty risk, and improving transparency in trade lifecycle management. New listing avenues, such as Special Purpose Acquisition Companies (SPACs) and direct listings, offer alternative routes for companies to access public markets.
Key Drivers, Barriers & Challenges in Capital Exchange Ecosystem Market
Key Drivers:
- Technological Advancements: High-frequency trading, AI-powered analytics, and blockchain integration are enhancing efficiency and creating new trading paradigms.
- Globalization and Emerging Markets: Increased cross-border investment flows and the rise of new investor bases in developing economies are significant growth catalysts.
- Regulatory Support: Favorable regulatory environments that encourage innovation and investor participation bolster market expansion.
- Increased Retail Investor Participation: Democratized access to trading platforms and growing financial literacy are driving demand.
Barriers & Challenges:
- Cybersecurity Threats: The increasing reliance on digital infrastructure makes exchanges vulnerable to sophisticated cyberattacks, posing a significant risk to data integrity and market stability.
- Regulatory Compliance: Navigating complex and evolving international regulations can be costly and time-consuming, potentially hindering cross-border operations and innovation.
- Market Volatility: Geopolitical events, economic downturns, and unexpected crises can lead to extreme market fluctuations, impacting investor confidence and trading volumes.
- Competition from Alternative Platforms: The rise of decentralized finance (DeFi) and alternative trading systems presents a competitive challenge to traditional exchanges.
Emerging Opportunities in Capital Exchange Ecosystem Market
Emerging opportunities in the Capital Exchange Ecosystem Market lie in the further integration of AI for personalized investment advice and risk management, and the widespread adoption of blockchain for faster, more secure, and transparent clearing and settlement. The growing demand for ESG-compliant investments presents a significant avenue for developing and listing sustainable financial products. Untapped markets in developing economies, with their burgeoning investor bases and increasing capital requirements, offer substantial growth potential. Furthermore, the development of digital asset exchanges for trading tokenized securities and other digital assets represents a frontier of innovation.
Growth Accelerators in the Capital Exchange Ecosystem Market Industry
The Capital Exchange Ecosystem Market is experiencing significant growth acceleration driven by several key factors. The ongoing digital transformation, which involves the widespread adoption of cloud computing, big data analytics, and artificial intelligence, is revolutionizing trading operations and enhancing market efficiency. Strategic partnerships between traditional exchanges and FinTech firms are fostering innovation and the development of novel products and services. Furthermore, the expansion of markets into new geographic regions, coupled with favorable government policies aimed at attracting foreign investment, are creating new avenues for growth and liquidity. The increasing sophistication of trading algorithms and the development of robust market surveillance systems are also contributing to greater investor confidence and participation.
Key Players Shaping the Capital Exchange Ecosystem Market Market
- New York Stock Exchange
- Japan Exchange Group
- London Stock Exchange
- Hong Kong Stock Exchange
- Shanghai Stock Exchange
- National Stock Exchange
- EURONEXT
- NASDAQ
- Bombay Stock Exchange
- Saudi Stock Exchange
Notable Milestones in Capital Exchange Ecosystem Market Sector
- December 2023: Defiance ETFs launched the Defiance Israel Bond ETF (NYSE Arca: CHAI) on the New York Stock Exchange, providing investors access to Israeli government and corporate bonds mirrored by the MCM (Migdal Capital Markets) BlueStar Israel Bond Index. This initiative enhances investment avenues for USD and shekel-denominated bonds.
- January 2024: The National Stock Exchange (NSE) reported a 22% increase in its investor base, rising from 70 million to 85.4 million during the calendar year 2023. This growth signifies a substantial influx of retail investors into the stock market, highlighting increased accessibility and interest.
In-Depth Capital Exchange Ecosystem Market Market Outlook
The outlook for the Capital Exchange Ecosystem Market remains exceptionally strong, fueled by a confluence of accelerating growth drivers. Continued technological innovation, particularly in AI and blockchain, will redefine market infrastructure and operational efficiencies. The increasing demand for sustainable and impact investing, alongside the ongoing expansion into emerging markets, presents significant opportunities for market participants. Strategic collaborations and the development of a more integrated global financial ecosystem will foster further growth. The market is poised for sustained expansion as it adapts to evolving investor preferences and embraces new financial paradigms, making it an attractive landscape for investment and innovation.
Capital Exchange Ecosystem Market Segmentation
-
1. Market Composition
- 1.1. Primary
- 1.2. Secondary
-
2. Capital Market
- 2.1. Stocks
- 2.2. Bonds
-
3. Stock Type
- 3.1. Common and Preferred
- 3.2. Growth Stock
- 3.3. Value Stock
- 3.4. Defensive stock
-
4. Bond Type
- 4.1. Government
- 4.2. Corporate
- 4.3. Municiple
- 4.4. Mortgage
- 4.5. Other Bond Types
Capital Exchange Ecosystem Market Segmentation By Geography
-
1. North America
- 1.1. United States
- 1.2. Canada
- 1.3. Mexico
-
2. South America
- 2.1. Brazil
- 2.2. Argentina
- 2.3. Rest of South America
-
3. Europe
- 3.1. United Kingdom
- 3.2. Germany
- 3.3. France
- 3.4. Italy
- 3.5. Spain
- 3.6. Russia
- 3.7. Benelux
- 3.8. Nordics
- 3.9. Rest of Europe
-
4. Middle East & Africa
- 4.1. Turkey
- 4.2. Israel
- 4.3. GCC
- 4.4. North Africa
- 4.5. South Africa
- 4.6. Rest of Middle East & Africa
-
5. Asia Pacific
- 5.1. China
- 5.2. India
- 5.3. Japan
- 5.4. South Korea
- 5.5. ASEAN
- 5.6. Oceania
- 5.7. Rest of Asia Pacific
Capital Exchange Ecosystem Market Regional Market Share
Geographic Coverage of Capital Exchange Ecosystem Market
Capital Exchange Ecosystem Market REPORT HIGHLIGHTS
| Aspects | Details |
|---|---|
| Study Period | 2020-2034 |
| Base Year | 2025 |
| Estimated Year | 2026 |
| Forecast Period | 2026-2034 |
| Historical Period | 2020-2025 |
| Growth Rate | CAGR of 5.80% from 2020-2034 |
| Segmentation |
|
Table of Contents
- 1. Introduction
- 1.1. Research Scope
- 1.2. Market Segmentation
- 1.3. Research Objective
- 1.4. Definitions and Assumptions
- 2. Executive Summary
- 2.1. Market Snapshot
- 3. Market Dynamics
- 3.1. Market Drivers
- 3.2. Market Restrains
- 3.3. Market Trends
- 3.4. Market Opportunities
- 4. Market Factor Analysis
- 4.1. Porters Five Forces
- 4.1.1. Bargaining Power of Suppliers
- 4.1.2. Bargaining Power of Buyers
- 4.1.3. Threat of New Entrants
- 4.1.4. Threat of Substitutes
- 4.1.5. Competitive Rivalry
- 4.2. PESTEL analysis
- 4.3. BCG Analysis
- 4.3.1. Stars (High Growth, High Market Share)
- 4.3.2. Cash Cows (Low Growth, High Market Share)
- 4.3.3. Question Mark (High Growth, Low Market Share)
- 4.3.4. Dogs (Low Growth, Low Market Share)
- 4.4. Ansoff Matrix Analysis
- 4.5. Supply Chain Analysis
- 4.6. Regulatory Landscape
- 4.7. Current Market Potential and Opportunity Assessment (TAM–SAM–SOM Framework)
- 4.8. IMR Analyst Note
- 4.1. Porters Five Forces
- 5. Market Analysis, Insights and Forecast 2021-2033
- 5.1. Market Analysis, Insights and Forecast - by Market Composition
- 5.1.1. Primary
- 5.1.2. Secondary
- 5.2. Market Analysis, Insights and Forecast - by Capital Market
- 5.2.1. Stocks
- 5.2.2. Bonds
- 5.3. Market Analysis, Insights and Forecast - by Stock Type
- 5.3.1. Common and Preferred
- 5.3.2. Growth Stock
- 5.3.3. Value Stock
- 5.3.4. Defensive stock
- 5.4. Market Analysis, Insights and Forecast - by Bond Type
- 5.4.1. Government
- 5.4.2. Corporate
- 5.4.3. Municiple
- 5.4.4. Mortgage
- 5.4.5. Other Bond Types
- 5.5. Market Analysis, Insights and Forecast - by Region
- 5.5.1. North America
- 5.5.2. South America
- 5.5.3. Europe
- 5.5.4. Middle East & Africa
- 5.5.5. Asia Pacific
- 5.1. Market Analysis, Insights and Forecast - by Market Composition
- 6. Global Capital Exchange Ecosystem Market Analysis, Insights and Forecast, 2021-2033
- 6.1. Market Analysis, Insights and Forecast - by Market Composition
- 6.1.1. Primary
- 6.1.2. Secondary
- 6.2. Market Analysis, Insights and Forecast - by Capital Market
- 6.2.1. Stocks
- 6.2.2. Bonds
- 6.3. Market Analysis, Insights and Forecast - by Stock Type
- 6.3.1. Common and Preferred
- 6.3.2. Growth Stock
- 6.3.3. Value Stock
- 6.3.4. Defensive stock
- 6.4. Market Analysis, Insights and Forecast - by Bond Type
- 6.4.1. Government
- 6.4.2. Corporate
- 6.4.3. Municiple
- 6.4.4. Mortgage
- 6.4.5. Other Bond Types
- 6.1. Market Analysis, Insights and Forecast - by Market Composition
- 7. North America Capital Exchange Ecosystem Market Analysis, Insights and Forecast, 2020-2032
- 7.1. Market Analysis, Insights and Forecast - by Market Composition
- 7.1.1. Primary
- 7.1.2. Secondary
- 7.2. Market Analysis, Insights and Forecast - by Capital Market
- 7.2.1. Stocks
- 7.2.2. Bonds
- 7.3. Market Analysis, Insights and Forecast - by Stock Type
- 7.3.1. Common and Preferred
- 7.3.2. Growth Stock
- 7.3.3. Value Stock
- 7.3.4. Defensive stock
- 7.4. Market Analysis, Insights and Forecast - by Bond Type
- 7.4.1. Government
- 7.4.2. Corporate
- 7.4.3. Municiple
- 7.4.4. Mortgage
- 7.4.5. Other Bond Types
- 7.1. Market Analysis, Insights and Forecast - by Market Composition
- 8. South America Capital Exchange Ecosystem Market Analysis, Insights and Forecast, 2020-2032
- 8.1. Market Analysis, Insights and Forecast - by Market Composition
- 8.1.1. Primary
- 8.1.2. Secondary
- 8.2. Market Analysis, Insights and Forecast - by Capital Market
- 8.2.1. Stocks
- 8.2.2. Bonds
- 8.3. Market Analysis, Insights and Forecast - by Stock Type
- 8.3.1. Common and Preferred
- 8.3.2. Growth Stock
- 8.3.3. Value Stock
- 8.3.4. Defensive stock
- 8.4. Market Analysis, Insights and Forecast - by Bond Type
- 8.4.1. Government
- 8.4.2. Corporate
- 8.4.3. Municiple
- 8.4.4. Mortgage
- 8.4.5. Other Bond Types
- 8.1. Market Analysis, Insights and Forecast - by Market Composition
- 9. Europe Capital Exchange Ecosystem Market Analysis, Insights and Forecast, 2020-2032
- 9.1. Market Analysis, Insights and Forecast - by Market Composition
- 9.1.1. Primary
- 9.1.2. Secondary
- 9.2. Market Analysis, Insights and Forecast - by Capital Market
- 9.2.1. Stocks
- 9.2.2. Bonds
- 9.3. Market Analysis, Insights and Forecast - by Stock Type
- 9.3.1. Common and Preferred
- 9.3.2. Growth Stock
- 9.3.3. Value Stock
- 9.3.4. Defensive stock
- 9.4. Market Analysis, Insights and Forecast - by Bond Type
- 9.4.1. Government
- 9.4.2. Corporate
- 9.4.3. Municiple
- 9.4.4. Mortgage
- 9.4.5. Other Bond Types
- 9.1. Market Analysis, Insights and Forecast - by Market Composition
- 10. Middle East & Africa Capital Exchange Ecosystem Market Analysis, Insights and Forecast, 2020-2032
- 10.1. Market Analysis, Insights and Forecast - by Market Composition
- 10.1.1. Primary
- 10.1.2. Secondary
- 10.2. Market Analysis, Insights and Forecast - by Capital Market
- 10.2.1. Stocks
- 10.2.2. Bonds
- 10.3. Market Analysis, Insights and Forecast - by Stock Type
- 10.3.1. Common and Preferred
- 10.3.2. Growth Stock
- 10.3.3. Value Stock
- 10.3.4. Defensive stock
- 10.4. Market Analysis, Insights and Forecast - by Bond Type
- 10.4.1. Government
- 10.4.2. Corporate
- 10.4.3. Municiple
- 10.4.4. Mortgage
- 10.4.5. Other Bond Types
- 10.1. Market Analysis, Insights and Forecast - by Market Composition
- 11. Asia Pacific Capital Exchange Ecosystem Market Analysis, Insights and Forecast, 2020-2032
- 11.1. Market Analysis, Insights and Forecast - by Market Composition
- 11.1.1. Primary
- 11.1.2. Secondary
- 11.2. Market Analysis, Insights and Forecast - by Capital Market
- 11.2.1. Stocks
- 11.2.2. Bonds
- 11.3. Market Analysis, Insights and Forecast - by Stock Type
- 11.3.1. Common and Preferred
- 11.3.2. Growth Stock
- 11.3.3. Value Stock
- 11.3.4. Defensive stock
- 11.4. Market Analysis, Insights and Forecast - by Bond Type
- 11.4.1. Government
- 11.4.2. Corporate
- 11.4.3. Municiple
- 11.4.4. Mortgage
- 11.4.5. Other Bond Types
- 11.1. Market Analysis, Insights and Forecast - by Market Composition
- 12. Competitive Analysis
- 12.1. Company Profiles
- 12.1.1 New York Stock Exchange
- 12.1.1.1. Company Overview
- 12.1.1.2. Products
- 12.1.1.3. Company Financials
- 12.1.1.4. SWOT Analysis
- 12.1.2 Japan Exchange Group
- 12.1.2.1. Company Overview
- 12.1.2.2. Products
- 12.1.2.3. Company Financials
- 12.1.2.4. SWOT Analysis
- 12.1.3 London Stock Exchange
- 12.1.3.1. Company Overview
- 12.1.3.2. Products
- 12.1.3.3. Company Financials
- 12.1.3.4. SWOT Analysis
- 12.1.4 HongKong Stock Exchange
- 12.1.4.1. Company Overview
- 12.1.4.2. Products
- 12.1.4.3. Company Financials
- 12.1.4.4. SWOT Analysis
- 12.1.5 Shanghai Stock Exchange
- 12.1.5.1. Company Overview
- 12.1.5.2. Products
- 12.1.5.3. Company Financials
- 12.1.5.4. SWOT Analysis
- 12.1.6 National Stock Exchange
- 12.1.6.1. Company Overview
- 12.1.6.2. Products
- 12.1.6.3. Company Financials
- 12.1.6.4. SWOT Analysis
- 12.1.7 EURONEXT
- 12.1.7.1. Company Overview
- 12.1.7.2. Products
- 12.1.7.3. Company Financials
- 12.1.7.4. SWOT Analysis
- 12.1.8 NASDAQ
- 12.1.8.1. Company Overview
- 12.1.8.2. Products
- 12.1.8.3. Company Financials
- 12.1.8.4. SWOT Analysis
- 12.1.9 Bombay Stock Exchange
- 12.1.9.1. Company Overview
- 12.1.9.2. Products
- 12.1.9.3. Company Financials
- 12.1.9.4. SWOT Analysis
- 12.1.10 Saudi Stock Exchange**List Not Exhaustive
- 12.1.10.1. Company Overview
- 12.1.10.2. Products
- 12.1.10.3. Company Financials
- 12.1.10.4. SWOT Analysis
- 12.1.1 New York Stock Exchange
- 12.2. Market Entropy
- 12.2.1 Company's Key Areas Served
- 12.2.2 Recent Developments
- 12.3. Company Market Share Analysis 2025
- 12.3.1 Top 5 Companies Market Share Analysis
- 12.3.2 Top 3 Companies Market Share Analysis
- 12.4. List of Potential Customers
- 13. Research Methodology
List of Figures
- Figure 1: Global Capital Exchange Ecosystem Market Revenue Breakdown (Million, %) by Region 2025 & 2033
- Figure 2: Global Capital Exchange Ecosystem Market Volume Breakdown (Trillion, %) by Region 2025 & 2033
- Figure 3: North America Capital Exchange Ecosystem Market Revenue (Million), by Market Composition 2025 & 2033
- Figure 4: North America Capital Exchange Ecosystem Market Volume (Trillion), by Market Composition 2025 & 2033
- Figure 5: North America Capital Exchange Ecosystem Market Revenue Share (%), by Market Composition 2025 & 2033
- Figure 6: North America Capital Exchange Ecosystem Market Volume Share (%), by Market Composition 2025 & 2033
- Figure 7: North America Capital Exchange Ecosystem Market Revenue (Million), by Capital Market 2025 & 2033
- Figure 8: North America Capital Exchange Ecosystem Market Volume (Trillion), by Capital Market 2025 & 2033
- Figure 9: North America Capital Exchange Ecosystem Market Revenue Share (%), by Capital Market 2025 & 2033
- Figure 10: North America Capital Exchange Ecosystem Market Volume Share (%), by Capital Market 2025 & 2033
- Figure 11: North America Capital Exchange Ecosystem Market Revenue (Million), by Stock Type 2025 & 2033
- Figure 12: North America Capital Exchange Ecosystem Market Volume (Trillion), by Stock Type 2025 & 2033
- Figure 13: North America Capital Exchange Ecosystem Market Revenue Share (%), by Stock Type 2025 & 2033
- Figure 14: North America Capital Exchange Ecosystem Market Volume Share (%), by Stock Type 2025 & 2033
- Figure 15: North America Capital Exchange Ecosystem Market Revenue (Million), by Bond Type 2025 & 2033
- Figure 16: North America Capital Exchange Ecosystem Market Volume (Trillion), by Bond Type 2025 & 2033
- Figure 17: North America Capital Exchange Ecosystem Market Revenue Share (%), by Bond Type 2025 & 2033
- Figure 18: North America Capital Exchange Ecosystem Market Volume Share (%), by Bond Type 2025 & 2033
- Figure 19: North America Capital Exchange Ecosystem Market Revenue (Million), by Country 2025 & 2033
- Figure 20: North America Capital Exchange Ecosystem Market Volume (Trillion), by Country 2025 & 2033
- Figure 21: North America Capital Exchange Ecosystem Market Revenue Share (%), by Country 2025 & 2033
- Figure 22: North America Capital Exchange Ecosystem Market Volume Share (%), by Country 2025 & 2033
- Figure 23: South America Capital Exchange Ecosystem Market Revenue (Million), by Market Composition 2025 & 2033
- Figure 24: South America Capital Exchange Ecosystem Market Volume (Trillion), by Market Composition 2025 & 2033
- Figure 25: South America Capital Exchange Ecosystem Market Revenue Share (%), by Market Composition 2025 & 2033
- Figure 26: South America Capital Exchange Ecosystem Market Volume Share (%), by Market Composition 2025 & 2033
- Figure 27: South America Capital Exchange Ecosystem Market Revenue (Million), by Capital Market 2025 & 2033
- Figure 28: South America Capital Exchange Ecosystem Market Volume (Trillion), by Capital Market 2025 & 2033
- Figure 29: South America Capital Exchange Ecosystem Market Revenue Share (%), by Capital Market 2025 & 2033
- Figure 30: South America Capital Exchange Ecosystem Market Volume Share (%), by Capital Market 2025 & 2033
- Figure 31: South America Capital Exchange Ecosystem Market Revenue (Million), by Stock Type 2025 & 2033
- Figure 32: South America Capital Exchange Ecosystem Market Volume (Trillion), by Stock Type 2025 & 2033
- Figure 33: South America Capital Exchange Ecosystem Market Revenue Share (%), by Stock Type 2025 & 2033
- Figure 34: South America Capital Exchange Ecosystem Market Volume Share (%), by Stock Type 2025 & 2033
- Figure 35: South America Capital Exchange Ecosystem Market Revenue (Million), by Bond Type 2025 & 2033
- Figure 36: South America Capital Exchange Ecosystem Market Volume (Trillion), by Bond Type 2025 & 2033
- Figure 37: South America Capital Exchange Ecosystem Market Revenue Share (%), by Bond Type 2025 & 2033
- Figure 38: South America Capital Exchange Ecosystem Market Volume Share (%), by Bond Type 2025 & 2033
- Figure 39: South America Capital Exchange Ecosystem Market Revenue (Million), by Country 2025 & 2033
- Figure 40: South America Capital Exchange Ecosystem Market Volume (Trillion), by Country 2025 & 2033
- Figure 41: South America Capital Exchange Ecosystem Market Revenue Share (%), by Country 2025 & 2033
- Figure 42: South America Capital Exchange Ecosystem Market Volume Share (%), by Country 2025 & 2033
- Figure 43: Europe Capital Exchange Ecosystem Market Revenue (Million), by Market Composition 2025 & 2033
- Figure 44: Europe Capital Exchange Ecosystem Market Volume (Trillion), by Market Composition 2025 & 2033
- Figure 45: Europe Capital Exchange Ecosystem Market Revenue Share (%), by Market Composition 2025 & 2033
- Figure 46: Europe Capital Exchange Ecosystem Market Volume Share (%), by Market Composition 2025 & 2033
- Figure 47: Europe Capital Exchange Ecosystem Market Revenue (Million), by Capital Market 2025 & 2033
- Figure 48: Europe Capital Exchange Ecosystem Market Volume (Trillion), by Capital Market 2025 & 2033
- Figure 49: Europe Capital Exchange Ecosystem Market Revenue Share (%), by Capital Market 2025 & 2033
- Figure 50: Europe Capital Exchange Ecosystem Market Volume Share (%), by Capital Market 2025 & 2033
- Figure 51: Europe Capital Exchange Ecosystem Market Revenue (Million), by Stock Type 2025 & 2033
- Figure 52: Europe Capital Exchange Ecosystem Market Volume (Trillion), by Stock Type 2025 & 2033
- Figure 53: Europe Capital Exchange Ecosystem Market Revenue Share (%), by Stock Type 2025 & 2033
- Figure 54: Europe Capital Exchange Ecosystem Market Volume Share (%), by Stock Type 2025 & 2033
- Figure 55: Europe Capital Exchange Ecosystem Market Revenue (Million), by Bond Type 2025 & 2033
- Figure 56: Europe Capital Exchange Ecosystem Market Volume (Trillion), by Bond Type 2025 & 2033
- Figure 57: Europe Capital Exchange Ecosystem Market Revenue Share (%), by Bond Type 2025 & 2033
- Figure 58: Europe Capital Exchange Ecosystem Market Volume Share (%), by Bond Type 2025 & 2033
- Figure 59: Europe Capital Exchange Ecosystem Market Revenue (Million), by Country 2025 & 2033
- Figure 60: Europe Capital Exchange Ecosystem Market Volume (Trillion), by Country 2025 & 2033
- Figure 61: Europe Capital Exchange Ecosystem Market Revenue Share (%), by Country 2025 & 2033
- Figure 62: Europe Capital Exchange Ecosystem Market Volume Share (%), by Country 2025 & 2033
- Figure 63: Middle East & Africa Capital Exchange Ecosystem Market Revenue (Million), by Market Composition 2025 & 2033
- Figure 64: Middle East & Africa Capital Exchange Ecosystem Market Volume (Trillion), by Market Composition 2025 & 2033
- Figure 65: Middle East & Africa Capital Exchange Ecosystem Market Revenue Share (%), by Market Composition 2025 & 2033
- Figure 66: Middle East & Africa Capital Exchange Ecosystem Market Volume Share (%), by Market Composition 2025 & 2033
- Figure 67: Middle East & Africa Capital Exchange Ecosystem Market Revenue (Million), by Capital Market 2025 & 2033
- Figure 68: Middle East & Africa Capital Exchange Ecosystem Market Volume (Trillion), by Capital Market 2025 & 2033
- Figure 69: Middle East & Africa Capital Exchange Ecosystem Market Revenue Share (%), by Capital Market 2025 & 2033
- Figure 70: Middle East & Africa Capital Exchange Ecosystem Market Volume Share (%), by Capital Market 2025 & 2033
- Figure 71: Middle East & Africa Capital Exchange Ecosystem Market Revenue (Million), by Stock Type 2025 & 2033
- Figure 72: Middle East & Africa Capital Exchange Ecosystem Market Volume (Trillion), by Stock Type 2025 & 2033
- Figure 73: Middle East & Africa Capital Exchange Ecosystem Market Revenue Share (%), by Stock Type 2025 & 2033
- Figure 74: Middle East & Africa Capital Exchange Ecosystem Market Volume Share (%), by Stock Type 2025 & 2033
- Figure 75: Middle East & Africa Capital Exchange Ecosystem Market Revenue (Million), by Bond Type 2025 & 2033
- Figure 76: Middle East & Africa Capital Exchange Ecosystem Market Volume (Trillion), by Bond Type 2025 & 2033
- Figure 77: Middle East & Africa Capital Exchange Ecosystem Market Revenue Share (%), by Bond Type 2025 & 2033
- Figure 78: Middle East & Africa Capital Exchange Ecosystem Market Volume Share (%), by Bond Type 2025 & 2033
- Figure 79: Middle East & Africa Capital Exchange Ecosystem Market Revenue (Million), by Country 2025 & 2033
- Figure 80: Middle East & Africa Capital Exchange Ecosystem Market Volume (Trillion), by Country 2025 & 2033
- Figure 81: Middle East & Africa Capital Exchange Ecosystem Market Revenue Share (%), by Country 2025 & 2033
- Figure 82: Middle East & Africa Capital Exchange Ecosystem Market Volume Share (%), by Country 2025 & 2033
- Figure 83: Asia Pacific Capital Exchange Ecosystem Market Revenue (Million), by Market Composition 2025 & 2033
- Figure 84: Asia Pacific Capital Exchange Ecosystem Market Volume (Trillion), by Market Composition 2025 & 2033
- Figure 85: Asia Pacific Capital Exchange Ecosystem Market Revenue Share (%), by Market Composition 2025 & 2033
- Figure 86: Asia Pacific Capital Exchange Ecosystem Market Volume Share (%), by Market Composition 2025 & 2033
- Figure 87: Asia Pacific Capital Exchange Ecosystem Market Revenue (Million), by Capital Market 2025 & 2033
- Figure 88: Asia Pacific Capital Exchange Ecosystem Market Volume (Trillion), by Capital Market 2025 & 2033
- Figure 89: Asia Pacific Capital Exchange Ecosystem Market Revenue Share (%), by Capital Market 2025 & 2033
- Figure 90: Asia Pacific Capital Exchange Ecosystem Market Volume Share (%), by Capital Market 2025 & 2033
- Figure 91: Asia Pacific Capital Exchange Ecosystem Market Revenue (Million), by Stock Type 2025 & 2033
- Figure 92: Asia Pacific Capital Exchange Ecosystem Market Volume (Trillion), by Stock Type 2025 & 2033
- Figure 93: Asia Pacific Capital Exchange Ecosystem Market Revenue Share (%), by Stock Type 2025 & 2033
- Figure 94: Asia Pacific Capital Exchange Ecosystem Market Volume Share (%), by Stock Type 2025 & 2033
- Figure 95: Asia Pacific Capital Exchange Ecosystem Market Revenue (Million), by Bond Type 2025 & 2033
- Figure 96: Asia Pacific Capital Exchange Ecosystem Market Volume (Trillion), by Bond Type 2025 & 2033
- Figure 97: Asia Pacific Capital Exchange Ecosystem Market Revenue Share (%), by Bond Type 2025 & 2033
- Figure 98: Asia Pacific Capital Exchange Ecosystem Market Volume Share (%), by Bond Type 2025 & 2033
- Figure 99: Asia Pacific Capital Exchange Ecosystem Market Revenue (Million), by Country 2025 & 2033
- Figure 100: Asia Pacific Capital Exchange Ecosystem Market Volume (Trillion), by Country 2025 & 2033
- Figure 101: Asia Pacific Capital Exchange Ecosystem Market Revenue Share (%), by Country 2025 & 2033
- Figure 102: Asia Pacific Capital Exchange Ecosystem Market Volume Share (%), by Country 2025 & 2033
List of Tables
- Table 1: Global Capital Exchange Ecosystem Market Revenue Million Forecast, by Market Composition 2020 & 2033
- Table 2: Global Capital Exchange Ecosystem Market Volume Trillion Forecast, by Market Composition 2020 & 2033
- Table 3: Global Capital Exchange Ecosystem Market Revenue Million Forecast, by Capital Market 2020 & 2033
- Table 4: Global Capital Exchange Ecosystem Market Volume Trillion Forecast, by Capital Market 2020 & 2033
- Table 5: Global Capital Exchange Ecosystem Market Revenue Million Forecast, by Stock Type 2020 & 2033
- Table 6: Global Capital Exchange Ecosystem Market Volume Trillion Forecast, by Stock Type 2020 & 2033
- Table 7: Global Capital Exchange Ecosystem Market Revenue Million Forecast, by Bond Type 2020 & 2033
- Table 8: Global Capital Exchange Ecosystem Market Volume Trillion Forecast, by Bond Type 2020 & 2033
- Table 9: Global Capital Exchange Ecosystem Market Revenue Million Forecast, by Region 2020 & 2033
- Table 10: Global Capital Exchange Ecosystem Market Volume Trillion Forecast, by Region 2020 & 2033
- Table 11: Global Capital Exchange Ecosystem Market Revenue Million Forecast, by Market Composition 2020 & 2033
- Table 12: Global Capital Exchange Ecosystem Market Volume Trillion Forecast, by Market Composition 2020 & 2033
- Table 13: Global Capital Exchange Ecosystem Market Revenue Million Forecast, by Capital Market 2020 & 2033
- Table 14: Global Capital Exchange Ecosystem Market Volume Trillion Forecast, by Capital Market 2020 & 2033
- Table 15: Global Capital Exchange Ecosystem Market Revenue Million Forecast, by Stock Type 2020 & 2033
- Table 16: Global Capital Exchange Ecosystem Market Volume Trillion Forecast, by Stock Type 2020 & 2033
- Table 17: Global Capital Exchange Ecosystem Market Revenue Million Forecast, by Bond Type 2020 & 2033
- Table 18: Global Capital Exchange Ecosystem Market Volume Trillion Forecast, by Bond Type 2020 & 2033
- Table 19: Global Capital Exchange Ecosystem Market Revenue Million Forecast, by Country 2020 & 2033
- Table 20: Global Capital Exchange Ecosystem Market Volume Trillion Forecast, by Country 2020 & 2033
- Table 21: United States Capital Exchange Ecosystem Market Revenue (Million) Forecast, by Application 2020 & 2033
- Table 22: United States Capital Exchange Ecosystem Market Volume (Trillion) Forecast, by Application 2020 & 2033
- Table 23: Canada Capital Exchange Ecosystem Market Revenue (Million) Forecast, by Application 2020 & 2033
- Table 24: Canada Capital Exchange Ecosystem Market Volume (Trillion) Forecast, by Application 2020 & 2033
- Table 25: Mexico Capital Exchange Ecosystem Market Revenue (Million) Forecast, by Application 2020 & 2033
- Table 26: Mexico Capital Exchange Ecosystem Market Volume (Trillion) Forecast, by Application 2020 & 2033
- Table 27: Global Capital Exchange Ecosystem Market Revenue Million Forecast, by Market Composition 2020 & 2033
- Table 28: Global Capital Exchange Ecosystem Market Volume Trillion Forecast, by Market Composition 2020 & 2033
- Table 29: Global Capital Exchange Ecosystem Market Revenue Million Forecast, by Capital Market 2020 & 2033
- Table 30: Global Capital Exchange Ecosystem Market Volume Trillion Forecast, by Capital Market 2020 & 2033
- Table 31: Global Capital Exchange Ecosystem Market Revenue Million Forecast, by Stock Type 2020 & 2033
- Table 32: Global Capital Exchange Ecosystem Market Volume Trillion Forecast, by Stock Type 2020 & 2033
- Table 33: Global Capital Exchange Ecosystem Market Revenue Million Forecast, by Bond Type 2020 & 2033
- Table 34: Global Capital Exchange Ecosystem Market Volume Trillion Forecast, by Bond Type 2020 & 2033
- Table 35: Global Capital Exchange Ecosystem Market Revenue Million Forecast, by Country 2020 & 2033
- Table 36: Global Capital Exchange Ecosystem Market Volume Trillion Forecast, by Country 2020 & 2033
- Table 37: Brazil Capital Exchange Ecosystem Market Revenue (Million) Forecast, by Application 2020 & 2033
- Table 38: Brazil Capital Exchange Ecosystem Market Volume (Trillion) Forecast, by Application 2020 & 2033
- Table 39: Argentina Capital Exchange Ecosystem Market Revenue (Million) Forecast, by Application 2020 & 2033
- Table 40: Argentina Capital Exchange Ecosystem Market Volume (Trillion) Forecast, by Application 2020 & 2033
- Table 41: Rest of South America Capital Exchange Ecosystem Market Revenue (Million) Forecast, by Application 2020 & 2033
- Table 42: Rest of South America Capital Exchange Ecosystem Market Volume (Trillion) Forecast, by Application 2020 & 2033
- Table 43: Global Capital Exchange Ecosystem Market Revenue Million Forecast, by Market Composition 2020 & 2033
- Table 44: Global Capital Exchange Ecosystem Market Volume Trillion Forecast, by Market Composition 2020 & 2033
- Table 45: Global Capital Exchange Ecosystem Market Revenue Million Forecast, by Capital Market 2020 & 2033
- Table 46: Global Capital Exchange Ecosystem Market Volume Trillion Forecast, by Capital Market 2020 & 2033
- Table 47: Global Capital Exchange Ecosystem Market Revenue Million Forecast, by Stock Type 2020 & 2033
- Table 48: Global Capital Exchange Ecosystem Market Volume Trillion Forecast, by Stock Type 2020 & 2033
- Table 49: Global Capital Exchange Ecosystem Market Revenue Million Forecast, by Bond Type 2020 & 2033
- Table 50: Global Capital Exchange Ecosystem Market Volume Trillion Forecast, by Bond Type 2020 & 2033
- Table 51: Global Capital Exchange Ecosystem Market Revenue Million Forecast, by Country 2020 & 2033
- Table 52: Global Capital Exchange Ecosystem Market Volume Trillion Forecast, by Country 2020 & 2033
- Table 53: United Kingdom Capital Exchange Ecosystem Market Revenue (Million) Forecast, by Application 2020 & 2033
- Table 54: United Kingdom Capital Exchange Ecosystem Market Volume (Trillion) Forecast, by Application 2020 & 2033
- Table 55: Germany Capital Exchange Ecosystem Market Revenue (Million) Forecast, by Application 2020 & 2033
- Table 56: Germany Capital Exchange Ecosystem Market Volume (Trillion) Forecast, by Application 2020 & 2033
- Table 57: France Capital Exchange Ecosystem Market Revenue (Million) Forecast, by Application 2020 & 2033
- Table 58: France Capital Exchange Ecosystem Market Volume (Trillion) Forecast, by Application 2020 & 2033
- Table 59: Italy Capital Exchange Ecosystem Market Revenue (Million) Forecast, by Application 2020 & 2033
- Table 60: Italy Capital Exchange Ecosystem Market Volume (Trillion) Forecast, by Application 2020 & 2033
- Table 61: Spain Capital Exchange Ecosystem Market Revenue (Million) Forecast, by Application 2020 & 2033
- Table 62: Spain Capital Exchange Ecosystem Market Volume (Trillion) Forecast, by Application 2020 & 2033
- Table 63: Russia Capital Exchange Ecosystem Market Revenue (Million) Forecast, by Application 2020 & 2033
- Table 64: Russia Capital Exchange Ecosystem Market Volume (Trillion) Forecast, by Application 2020 & 2033
- Table 65: Benelux Capital Exchange Ecosystem Market Revenue (Million) Forecast, by Application 2020 & 2033
- Table 66: Benelux Capital Exchange Ecosystem Market Volume (Trillion) Forecast, by Application 2020 & 2033
- Table 67: Nordics Capital Exchange Ecosystem Market Revenue (Million) Forecast, by Application 2020 & 2033
- Table 68: Nordics Capital Exchange Ecosystem Market Volume (Trillion) Forecast, by Application 2020 & 2033
- Table 69: Rest of Europe Capital Exchange Ecosystem Market Revenue (Million) Forecast, by Application 2020 & 2033
- Table 70: Rest of Europe Capital Exchange Ecosystem Market Volume (Trillion) Forecast, by Application 2020 & 2033
- Table 71: Global Capital Exchange Ecosystem Market Revenue Million Forecast, by Market Composition 2020 & 2033
- Table 72: Global Capital Exchange Ecosystem Market Volume Trillion Forecast, by Market Composition 2020 & 2033
- Table 73: Global Capital Exchange Ecosystem Market Revenue Million Forecast, by Capital Market 2020 & 2033
- Table 74: Global Capital Exchange Ecosystem Market Volume Trillion Forecast, by Capital Market 2020 & 2033
- Table 75: Global Capital Exchange Ecosystem Market Revenue Million Forecast, by Stock Type 2020 & 2033
- Table 76: Global Capital Exchange Ecosystem Market Volume Trillion Forecast, by Stock Type 2020 & 2033
- Table 77: Global Capital Exchange Ecosystem Market Revenue Million Forecast, by Bond Type 2020 & 2033
- Table 78: Global Capital Exchange Ecosystem Market Volume Trillion Forecast, by Bond Type 2020 & 2033
- Table 79: Global Capital Exchange Ecosystem Market Revenue Million Forecast, by Country 2020 & 2033
- Table 80: Global Capital Exchange Ecosystem Market Volume Trillion Forecast, by Country 2020 & 2033
- Table 81: Turkey Capital Exchange Ecosystem Market Revenue (Million) Forecast, by Application 2020 & 2033
- Table 82: Turkey Capital Exchange Ecosystem Market Volume (Trillion) Forecast, by Application 2020 & 2033
- Table 83: Israel Capital Exchange Ecosystem Market Revenue (Million) Forecast, by Application 2020 & 2033
- Table 84: Israel Capital Exchange Ecosystem Market Volume (Trillion) Forecast, by Application 2020 & 2033
- Table 85: GCC Capital Exchange Ecosystem Market Revenue (Million) Forecast, by Application 2020 & 2033
- Table 86: GCC Capital Exchange Ecosystem Market Volume (Trillion) Forecast, by Application 2020 & 2033
- Table 87: North Africa Capital Exchange Ecosystem Market Revenue (Million) Forecast, by Application 2020 & 2033
- Table 88: North Africa Capital Exchange Ecosystem Market Volume (Trillion) Forecast, by Application 2020 & 2033
- Table 89: South Africa Capital Exchange Ecosystem Market Revenue (Million) Forecast, by Application 2020 & 2033
- Table 90: South Africa Capital Exchange Ecosystem Market Volume (Trillion) Forecast, by Application 2020 & 2033
- Table 91: Rest of Middle East & Africa Capital Exchange Ecosystem Market Revenue (Million) Forecast, by Application 2020 & 2033
- Table 92: Rest of Middle East & Africa Capital Exchange Ecosystem Market Volume (Trillion) Forecast, by Application 2020 & 2033
- Table 93: Global Capital Exchange Ecosystem Market Revenue Million Forecast, by Market Composition 2020 & 2033
- Table 94: Global Capital Exchange Ecosystem Market Volume Trillion Forecast, by Market Composition 2020 & 2033
- Table 95: Global Capital Exchange Ecosystem Market Revenue Million Forecast, by Capital Market 2020 & 2033
- Table 96: Global Capital Exchange Ecosystem Market Volume Trillion Forecast, by Capital Market 2020 & 2033
- Table 97: Global Capital Exchange Ecosystem Market Revenue Million Forecast, by Stock Type 2020 & 2033
- Table 98: Global Capital Exchange Ecosystem Market Volume Trillion Forecast, by Stock Type 2020 & 2033
- Table 99: Global Capital Exchange Ecosystem Market Revenue Million Forecast, by Bond Type 2020 & 2033
- Table 100: Global Capital Exchange Ecosystem Market Volume Trillion Forecast, by Bond Type 2020 & 2033
- Table 101: Global Capital Exchange Ecosystem Market Revenue Million Forecast, by Country 2020 & 2033
- Table 102: Global Capital Exchange Ecosystem Market Volume Trillion Forecast, by Country 2020 & 2033
- Table 103: China Capital Exchange Ecosystem Market Revenue (Million) Forecast, by Application 2020 & 2033
- Table 104: China Capital Exchange Ecosystem Market Volume (Trillion) Forecast, by Application 2020 & 2033
- Table 105: India Capital Exchange Ecosystem Market Revenue (Million) Forecast, by Application 2020 & 2033
- Table 106: India Capital Exchange Ecosystem Market Volume (Trillion) Forecast, by Application 2020 & 2033
- Table 107: Japan Capital Exchange Ecosystem Market Revenue (Million) Forecast, by Application 2020 & 2033
- Table 108: Japan Capital Exchange Ecosystem Market Volume (Trillion) Forecast, by Application 2020 & 2033
- Table 109: South Korea Capital Exchange Ecosystem Market Revenue (Million) Forecast, by Application 2020 & 2033
- Table 110: South Korea Capital Exchange Ecosystem Market Volume (Trillion) Forecast, by Application 2020 & 2033
- Table 111: ASEAN Capital Exchange Ecosystem Market Revenue (Million) Forecast, by Application 2020 & 2033
- Table 112: ASEAN Capital Exchange Ecosystem Market Volume (Trillion) Forecast, by Application 2020 & 2033
- Table 113: Oceania Capital Exchange Ecosystem Market Revenue (Million) Forecast, by Application 2020 & 2033
- Table 114: Oceania Capital Exchange Ecosystem Market Volume (Trillion) Forecast, by Application 2020 & 2033
- Table 115: Rest of Asia Pacific Capital Exchange Ecosystem Market Revenue (Million) Forecast, by Application 2020 & 2033
- Table 116: Rest of Asia Pacific Capital Exchange Ecosystem Market Volume (Trillion) Forecast, by Application 2020 & 2033
Frequently Asked Questions
1. What is the projected Compound Annual Growth Rate (CAGR) of the Capital Exchange Ecosystem Market?
The projected CAGR is approximately 5.80%.
2. Which companies are prominent players in the Capital Exchange Ecosystem Market?
Key companies in the market include New York Stock Exchange, Japan Exchange Group, London Stock Exchange, HongKong Stock Exchange, Shanghai Stock Exchange, National Stock Exchange, EURONEXT, NASDAQ, Bombay Stock Exchange, Saudi Stock Exchange**List Not Exhaustive.
3. What are the main segments of the Capital Exchange Ecosystem Market?
The market segments include Market Composition, Capital Market, Stock Type, Bond Type.
4. Can you provide details about the market size?
The market size is estimated to be USD 1.06 Million as of 2022.
5. What are some drivers contributing to market growth?
Automating all processes; Regulatory Landscape.
6. What are the notable trends driving market growth?
Increasing Stock Exchanges Index affecting Capital Market Exchange Ecosystem.
7. Are there any restraints impacting market growth?
Automating all processes; Regulatory Landscape.
8. Can you provide examples of recent developments in the market?
In December 2023, Defiance ETFs, introduced the Defiance Israel Bond ETF (NYSE Arca: CHAI) to facilitate investors' access to the Israeli bond market. CHAI commenced trading on the New York Stock Exchange. The ETF, CHAI, mirrors the MCM (Migdal Capital Markets) BlueStar Israel Bond Index, enabling investors to tap into both Israel government and corporate bonds. This index specifically monitors the performance of bonds, denominated in USD and shekels, issued by either the Israeli government or Israeli corporations.
9. What pricing options are available for accessing the report?
Pricing options include single-user, multi-user, and enterprise licenses priced at USD 3800, USD 4500, and USD 5800 respectively.
10. Is the market size provided in terms of value or volume?
The market size is provided in terms of value, measured in Million and volume, measured in Trillion.
11. Are there any specific market keywords associated with the report?
Yes, the market keyword associated with the report is "Capital Exchange Ecosystem Market," which aids in identifying and referencing the specific market segment covered.
12. How do I determine which pricing option suits my needs best?
The pricing options vary based on user requirements and access needs. Individual users may opt for single-user licenses, while businesses requiring broader access may choose multi-user or enterprise licenses for cost-effective access to the report.
13. Are there any additional resources or data provided in the Capital Exchange Ecosystem Market report?
While the report offers comprehensive insights, it's advisable to review the specific contents or supplementary materials provided to ascertain if additional resources or data are available.
14. How can I stay updated on further developments or reports in the Capital Exchange Ecosystem Market?
To stay informed about further developments, trends, and reports in the Capital Exchange Ecosystem Market, consider subscribing to industry newsletters, following relevant companies and organizations, or regularly checking reputable industry news sources and publications.
Methodology
Step 1 - Identification of Relevant Samples Size from Population Database


Step 2 - Approaches for Defining Global Market Size (Value, Volume* & Price*)

Note*: In applicable scenarios
Step 3 - Data Sources
Primary Research
- Web Analytics
- Survey Reports
- Research Institute
- Latest Research Reports
- Opinion Leaders
Secondary Research
- Annual Reports
- White Paper
- Latest Press Release
- Industry Association
- Paid Database
- Investor Presentations

Step 4 - Data Triangulation
Involves using different sources of information in order to increase the validity of a study
These sources are likely to be stakeholders in a program - participants, other researchers, program staff, other community members, and so on.
Then we put all data in single framework & apply various statistical tools to find out the dynamic on the market.
During the analysis stage, feedback from the stakeholder groups would be compared to determine areas of agreement as well as areas of divergence