

Key Insights
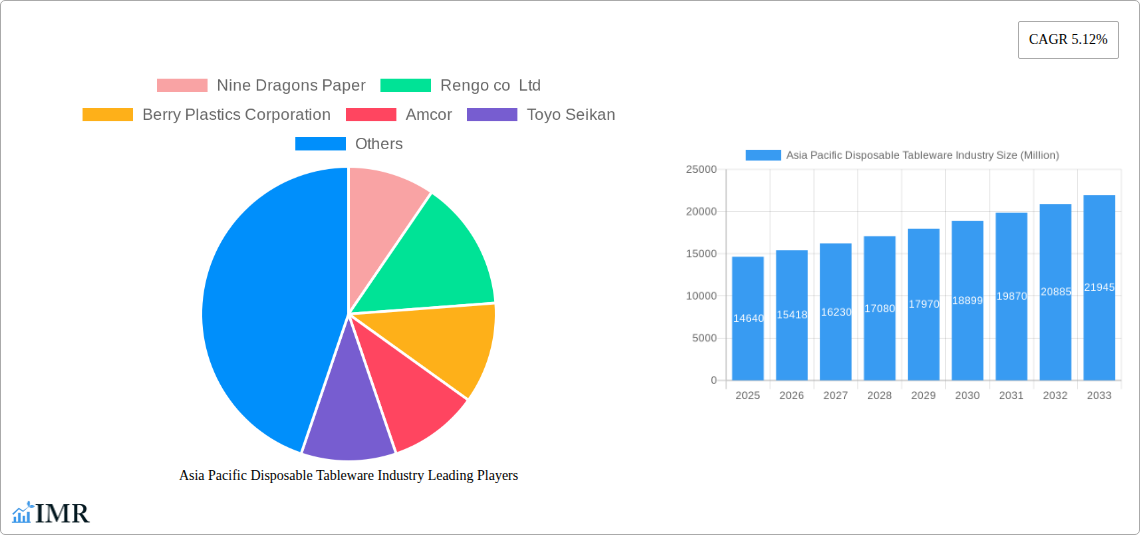
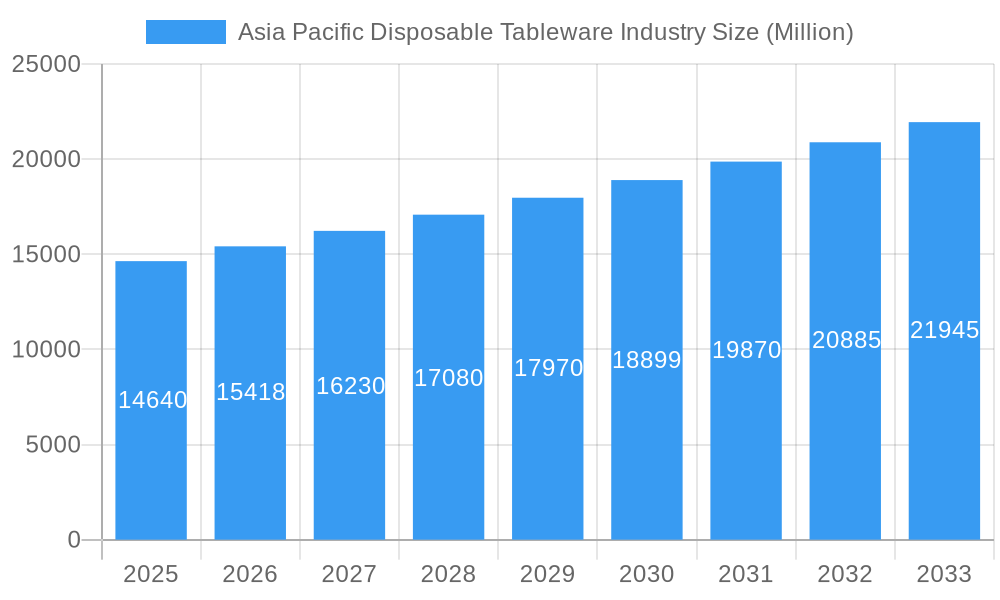
The Asia Pacific disposable tableware market, valued at $14.64 billion in 2025, is projected to experience robust growth, driven by rising urbanization, increasing disposable incomes, and the burgeoning food delivery and takeaway sectors. Convenience and hygiene concerns, particularly post-pandemic, significantly boost demand for single-use tableware. The market is segmented by product type (disposable cups, plates, bowls, silverware, and others), application (residential and commercial), and distribution channel (hypermarkets, convenience stores, online, and others). China, Japan, India, and South Korea are key contributors to regional growth, reflecting their large populations and expanding middle classes. Growth is further fueled by the proliferation of quick-service restaurants (QSRs) and the increasing popularity of outdoor events and festivals, where disposable tableware is essential. However, environmental concerns surrounding plastic waste and rising raw material costs pose significant challenges. The shift towards eco-friendly alternatives, such as biodegradable and compostable tableware, presents both a challenge and an opportunity for market players. Innovation in materials and product design, focusing on sustainability and convenience, will be crucial for driving future growth. Expanding e-commerce channels offer further growth prospects, while established players will need to adapt their strategies to maintain competitiveness in this dynamic market.
Asia Pacific Disposable Tableware Industry Market Size (In Billion)
The projected Compound Annual Growth Rate (CAGR) of 5.12% from 2025 to 2033 suggests a significant expansion in market size. This growth will likely be uneven across segments, with the demand for eco-friendly options accelerating faster than traditional plastic tableware. Competitive pressures will necessitate strategic partnerships, mergers and acquisitions, and a strong focus on efficient supply chains. Companies must balance consumer demand for affordability and convenience with increasing societal pressure to adopt sustainable practices. Regional differences in consumer preferences and regulations will also significantly influence market development, requiring tailored approaches for effective market penetration. The continued rise of online retail channels will continue to reshape the distribution landscape, impacting logistics and marketing strategies for industry participants.
Asia Pacific Disposable Tableware Industry Company Market Share
Asia Pacific Disposable Tableware Industry: Market Report 2019-2033
This comprehensive report provides an in-depth analysis of the Asia Pacific disposable tableware market, encompassing market dynamics, growth trends, key players, and future outlook. The report covers the period from 2019 to 2033, with a focus on the estimated year 2025 and a forecast period of 2025-2033. This detailed study is essential for industry professionals, investors, and businesses seeking to navigate this dynamic market. We analyze parent markets (packaging) and child markets (specific disposable tableware items) to provide a complete view of the industry's potential.
Asia Pacific Disposable Tableware Industry Market Dynamics & Structure
The Asia Pacific disposable tableware market is characterized by a moderately concentrated landscape with several key players vying for market share. Technological innovation, particularly in sustainable materials and manufacturing processes, is a significant driver. Stringent regulatory frameworks concerning environmental concerns, particularly regarding plastic waste, are shaping industry practices. Competitive pressures from reusable tableware alternatives and other biodegradable options are influencing market trends. End-user demographics, with growing populations and changing consumption habits, strongly influence demand. Mergers and acquisitions (M&A) activity reflects the strategic positioning and expansion strategies of major players.
- Market Concentration: Moderately concentrated, with top 10 players holding xx% market share in 2024 (estimated).
- Technological Innovation: Focus on biodegradable and compostable materials, automation in manufacturing.
- Regulatory Framework: Increasingly stringent regulations on plastic waste impacting material choices.
- Competitive Substitutes: Reusable tableware, alternative biodegradable materials creating competition.
- End-User Demographics: Rising populations and changing lifestyles fuel demand, particularly in urban areas.
- M&A Activity: xx major M&A deals recorded between 2019 and 2024, totaling an estimated value of xx Million USD. (Note: Specific deal values are not publicly available for all transactions and are thus estimated).
Asia Pacific Disposable Tableware Industry Growth Trends & Insights
The Asia Pacific disposable tableware market has demonstrated remarkable growth from 2019 to 2024, propelled by escalating disposable incomes, rapid urbanization, and the inherent convenience offered by disposable products. This upward trajectory is anticipated to persist throughout the forecast period (2025-2033), though at a more measured pace. This moderation is largely attributed to mounting environmental concerns and a significant shift in consumer consciousness towards eco-friendly alternatives. Technological innovations focused on sustainable materials and enhanced manufacturing efficiencies are poised to be pivotal in shaping market dynamics. Furthermore, evolving consumer preferences for healthier and more sustainable choices will profoundly influence product development, innovation, and strategic marketing initiatives within the industry.
- Market Size Evolution: The market size expanded from approximately [Insert Specific Figure] Million units in 2019 to an estimated [Insert Specific Figure] Million units in 2024, exhibiting a Compound Annual Growth Rate (CAGR) of [Insert Specific CAGR]%.
- Adoption Rates: While already exhibiting high adoption rates within the commercial sector (including food service establishments and catering), there is a noticeable and increasing trend of adoption in residential settings as well.
- Technological Disruptions: The landscape is being significantly disrupted by the escalating popularity and adoption of biodegradable and compostable materials, presenting a compelling alternative to traditional plastic-based products.
- Consumer Behavior Shifts: A pronounced and growing preference for eco-friendly and sustainable disposable options is a key driver, directly influencing the demand for innovative alternative materials and responsible production methods.
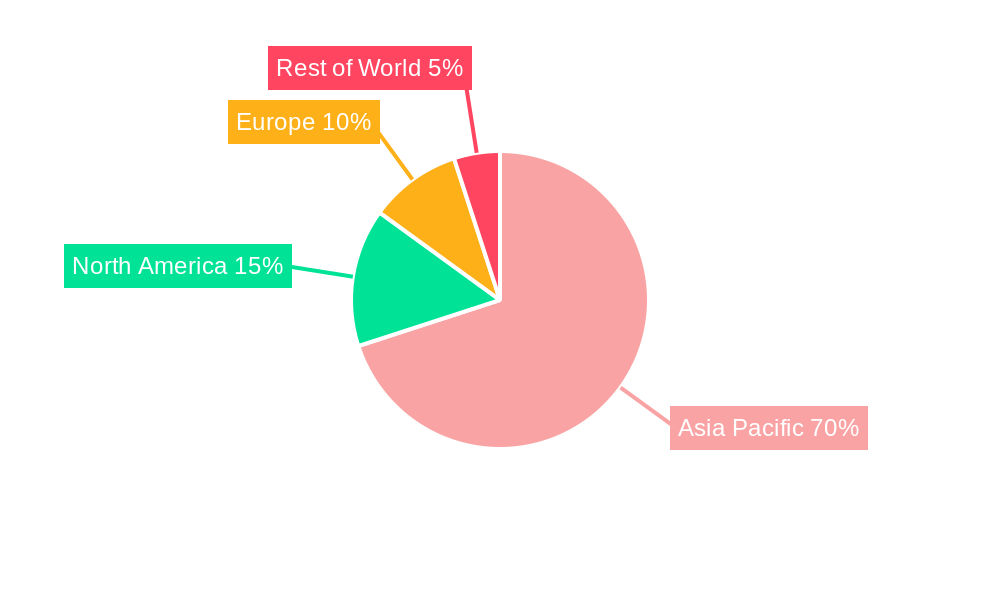
Dominant Regions, Countries, or Segments in Asia Pacific Disposable Tableware Industry
Within the vast Asia Pacific geographical expanse, China, India, and Japan stand out as the leading markets for disposable tableware. This dominance is primarily attributed to their substantial populations, accelerating urbanization trends, and highly dynamic food service sectors. When segmented by product type, disposable cups and plates consistently command the largest market share, reflecting their widespread daily use. In terms of application, the commercial sector, encompassing restaurants, cafes, and catering services, is the predominant segment. Hypermarkets and supermarkets continue to be the primary distribution channels for these products.
-
Leading Regions: China, India, Japan
- Key Drivers (China): Rapid economic expansion, a burgeoning food service industry, and a massive consumer base are the principal engines of growth.
- Key Drivers (India): Rising disposable incomes, rapid urbanization, and an increasing consumption of convenience foods and ready-to-eat meals are fueling demand.
- Key Drivers (Japan): A well-established and sophisticated food service sector, coupled with a historical consumer preference for disposable and convenient products, underpins its strong market position.
-
Leading Segments:
- By Product Type: Disposable Cups and Disposable Plates are the dominant categories, estimated to hold [Insert Specific Percentage]% and [Insert Specific Percentage]% of the market share, respectively, in 2024.
- By Application: The Commercial sector, which includes restaurants, cafes, banqueting services, and institutional catering, represents the largest application segment.
- By Distribution Channel: Hypermarkets and Supermarkets remain the principal distribution channels, estimated to account for approximately [Insert Specific Percentage]% of the market share in 2024.
Asia Pacific Disposable Tableware Industry Product Landscape
The Asia Pacific disposable tableware market is witnessing an evolution towards sustainable and innovative products. Manufacturers are increasingly adopting biodegradable and compostable materials, such as bagasse, bamboo, and PLA, to cater to growing environmental concerns. Focus on improved designs, enhanced functionality, and aesthetically pleasing products is also evident. The introduction of microwavable and freezer-safe options expands product application.
Key Drivers, Barriers & Challenges in Asia Pacific Disposable Tableware Industry
Key Drivers:
- Continued and accelerating urbanization and a steady rise in disposable incomes across the region.
- The robust and expanding food service and hospitality industry, which relies heavily on disposable tableware for efficiency and hygiene.
- A pervasive and growing consumer preference for convenience and assured hygiene, particularly in on-the-go consumption scenarios.
Key Challenges:
- Increasingly stringent environmental regulations and growing public concern over plastic waste, which are projected to lead to an estimated [Insert Specific Percentage]% reduction in the production of traditional plastic-based disposable tableware by 2030.
- Volatility in raw material prices; for instance, some key raw materials have experienced an estimated price increase of [Insert Specific Percentage]% since 2019, impacting production costs.
- Intense market competition characterized by the presence of established global players and a growing number of agile new entrants, leading to price pressures.
Emerging Opportunities in Asia Pacific Disposable Tableware Industry
- A significant and growing demand for eco-friendly, compostable, and biodegradable disposable tableware solutions that align with sustainability goals.
- The rapid expansion of e-commerce channels, offering new avenues for market penetration and direct-to-consumer sales, especially for niche and sustainable products.
- The escalating popularity of food delivery and home dining services, which directly translates into increased demand for convenient and disposable tableware.
Growth Accelerators in the Asia Pacific Disposable Tableware Industry Industry
Technological advancements in sustainable materials, coupled with strategic partnerships and mergers & acquisitions, are key catalysts for long-term growth. Expanding into untapped markets within the Asia Pacific region and adopting innovative marketing and distribution strategies will further drive market expansion.
Key Players Shaping the Asia Pacific Disposable Tableware Industry Market
- Nine Dragons Paper Holdings Limited
- Rengo Co., Ltd.
- Berry Global Group, Inc. (formerly Berry Plastics Corporation)
- Amcor plc
- Toyo Seikan Group Holdings, Ltd.
- Nippon Paper Industries, Ltd.
- Mondi Group
- Guangdong Huasheng Meto Packaging Co., Ltd.
- Oji Holdings Corporation
- Sonoco Products Company
- Taizhou Fuling Plastics Co., Ltd. (This list is not exhaustive and represents some of the prominent players in the market.)
Notable Milestones in Asia Pacific Disposable Tableware Industry Sector
- February 2022: Nippon Paper Industries collaborated with Elopak Paper Industries to expand liquid-paper packaging in the Asia-Pacific region.
- September 2021: Oji Holding Corporation acquired an 80% stake in Empire Packages Private Limited, expanding its market share in India, Bangladesh, and Nepal.
In-Depth Asia Pacific Disposable Tableware Industry Market Outlook
The Asia Pacific disposable tableware market is poised for continued growth, albeit at a more sustainable pace. The shift toward eco-friendly materials and the increasing adoption of innovative packaging solutions will shape market dynamics. Strategic partnerships, expansion into emerging markets, and a focus on customized solutions will be crucial for success in this competitive landscape. The market is expected to reach xx Million units by 2033.
Asia Pacific Disposable Tableware Industry Segmentation
- 1. Production Analysis
- 2. Consumption Analysis
- 3. Import Market Analysis (Value & Volume)
- 4. Export Market Analysis (Value & Volume)
- 5. Price Trend Analysis
Asia Pacific Disposable Tableware Industry Segmentation By Geography
-
1. Asia Pacific
- 1.1. China
- 1.2. Japan
- 1.3. South Korea
- 1.4. India
- 1.5. Australia
- 1.6. New Zealand
- 1.7. Indonesia
- 1.8. Malaysia
- 1.9. Singapore
- 1.10. Thailand
- 1.11. Vietnam
- 1.12. Philippines
Asia Pacific Disposable Tableware Industry Regional Market Share
Geographic Coverage of Asia Pacific Disposable Tableware Industry
Asia Pacific Disposable Tableware Industry REPORT HIGHLIGHTS
| Aspects | Details |
|---|---|
| Study Period | 2020-2034 |
| Base Year | 2025 |
| Estimated Year | 2026 |
| Forecast Period | 2026-2034 |
| Historical Period | 2020-2025 |
| Growth Rate | CAGR of 5.12% from 2020-2034 |
| Segmentation |
|
Table of Contents
- 1. Introduction
- 1.1. Research Scope
- 1.2. Market Segmentation
- 1.3. Research Objective
- 1.4. Definitions and Assumptions
- 2. Executive Summary
- 2.1. Market Snapshot
- 3. Market Dynamics
- 3.1. Market Drivers
- 3.2. Market Restrains
- 3.3. Market Trends
- 3.4. Market Opportunities
- 4. Market Factor Analysis
- 4.1. Porters Five Forces
- 4.1.1. Bargaining Power of Suppliers
- 4.1.2. Bargaining Power of Buyers
- 4.1.3. Threat of New Entrants
- 4.1.4. Threat of Substitutes
- 4.1.5. Competitive Rivalry
- 4.2. PESTEL analysis
- 4.3. BCG Analysis
- 4.3.1. Stars (High Growth, High Market Share)
- 4.3.2. Cash Cows (Low Growth, High Market Share)
- 4.3.3. Question Mark (High Growth, Low Market Share)
- 4.3.4. Dogs (Low Growth, Low Market Share)
- 4.4. Ansoff Matrix Analysis
- 4.5. Supply Chain Analysis
- 4.6. Regulatory Landscape
- 4.7. Current Market Potential and Opportunity Assessment (TAM–SAM–SOM Framework)
- 4.8. IMR Analyst Note
- 4.1. Porters Five Forces
- 5. Market Analysis, Insights and Forecast 2021-2033
- 5.1. Market Analysis, Insights and Forecast - by Production Analysis
- 5.2. Market Analysis, Insights and Forecast - by Consumption Analysis
- 5.3. Market Analysis, Insights and Forecast - by Import Market Analysis (Value & Volume)
- 5.4. Market Analysis, Insights and Forecast - by Export Market Analysis (Value & Volume)
- 5.5. Market Analysis, Insights and Forecast - by Price Trend Analysis
- 5.6. Market Analysis, Insights and Forecast - by Region
- 5.6.1. Asia Pacific
- 6. Asia Pacific Disposable Tableware Industry Analysis, Insights and Forecast, 2021-2033
- 6.1. Market Analysis, Insights and Forecast - by Production Analysis
- 6.2. Market Analysis, Insights and Forecast - by Consumption Analysis
- 6.3. Market Analysis, Insights and Forecast - by Import Market Analysis (Value & Volume)
- 6.4. Market Analysis, Insights and Forecast - by Export Market Analysis (Value & Volume)
- 6.5. Market Analysis, Insights and Forecast - by Price Trend Analysis
- 7. Competitive Analysis
- 7.1. Company Profiles
- 7.1.1 Nine Dragons Paper
- 7.1.1.1. Company Overview
- 7.1.1.2. Products
- 7.1.1.3. Company Financials
- 7.1.1.4. SWOT Analysis
- 7.1.2 Rengo co Ltd
- 7.1.2.1. Company Overview
- 7.1.2.2. Products
- 7.1.2.3. Company Financials
- 7.1.2.4. SWOT Analysis
- 7.1.3 Berry Plastics Corporation
- 7.1.3.1. Company Overview
- 7.1.3.2. Products
- 7.1.3.3. Company Financials
- 7.1.3.4. SWOT Analysis
- 7.1.4 Amcor
- 7.1.4.1. Company Overview
- 7.1.4.2. Products
- 7.1.4.3. Company Financials
- 7.1.4.4. SWOT Analysis
- 7.1.5 Toyo Seikan
- 7.1.5.1. Company Overview
- 7.1.5.2. Products
- 7.1.5.3. Company Financials
- 7.1.5.4. SWOT Analysis
- 7.1.6 Nippon Paper
- 7.1.6.1. Company Overview
- 7.1.6.2. Products
- 7.1.6.3. Company Financials
- 7.1.6.4. SWOT Analysis
- 7.1.7 Mondi Group
- 7.1.7.1. Company Overview
- 7.1.7.2. Products
- 7.1.7.3. Company Financials
- 7.1.7.4. SWOT Analysis
- 7.1.8 Guangdong Huasheng Meto
- 7.1.8.1. Company Overview
- 7.1.8.2. Products
- 7.1.8.3. Company Financials
- 7.1.8.4. SWOT Analysis
- 7.1.9 Oji Holdings
- 7.1.9.1. Company Overview
- 7.1.9.2. Products
- 7.1.9.3. Company Financials
- 7.1.9.4. SWOT Analysis
- 7.1.10 Sonoco Products**List Not Exhaustive
- 7.1.10.1. Company Overview
- 7.1.10.2. Products
- 7.1.10.3. Company Financials
- 7.1.10.4. SWOT Analysis
- 7.1.11 Taizhou Fuling Plastics
- 7.1.11.1. Company Overview
- 7.1.11.2. Products
- 7.1.11.3. Company Financials
- 7.1.11.4. SWOT Analysis
- 7.1.1 Nine Dragons Paper
- 7.2. Market Entropy
- 7.2.1 Company's Key Areas Served
- 7.2.2 Recent Developments
- 7.3. Company Market Share Analysis 2025
- 7.3.1 Top 5 Companies Market Share Analysis
- 7.3.2 Top 3 Companies Market Share Analysis
- 7.4. List of Potential Customers
- 8. Research Methodology
List of Figures
- Figure 1: Asia Pacific Disposable Tableware Industry Revenue Breakdown (Million, %) by Product 2025 & 2033
- Figure 2: Asia Pacific Disposable Tableware Industry Share (%) by Company 2025
List of Tables
- Table 1: Asia Pacific Disposable Tableware Industry Revenue Million Forecast, by Production Analysis 2020 & 2033
- Table 2: Asia Pacific Disposable Tableware Industry Revenue Million Forecast, by Consumption Analysis 2020 & 2033
- Table 3: Asia Pacific Disposable Tableware Industry Revenue Million Forecast, by Import Market Analysis (Value & Volume) 2020 & 2033
- Table 4: Asia Pacific Disposable Tableware Industry Revenue Million Forecast, by Export Market Analysis (Value & Volume) 2020 & 2033
- Table 5: Asia Pacific Disposable Tableware Industry Revenue Million Forecast, by Price Trend Analysis 2020 & 2033
- Table 6: Asia Pacific Disposable Tableware Industry Revenue Million Forecast, by Region 2020 & 2033
- Table 7: Asia Pacific Disposable Tableware Industry Revenue Million Forecast, by Production Analysis 2020 & 2033
- Table 8: Asia Pacific Disposable Tableware Industry Revenue Million Forecast, by Consumption Analysis 2020 & 2033
- Table 9: Asia Pacific Disposable Tableware Industry Revenue Million Forecast, by Import Market Analysis (Value & Volume) 2020 & 2033
- Table 10: Asia Pacific Disposable Tableware Industry Revenue Million Forecast, by Export Market Analysis (Value & Volume) 2020 & 2033
- Table 11: Asia Pacific Disposable Tableware Industry Revenue Million Forecast, by Price Trend Analysis 2020 & 2033
- Table 12: Asia Pacific Disposable Tableware Industry Revenue Million Forecast, by Country 2020 & 2033
- Table 13: China Asia Pacific Disposable Tableware Industry Revenue (Million) Forecast, by Application 2020 & 2033
- Table 14: Japan Asia Pacific Disposable Tableware Industry Revenue (Million) Forecast, by Application 2020 & 2033
- Table 15: South Korea Asia Pacific Disposable Tableware Industry Revenue (Million) Forecast, by Application 2020 & 2033
- Table 16: India Asia Pacific Disposable Tableware Industry Revenue (Million) Forecast, by Application 2020 & 2033
- Table 17: Australia Asia Pacific Disposable Tableware Industry Revenue (Million) Forecast, by Application 2020 & 2033
- Table 18: New Zealand Asia Pacific Disposable Tableware Industry Revenue (Million) Forecast, by Application 2020 & 2033
- Table 19: Indonesia Asia Pacific Disposable Tableware Industry Revenue (Million) Forecast, by Application 2020 & 2033
- Table 20: Malaysia Asia Pacific Disposable Tableware Industry Revenue (Million) Forecast, by Application 2020 & 2033
- Table 21: Singapore Asia Pacific Disposable Tableware Industry Revenue (Million) Forecast, by Application 2020 & 2033
- Table 22: Thailand Asia Pacific Disposable Tableware Industry Revenue (Million) Forecast, by Application 2020 & 2033
- Table 23: Vietnam Asia Pacific Disposable Tableware Industry Revenue (Million) Forecast, by Application 2020 & 2033
- Table 24: Philippines Asia Pacific Disposable Tableware Industry Revenue (Million) Forecast, by Application 2020 & 2033
Frequently Asked Questions
1. What is the projected Compound Annual Growth Rate (CAGR) of the Asia Pacific Disposable Tableware Industry?
The projected CAGR is approximately 5.12%.
2. Which companies are prominent players in the Asia Pacific Disposable Tableware Industry?
Key companies in the market include Nine Dragons Paper, Rengo co Ltd, Berry Plastics Corporation, Amcor, Toyo Seikan, Nippon Paper, Mondi Group, Guangdong Huasheng Meto, Oji Holdings, Sonoco Products**List Not Exhaustive, Taizhou Fuling Plastics.
3. What are the main segments of the Asia Pacific Disposable Tableware Industry?
The market segments include Production Analysis, Consumption Analysis, Import Market Analysis (Value & Volume), Export Market Analysis (Value & Volume), Price Trend Analysis.
4. Can you provide details about the market size?
The market size is estimated to be USD 14.64 Million as of 2022.
5. What are some drivers contributing to market growth?
Increasing Construction and Renovation Activities is Driving the Market.
6. What are the notable trends driving market growth?
Increase in the Usage of Disposable Items.
7. Are there any restraints impacting market growth?
Increasing Regulations and Tariffs is Restraining the Market.
8. Can you provide examples of recent developments in the market?
In February 2022, Nippon Paper Industries collaborated with Elopak Paper Industries to collectively put efforts in the field of Liquid- Paper Packaging and to expand the market size in Asia - Pacific region.
9. What pricing options are available for accessing the report?
Pricing options include single-user, multi-user, and enterprise licenses priced at USD 4750, USD 5250, and USD 8750 respectively.
10. Is the market size provided in terms of value or volume?
The market size is provided in terms of value, measured in Million.
11. Are there any specific market keywords associated with the report?
Yes, the market keyword associated with the report is "Asia Pacific Disposable Tableware Industry," which aids in identifying and referencing the specific market segment covered.
12. How do I determine which pricing option suits my needs best?
The pricing options vary based on user requirements and access needs. Individual users may opt for single-user licenses, while businesses requiring broader access may choose multi-user or enterprise licenses for cost-effective access to the report.
13. Are there any additional resources or data provided in the Asia Pacific Disposable Tableware Industry report?
While the report offers comprehensive insights, it's advisable to review the specific contents or supplementary materials provided to ascertain if additional resources or data are available.
14. How can I stay updated on further developments or reports in the Asia Pacific Disposable Tableware Industry?
To stay informed about further developments, trends, and reports in the Asia Pacific Disposable Tableware Industry, consider subscribing to industry newsletters, following relevant companies and organizations, or regularly checking reputable industry news sources and publications.
Methodology
Step 1 - Identification of Relevant Samples Size from Population Database


Step 2 - Approaches for Defining Global Market Size (Value, Volume* & Price*)

Note*: In applicable scenarios
Step 3 - Data Sources
Primary Research
- Web Analytics
- Survey Reports
- Research Institute
- Latest Research Reports
- Opinion Leaders
Secondary Research
- Annual Reports
- White Paper
- Latest Press Release
- Industry Association
- Paid Database
- Investor Presentations

Step 4 - Data Triangulation
Involves using different sources of information in order to increase the validity of a study
These sources are likely to be stakeholders in a program - participants, other researchers, program staff, other community members, and so on.
Then we put all data in single framework & apply various statistical tools to find out the dynamic on the market.
During the analysis stage, feedback from the stakeholder groups would be compared to determine areas of agreement as well as areas of divergence