

Key Insights
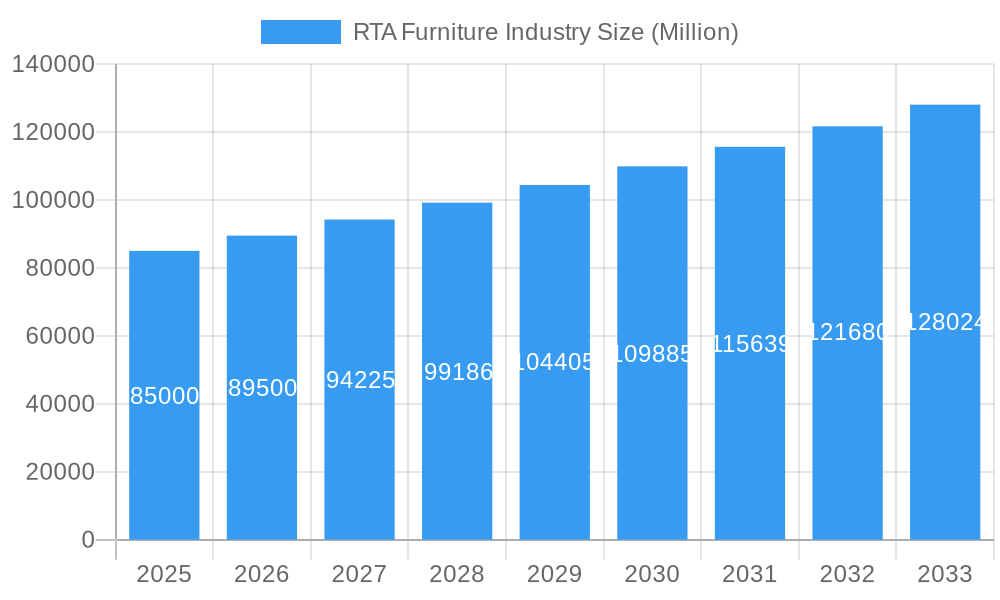
The Ready-to-Assemble (RTA) Furniture Market is projected for significant expansion, anticipated to reach a market size of $18,353.4 million by 2025, with a Compound Annual Growth Rate (CAGR) of 7.3% from 2025 to 2033. This growth is driven by the rising demand for affordable, space-saving furniture solutions among urban populations and millennials. Enhanced e-commerce penetration, offering convenient online purchasing, and broad distribution across specialty retailers, home centers, and online platforms are further propelling market growth. Continuous innovation in aesthetic, functional, and easily assembled RTA furniture designs also broadens consumer appeal.
RTA Furniture Industry Market Size (In Billion)
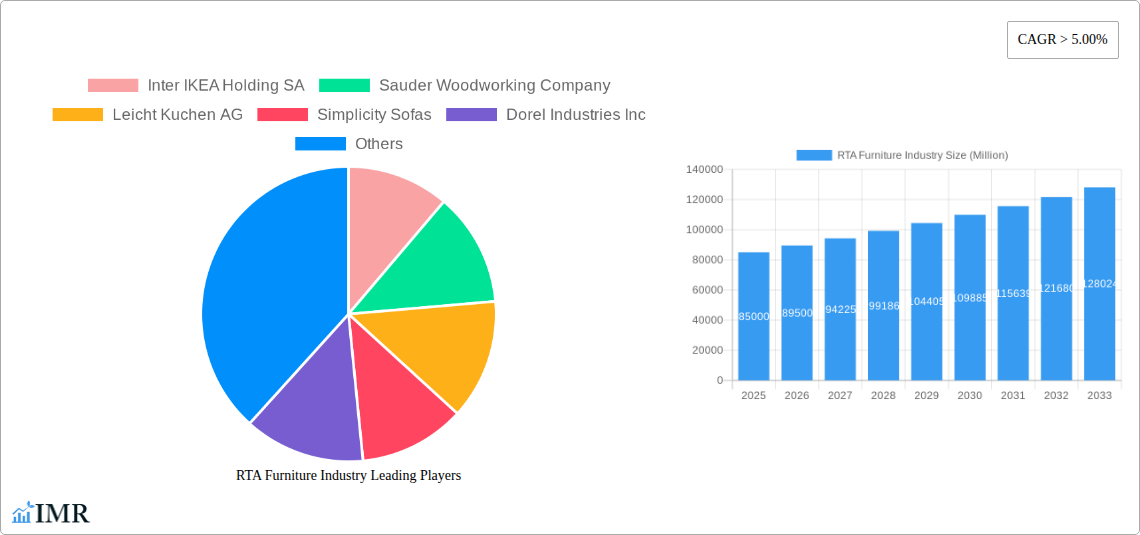
Key market trends include the increasing adoption of sustainable RTA furniture made from recycled materials and eco-conscious manufacturing. Smart furniture integration, featuring built-in charging and adaptable designs, is also an emerging trend. Potential restraints include supply chain volatility and rising raw material costs, though the inherent cost-effectiveness and versatility of RTA furniture are expected to mitigate these challenges. The market is segmented by product type (tables, chairs, sofas, storage, beds) and end-use (residential, commercial). Leading players such as Inter IKEA Holding SA, Sauder Woodworking Company, and Dorel Industries Inc. hold significant market share, particularly in North America and Europe.
RTA Furniture Industry Company Market Share
Discover comprehensive RTA Furniture Industry analysis, including market size, growth projections, and forecasts.
RTA Furniture Industry Market Dynamics & Structure
The global Ready-to-Assemble (RTA) furniture market is characterized by a medium to high concentration driven by the strategic dominance of a few key players and the increasing influence of online retail channels. Technological innovation, particularly in material science and manufacturing automation, is a significant driver, enabling the production of more durable and aesthetically pleasing RTA options. Evolving regulatory frameworks, focused on sustainability and product safety, are shaping manufacturing processes and material sourcing. Competitive substitutes, including fully assembled furniture and DIY kits, continue to exist but are increasingly challenged by RTA's convenience and cost-effectiveness. End-user demographics are shifting, with a growing segment of millennials and Gen Z consumers prioritizing flexibility, affordability, and personalization, all of which RTA furniture excels at providing. Mergers and acquisitions (M&A) are playing a crucial role in market consolidation and expansion, with XX number of significant deals recorded in the historical period, indicating a trend towards vertical integration and the acquisition of innovative technologies.
- Market Concentration: Dominated by a few large corporations, with a growing number of smaller players specializing in niche segments.
- Technological Innovation: Focus on sustainable materials, advanced manufacturing techniques, and enhanced product design for easier assembly.
- Regulatory Impact: Increasing emphasis on eco-friendly practices, formaldehyde emissions reduction, and child safety standards.
- Competitive Landscape: RTA furniture competes with traditional assembled furniture, custom-made pieces, and DIY solutions, with convenience and price as key differentiators.
- End-User Demographics: Strong appeal to younger, urban populations seeking value, style, and ease of relocation.
- M&A Trends: Strategic acquisitions to gain market share, acquire new technologies, and expand product portfolios.
RTA Furniture Industry Growth Trends & Insights
The RTA furniture industry is poised for robust growth, with an estimated market size of $XX billion in the base year 2025, projected to reach $XX billion by 2033. This represents a compound annual growth rate (CAGR) of XX% during the forecast period of 2025–2033. The historical period (2019–2024) saw steady expansion, driven by increasing consumer adoption of online shopping and a growing demand for affordable, stylish home furnishings. Technological disruptions, such as the advent of augmented reality (AR) for virtual furniture placement and advanced flat-pack designs, are accelerating this growth by enhancing the customer experience and simplifying assembly. Consumer behavior shifts are profoundly impacting the market, with a greater emphasis on sustainability, customization, and space-saving solutions. The rise of smaller living spaces, particularly in urban areas, fuels the demand for compact and multi-functional RTA furniture. Furthermore, the growing popularity of e-commerce platforms has democratized access to a wider variety of RTA furniture options, driving increased market penetration. The shift towards a circular economy is also influencing product development, with manufacturers focusing on modular designs and recyclable materials. The parent market, encompassing all furniture, is experiencing a similar upward trajectory, but the RTA segment is outperforming due to its inherent advantages in logistics, cost, and adaptability. The child market, specifically focusing on smaller, more specialized RTA product categories like home office solutions and modular storage, is exhibiting even higher growth rates as consumers adapt to evolving lifestyle needs. The increasing comfort and familiarity with online purchasing for larger items are key adoption rate drivers, moving the market beyond early adopters.
Dominant Regions, Countries, or Segments in RTA Furniture Industry
North America, particularly the United States, currently stands as the dominant region in the RTA furniture industry, driven by a strong existing market for home furnishings and a robust e-commerce infrastructure. The Online distribution channel is a significant growth engine within North America, capturing an estimated XX% market share in 2025. This dominance is fueled by the convenience, wide selection, and competitive pricing offered through online platforms, catering effectively to the residential end-user segment. The Residential end-user segment is paramount, accounting for approximately XX% of the total market demand. Factors such as increasing homeownership rates, a growing population of renters, and a continuous desire for updated home décor contribute to this overwhelming demand. Within the product segments, Storage solutions, including bookshelves, cabinets, and shelving units, are exhibiting exceptional growth, projected to account for XX% of the market revenue by 2025. This surge is attributed to the persistent need for space optimization in residential and commercial settings, exacerbated by the rise of remote work. Chairs and Sofas also represent a substantial segment, driven by evolving consumer preferences for modularity and ease of assembly for larger furniture items. The Home Centers distribution channel remains a cornerstone, providing a tactile shopping experience and immediate availability, though its growth rate is being outpaced by the online channel. Economic policies promoting home improvement and construction, coupled with robust logistics networks, further solidify North America's leadership. However, regions like Europe and Asia-Pacific are rapidly gaining traction, driven by urbanization, increasing disposable incomes, and the growing adoption of RTA furniture as a cost-effective and stylish alternative. The parent market's established demand provides a strong foundation, while specific country-level economic policies and consumer spending habits directly influence the growth of the RTA child market segments within these dominant regions.
- Dominant Region: North America (specifically the United States).
- Key Distribution Channel: Online, projected to hold XX% market share in 2025.
- Primary End-User: Residential, constituting approximately XX% of market demand.
- High-Growth Product Segment: Storage solutions, expected to reach XX% of market revenue in 2025.
- Growth Drivers: E-commerce infrastructure, consumer demand for affordability and style, space-saving needs, economic policies supporting home improvement.
- Emerging Regions: Europe and Asia-Pacific are showing significant growth potential.
RTA Furniture Industry Product Landscape
The RTA furniture product landscape is continuously evolving with a focus on enhanced functionality, aesthetic appeal, and simplified assembly. Tables, including dining tables, coffee tables, and desks, are increasingly designed with modular components for easy setup and disassembly, often incorporating sustainable materials like bamboo and recycled wood. Chairs and Sofas are seeing innovations in material science for improved comfort and durability, with many offering customizable configurations and integrated storage. The Storage segment, encompassing bookshelves, cabinets, and modular shelving systems, is a prime area for innovation, addressing the growing need for space optimization in modern living. Beds, from simple frames to platform beds with integrated drawers, are also embracing RTA principles for convenient delivery and assembly. The Other Products category is diverse, including entertainment units, home office furniture, and outdoor RTA solutions, each showcasing unique selling propositions centered around ease of use and adaptability. Technological advancements in design software and manufacturing processes enable intricate yet user-friendly assembly instructions and precision-engineered components, contributing to a superior end-user experience.
Key Drivers, Barriers & Challenges in RTA Furniture Industry
Key Drivers:
- Affordability and Value: RTA furniture offers a cost-effective alternative to fully assembled pieces, appealing to budget-conscious consumers.
- Convenience and Ease of Assembly: Simplified instructions and interlocking parts make assembly accessible to a broader demographic.
- E-commerce Growth: The expansion of online retail channels provides wider accessibility and a vast selection.
- Urbanization and Smaller Living Spaces: Demand for space-saving and multi-functional furniture is rising.
- Sustainability Focus: Growing consumer preference for eco-friendly materials and manufacturing processes.
- Modularity and Customization: Ability to adapt furniture to specific needs and spaces.
Barriers & Challenges:
- Perception of Quality and Durability: Some consumers still associate RTA with lower quality.
- Assembly Effort and Potential Frustration: Despite improvements, some assembly can still be challenging for certain individuals.
- Supply Chain Disruptions: Global logistics and material availability can impact production and delivery times.
- Intense Competition: A crowded market with numerous players, including private labels and large retailers.
- Design Limitations: While improving, some complex or highly ornate designs are difficult to achieve in RTA format.
- Regulatory Compliance: Adhering to evolving safety and environmental standards across different regions.
Emerging Opportunities in RTA Furniture Industry
Emerging opportunities within the RTA furniture industry lie in the burgeoning demand for smart furniture solutions that integrate technology for enhanced functionality, such as built-in charging ports and adjustable lighting. The circular economy presents a significant avenue, with the development of furniture made from fully recyclable or biodegradable materials, and the exploration of take-back programs. Customization platforms that allow consumers to design their own RTA furniture online, offering a personalized experience, are poised for growth. Furthermore, the commercial segment, including co-working spaces, hospitality, and small businesses, is increasingly recognizing the cost and logistical benefits of RTA solutions. Tapping into the DIY and maker culture through premium RTA kits with advanced design elements also presents a niche opportunity.
Growth Accelerators in the RTA Furniture Industry Industry
Several growth accelerators are propelling the RTA furniture industry forward. Technological breakthroughs in material science, leading to lighter, stronger, and more sustainable RTA components, are key. Strategic partnerships between furniture manufacturers and e-commerce giants are expanding market reach and consumer access. Market expansion strategies, particularly targeting emerging economies with growing middle classes and increasing urbanization, offer significant untapped potential. The continuous innovation in flat-pack design and assembly technologies, making the process even more intuitive and user-friendly, is a constant driver of consumer adoption. Finally, the growing acceptance and demand for sustainable and ethically sourced products are pushing manufacturers to invest in greener production methods, further enhancing brand appeal and market penetration.
Key Players Shaping the RTA Furniture Industry Market
- Inter IKEA Holding SA
- Sauder Woodworking Company
- Leicht Kuchen AG
- Simplicity Sofas
- Dorel Industries Inc
- Bush Industries Inc
- Flexsteel (Home Styles)
- Other Key Players (Prepac Manufacturing Ltd, Venture Horizon Corporation, Nolte Group, Wellemobel GmbH, Tvilum, Alno Group, Walker Edison Furniture Company LLC, and others)
- Steinhoff Holding
- South Shore Furniture
- Whalen Furniture Manufacturing
Notable Milestones in RTA Furniture Industry Sector
- 2019: Increased focus on sustainable materials and eco-friendly manufacturing processes by major RTA brands.
- 2020: Surge in demand for home office RTA furniture due to the global shift to remote work.
- 2021: Expansion of AR-powered visualization tools by RTA retailers to enhance online shopping experience.
- 2022: Introduction of modular RTA furniture systems offering greater flexibility and customization.
- 2023: Significant investments in supply chain resilience and automation for RTA furniture production.
- 2024: Growing adoption of advanced, user-friendly assembly instructions, including video guides and QR code integration.
In-Depth RTA Furniture Industry Market Outlook
The future outlook for the RTA furniture industry remains exceptionally bright, fueled by a confluence of enduring trends and emerging innovations. The continued expansion of e-commerce, coupled with an ever-increasing consumer preference for convenience and affordability, will sustain robust demand. Growth accelerators such as advancements in material science leading to more durable and sustainable products, alongside strategic market expansion into developing economies, will further bolster industry growth. The increasing integration of smart home technology and a focus on modular, customizable solutions will cater to evolving consumer lifestyles and preferences. The RTA furniture market is not merely a segment of the broader furniture industry; it is a dynamic force redefining how consumers furnish their homes and workspaces, offering a compelling blend of style, practicality, and value for years to come.
RTA Furniture Industry Segmentation
-
1. Product
- 1.1. Tables
- 1.2. Chairs and Sofas
- 1.3. Storage
- 1.4. Beds
- 1.5. Other Products
-
2. Distribution Channel
- 2.1. Specialty Retailers
- 2.2. Flagship Stores
- 2.3. Home Centers
- 2.4. Online
- 2.5. Designers
- 2.6. Other Distribution Channels
-
3. End User
- 3.1. Residential
- 3.2. Commercial
RTA Furniture Industry Segmentation By Geography
- 1. North America
- 2. Europe
- 3. Asia Pacific
- 4. Latin America
- 5. Middle East
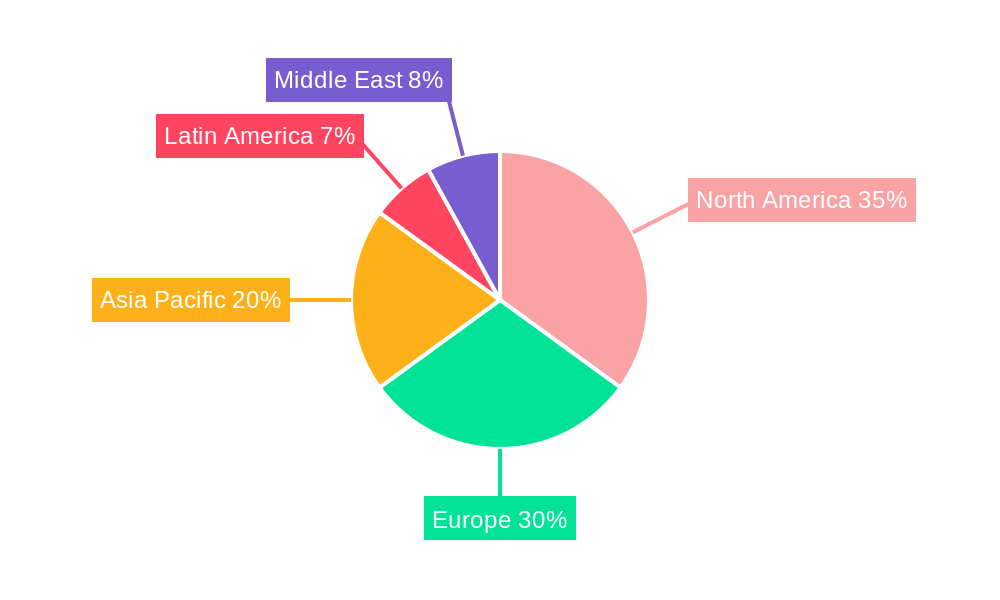
RTA Furniture Industry Regional Market Share
Geographic Coverage of RTA Furniture Industry
RTA Furniture Industry REPORT HIGHLIGHTS
| Aspects | Details |
|---|---|
| Study Period | 2020-2034 |
| Base Year | 2025 |
| Estimated Year | 2026 |
| Forecast Period | 2026-2034 |
| Historical Period | 2020-2025 |
| Growth Rate | CAGR of 7.3% from 2020-2034 |
| Segmentation |
|
Table of Contents
- 1. Introduction
- 1.1. Research Scope
- 1.2. Market Segmentation
- 1.3. Research Objective
- 1.4. Definitions and Assumptions
- 2. Executive Summary
- 2.1. Market Snapshot
- 3. Market Dynamics
- 3.1. Market Drivers
- 3.2. Market Restrains
- 3.3. Market Trends
- 3.4. Market Opportunities
- 4. Market Factor Analysis
- 4.1. Porters Five Forces
- 4.1.1. Bargaining Power of Suppliers
- 4.1.2. Bargaining Power of Buyers
- 4.1.3. Threat of New Entrants
- 4.1.4. Threat of Substitutes
- 4.1.5. Competitive Rivalry
- 4.2. PESTEL analysis
- 4.3. BCG Analysis
- 4.3.1. Stars (High Growth, High Market Share)
- 4.3.2. Cash Cows (Low Growth, High Market Share)
- 4.3.3. Question Mark (High Growth, Low Market Share)
- 4.3.4. Dogs (Low Growth, Low Market Share)
- 4.4. Ansoff Matrix Analysis
- 4.5. Supply Chain Analysis
- 4.6. Regulatory Landscape
- 4.7. Current Market Potential and Opportunity Assessment (TAM–SAM–SOM Framework)
- 4.8. IMR Analyst Note
- 4.1. Porters Five Forces
- 5. Market Analysis, Insights and Forecast 2021-2033
- 5.1. Market Analysis, Insights and Forecast - by Product
- 5.1.1. Tables
- 5.1.2. Chairs and Sofas
- 5.1.3. Storage
- 5.1.4. Beds
- 5.1.5. Other Products
- 5.2. Market Analysis, Insights and Forecast - by Distribution Channel
- 5.2.1. Specialty Retailers
- 5.2.2. Flagship Stores
- 5.2.3. Home Centers
- 5.2.4. Online
- 5.2.5. Designers
- 5.2.6. Other Distribution Channels
- 5.3. Market Analysis, Insights and Forecast - by End User
- 5.3.1. Residential
- 5.3.2. Commercial
- 5.4. Market Analysis, Insights and Forecast - by Region
- 5.4.1. North America
- 5.4.2. Europe
- 5.4.3. Asia Pacific
- 5.4.4. Latin America
- 5.4.5. Middle East
- 5.1. Market Analysis, Insights and Forecast - by Product
- 6. Global RTA Furniture Industry Analysis, Insights and Forecast, 2021-2033
- 6.1. Market Analysis, Insights and Forecast - by Product
- 6.1.1. Tables
- 6.1.2. Chairs and Sofas
- 6.1.3. Storage
- 6.1.4. Beds
- 6.1.5. Other Products
- 6.2. Market Analysis, Insights and Forecast - by Distribution Channel
- 6.2.1. Specialty Retailers
- 6.2.2. Flagship Stores
- 6.2.3. Home Centers
- 6.2.4. Online
- 6.2.5. Designers
- 6.2.6. Other Distribution Channels
- 6.3. Market Analysis, Insights and Forecast - by End User
- 6.3.1. Residential
- 6.3.2. Commercial
- 6.1. Market Analysis, Insights and Forecast - by Product
- 7. North America RTA Furniture Industry Analysis, Insights and Forecast, 2020-2032
- 7.1. Market Analysis, Insights and Forecast - by Product
- 7.1.1. Tables
- 7.1.2. Chairs and Sofas
- 7.1.3. Storage
- 7.1.4. Beds
- 7.1.5. Other Products
- 7.2. Market Analysis, Insights and Forecast - by Distribution Channel
- 7.2.1. Specialty Retailers
- 7.2.2. Flagship Stores
- 7.2.3. Home Centers
- 7.2.4. Online
- 7.2.5. Designers
- 7.2.6. Other Distribution Channels
- 7.3. Market Analysis, Insights and Forecast - by End User
- 7.3.1. Residential
- 7.3.2. Commercial
- 7.1. Market Analysis, Insights and Forecast - by Product
- 8. Europe RTA Furniture Industry Analysis, Insights and Forecast, 2020-2032
- 8.1. Market Analysis, Insights and Forecast - by Product
- 8.1.1. Tables
- 8.1.2. Chairs and Sofas
- 8.1.3. Storage
- 8.1.4. Beds
- 8.1.5. Other Products
- 8.2. Market Analysis, Insights and Forecast - by Distribution Channel
- 8.2.1. Specialty Retailers
- 8.2.2. Flagship Stores
- 8.2.3. Home Centers
- 8.2.4. Online
- 8.2.5. Designers
- 8.2.6. Other Distribution Channels
- 8.3. Market Analysis, Insights and Forecast - by End User
- 8.3.1. Residential
- 8.3.2. Commercial
- 8.1. Market Analysis, Insights and Forecast - by Product
- 9. Asia Pacific RTA Furniture Industry Analysis, Insights and Forecast, 2020-2032
- 9.1. Market Analysis, Insights and Forecast - by Product
- 9.1.1. Tables
- 9.1.2. Chairs and Sofas
- 9.1.3. Storage
- 9.1.4. Beds
- 9.1.5. Other Products
- 9.2. Market Analysis, Insights and Forecast - by Distribution Channel
- 9.2.1. Specialty Retailers
- 9.2.2. Flagship Stores
- 9.2.3. Home Centers
- 9.2.4. Online
- 9.2.5. Designers
- 9.2.6. Other Distribution Channels
- 9.3. Market Analysis, Insights and Forecast - by End User
- 9.3.1. Residential
- 9.3.2. Commercial
- 9.1. Market Analysis, Insights and Forecast - by Product
- 10. Latin America RTA Furniture Industry Analysis, Insights and Forecast, 2020-2032
- 10.1. Market Analysis, Insights and Forecast - by Product
- 10.1.1. Tables
- 10.1.2. Chairs and Sofas
- 10.1.3. Storage
- 10.1.4. Beds
- 10.1.5. Other Products
- 10.2. Market Analysis, Insights and Forecast - by Distribution Channel
- 10.2.1. Specialty Retailers
- 10.2.2. Flagship Stores
- 10.2.3. Home Centers
- 10.2.4. Online
- 10.2.5. Designers
- 10.2.6. Other Distribution Channels
- 10.3. Market Analysis, Insights and Forecast - by End User
- 10.3.1. Residential
- 10.3.2. Commercial
- 10.1. Market Analysis, Insights and Forecast - by Product
- 11. Middle East RTA Furniture Industry Analysis, Insights and Forecast, 2020-2032
- 11.1. Market Analysis, Insights and Forecast - by Product
- 11.1.1. Tables
- 11.1.2. Chairs and Sofas
- 11.1.3. Storage
- 11.1.4. Beds
- 11.1.5. Other Products
- 11.2. Market Analysis, Insights and Forecast - by Distribution Channel
- 11.2.1. Specialty Retailers
- 11.2.2. Flagship Stores
- 11.2.3. Home Centers
- 11.2.4. Online
- 11.2.5. Designers
- 11.2.6. Other Distribution Channels
- 11.3. Market Analysis, Insights and Forecast - by End User
- 11.3.1. Residential
- 11.3.2. Commercial
- 11.1. Market Analysis, Insights and Forecast - by Product
- 12. Competitive Analysis
- 12.1. Company Profiles
- 12.1.1 Inter IKEA Holding SA
- 12.1.1.1. Company Overview
- 12.1.1.2. Products
- 12.1.1.3. Company Financials
- 12.1.1.4. SWOT Analysis
- 12.1.2 Sauder Woodworking Company
- 12.1.2.1. Company Overview
- 12.1.2.2. Products
- 12.1.2.3. Company Financials
- 12.1.2.4. SWOT Analysis
- 12.1.3 Leicht Kuchen AG
- 12.1.3.1. Company Overview
- 12.1.3.2. Products
- 12.1.3.3. Company Financials
- 12.1.3.4. SWOT Analysis
- 12.1.4 Simplicity Sofas
- 12.1.4.1. Company Overview
- 12.1.4.2. Products
- 12.1.4.3. Company Financials
- 12.1.4.4. SWOT Analysis
- 12.1.5 Dorel Industries Inc
- 12.1.5.1. Company Overview
- 12.1.5.2. Products
- 12.1.5.3. Company Financials
- 12.1.5.4. SWOT Analysis
- 12.1.6 Bush Industries Inc
- 12.1.6.1. Company Overview
- 12.1.6.2. Products
- 12.1.6.3. Company Financials
- 12.1.6.4. SWOT Analysis
- 12.1.7 Flexsteel (Home Styles)
- 12.1.7.1. Company Overview
- 12.1.7.2. Products
- 12.1.7.3. Company Financials
- 12.1.7.4. SWOT Analysis
- 12.1.8 Other Key Players (Prepac Manufacturing Ltd Venture Horizon Corporation Nolte Group Wellemobel GmbH Tvilum Alno Group Walker Edison Furniture Company LLC and others)**List Not Exhaustive
- 12.1.8.1. Company Overview
- 12.1.8.2. Products
- 12.1.8.3. Company Financials
- 12.1.8.4. SWOT Analysis
- 12.1.9 Steinhoff Holding
- 12.1.9.1. Company Overview
- 12.1.9.2. Products
- 12.1.9.3. Company Financials
- 12.1.9.4. SWOT Analysis
- 12.1.10 South Shore Furniture
- 12.1.10.1. Company Overview
- 12.1.10.2. Products
- 12.1.10.3. Company Financials
- 12.1.10.4. SWOT Analysis
- 12.1.11 6 COMPETITIVE LANDSCAPE 6 1 MARKET CONCENTRATION OVERVIEW 6 2 COMPANY PROFILES
- 12.1.11.1. Company Overview
- 12.1.11.2. Products
- 12.1.11.3. Company Financials
- 12.1.11.4. SWOT Analysis
- 12.1.12 Whalen Furniture Manufacturing
- 12.1.12.1. Company Overview
- 12.1.12.2. Products
- 12.1.12.3. Company Financials
- 12.1.12.4. SWOT Analysis
- 12.1.1 Inter IKEA Holding SA
- 12.2. Market Entropy
- 12.2.1 Company's Key Areas Served
- 12.2.2 Recent Developments
- 12.3. Company Market Share Analysis 2025
- 12.3.1 Top 5 Companies Market Share Analysis
- 12.3.2 Top 3 Companies Market Share Analysis
- 12.4. List of Potential Customers
- 13. Research Methodology
List of Figures
- Figure 1: Global RTA Furniture Industry Revenue Breakdown (million, %) by Region 2025 & 2033
- Figure 2: North America RTA Furniture Industry Revenue (million), by Product 2025 & 2033
- Figure 3: North America RTA Furniture Industry Revenue Share (%), by Product 2025 & 2033
- Figure 4: North America RTA Furniture Industry Revenue (million), by Distribution Channel 2025 & 2033
- Figure 5: North America RTA Furniture Industry Revenue Share (%), by Distribution Channel 2025 & 2033
- Figure 6: North America RTA Furniture Industry Revenue (million), by End User 2025 & 2033
- Figure 7: North America RTA Furniture Industry Revenue Share (%), by End User 2025 & 2033
- Figure 8: North America RTA Furniture Industry Revenue (million), by Country 2025 & 2033
- Figure 9: North America RTA Furniture Industry Revenue Share (%), by Country 2025 & 2033
- Figure 10: Europe RTA Furniture Industry Revenue (million), by Product 2025 & 2033
- Figure 11: Europe RTA Furniture Industry Revenue Share (%), by Product 2025 & 2033
- Figure 12: Europe RTA Furniture Industry Revenue (million), by Distribution Channel 2025 & 2033
- Figure 13: Europe RTA Furniture Industry Revenue Share (%), by Distribution Channel 2025 & 2033
- Figure 14: Europe RTA Furniture Industry Revenue (million), by End User 2025 & 2033
- Figure 15: Europe RTA Furniture Industry Revenue Share (%), by End User 2025 & 2033
- Figure 16: Europe RTA Furniture Industry Revenue (million), by Country 2025 & 2033
- Figure 17: Europe RTA Furniture Industry Revenue Share (%), by Country 2025 & 2033
- Figure 18: Asia Pacific RTA Furniture Industry Revenue (million), by Product 2025 & 2033
- Figure 19: Asia Pacific RTA Furniture Industry Revenue Share (%), by Product 2025 & 2033
- Figure 20: Asia Pacific RTA Furniture Industry Revenue (million), by Distribution Channel 2025 & 2033
- Figure 21: Asia Pacific RTA Furniture Industry Revenue Share (%), by Distribution Channel 2025 & 2033
- Figure 22: Asia Pacific RTA Furniture Industry Revenue (million), by End User 2025 & 2033
- Figure 23: Asia Pacific RTA Furniture Industry Revenue Share (%), by End User 2025 & 2033
- Figure 24: Asia Pacific RTA Furniture Industry Revenue (million), by Country 2025 & 2033
- Figure 25: Asia Pacific RTA Furniture Industry Revenue Share (%), by Country 2025 & 2033
- Figure 26: Latin America RTA Furniture Industry Revenue (million), by Product 2025 & 2033
- Figure 27: Latin America RTA Furniture Industry Revenue Share (%), by Product 2025 & 2033
- Figure 28: Latin America RTA Furniture Industry Revenue (million), by Distribution Channel 2025 & 2033
- Figure 29: Latin America RTA Furniture Industry Revenue Share (%), by Distribution Channel 2025 & 2033
- Figure 30: Latin America RTA Furniture Industry Revenue (million), by End User 2025 & 2033
- Figure 31: Latin America RTA Furniture Industry Revenue Share (%), by End User 2025 & 2033
- Figure 32: Latin America RTA Furniture Industry Revenue (million), by Country 2025 & 2033
- Figure 33: Latin America RTA Furniture Industry Revenue Share (%), by Country 2025 & 2033
- Figure 34: Middle East RTA Furniture Industry Revenue (million), by Product 2025 & 2033
- Figure 35: Middle East RTA Furniture Industry Revenue Share (%), by Product 2025 & 2033
- Figure 36: Middle East RTA Furniture Industry Revenue (million), by Distribution Channel 2025 & 2033
- Figure 37: Middle East RTA Furniture Industry Revenue Share (%), by Distribution Channel 2025 & 2033
- Figure 38: Middle East RTA Furniture Industry Revenue (million), by End User 2025 & 2033
- Figure 39: Middle East RTA Furniture Industry Revenue Share (%), by End User 2025 & 2033
- Figure 40: Middle East RTA Furniture Industry Revenue (million), by Country 2025 & 2033
- Figure 41: Middle East RTA Furniture Industry Revenue Share (%), by Country 2025 & 2033
List of Tables
- Table 1: Global RTA Furniture Industry Revenue million Forecast, by Product 2020 & 2033
- Table 2: Global RTA Furniture Industry Revenue million Forecast, by Distribution Channel 2020 & 2033
- Table 3: Global RTA Furniture Industry Revenue million Forecast, by End User 2020 & 2033
- Table 4: Global RTA Furniture Industry Revenue million Forecast, by Region 2020 & 2033
- Table 5: Global RTA Furniture Industry Revenue million Forecast, by Product 2020 & 2033
- Table 6: Global RTA Furniture Industry Revenue million Forecast, by Distribution Channel 2020 & 2033
- Table 7: Global RTA Furniture Industry Revenue million Forecast, by End User 2020 & 2033
- Table 8: Global RTA Furniture Industry Revenue million Forecast, by Country 2020 & 2033
- Table 9: Global RTA Furniture Industry Revenue million Forecast, by Product 2020 & 2033
- Table 10: Global RTA Furniture Industry Revenue million Forecast, by Distribution Channel 2020 & 2033
- Table 11: Global RTA Furniture Industry Revenue million Forecast, by End User 2020 & 2033
- Table 12: Global RTA Furniture Industry Revenue million Forecast, by Country 2020 & 2033
- Table 13: Global RTA Furniture Industry Revenue million Forecast, by Product 2020 & 2033
- Table 14: Global RTA Furniture Industry Revenue million Forecast, by Distribution Channel 2020 & 2033
- Table 15: Global RTA Furniture Industry Revenue million Forecast, by End User 2020 & 2033
- Table 16: Global RTA Furniture Industry Revenue million Forecast, by Country 2020 & 2033
- Table 17: Global RTA Furniture Industry Revenue million Forecast, by Product 2020 & 2033
- Table 18: Global RTA Furniture Industry Revenue million Forecast, by Distribution Channel 2020 & 2033
- Table 19: Global RTA Furniture Industry Revenue million Forecast, by End User 2020 & 2033
- Table 20: Global RTA Furniture Industry Revenue million Forecast, by Country 2020 & 2033
- Table 21: Global RTA Furniture Industry Revenue million Forecast, by Product 2020 & 2033
- Table 22: Global RTA Furniture Industry Revenue million Forecast, by Distribution Channel 2020 & 2033
- Table 23: Global RTA Furniture Industry Revenue million Forecast, by End User 2020 & 2033
- Table 24: Global RTA Furniture Industry Revenue million Forecast, by Country 2020 & 2033
Frequently Asked Questions
1. What is the projected Compound Annual Growth Rate (CAGR) of the RTA Furniture Industry?
The projected CAGR is approximately 7.3%.
2. Which companies are prominent players in the RTA Furniture Industry?
Key companies in the market include Inter IKEA Holding SA, Sauder Woodworking Company, Leicht Kuchen AG, Simplicity Sofas, Dorel Industries Inc, Bush Industries Inc, Flexsteel (Home Styles), Other Key Players (Prepac Manufacturing Ltd Venture Horizon Corporation Nolte Group Wellemobel GmbH Tvilum Alno Group Walker Edison Furniture Company LLC and others)**List Not Exhaustive, Steinhoff Holding, South Shore Furniture, 6 COMPETITIVE LANDSCAPE 6 1 MARKET CONCENTRATION OVERVIEW 6 2 COMPANY PROFILES, Whalen Furniture Manufacturing.
3. What are the main segments of the RTA Furniture Industry?
The market segments include Product, Distribution Channel, End User.
4. Can you provide details about the market size?
The market size is estimated to be USD 18353.4 million as of 2022.
5. What are some drivers contributing to market growth?
Rise in E-commerce is Driving the Market; Rise in Construction and Real Estate Sector Drives the Furniture Market.
6. What are the notable trends driving market growth?
Convenience of RTA furniture.
7. Are there any restraints impacting market growth?
Economic Fluctuations; High Competition in the Furniture Market.
8. Can you provide examples of recent developments in the market?
N/A
9. What pricing options are available for accessing the report?
Pricing options include single-user, multi-user, and enterprise licenses priced at USD 4750, USD 5250, and USD 8750 respectively.
10. Is the market size provided in terms of value or volume?
The market size is provided in terms of value, measured in million.
11. Are there any specific market keywords associated with the report?
Yes, the market keyword associated with the report is "RTA Furniture Industry," which aids in identifying and referencing the specific market segment covered.
12. How do I determine which pricing option suits my needs best?
The pricing options vary based on user requirements and access needs. Individual users may opt for single-user licenses, while businesses requiring broader access may choose multi-user or enterprise licenses for cost-effective access to the report.
13. Are there any additional resources or data provided in the RTA Furniture Industry report?
While the report offers comprehensive insights, it's advisable to review the specific contents or supplementary materials provided to ascertain if additional resources or data are available.
14. How can I stay updated on further developments or reports in the RTA Furniture Industry?
To stay informed about further developments, trends, and reports in the RTA Furniture Industry, consider subscribing to industry newsletters, following relevant companies and organizations, or regularly checking reputable industry news sources and publications.
Methodology
Step 1 - Identification of Relevant Samples Size from Population Database


Step 2 - Approaches for Defining Global Market Size (Value, Volume* & Price*)

Note*: In applicable scenarios
Step 3 - Data Sources
Primary Research
- Web Analytics
- Survey Reports
- Research Institute
- Latest Research Reports
- Opinion Leaders
Secondary Research
- Annual Reports
- White Paper
- Latest Press Release
- Industry Association
- Paid Database
- Investor Presentations

Step 4 - Data Triangulation
Involves using different sources of information in order to increase the validity of a study
These sources are likely to be stakeholders in a program - participants, other researchers, program staff, other community members, and so on.
Then we put all data in single framework & apply various statistical tools to find out the dynamic on the market.
During the analysis stage, feedback from the stakeholder groups would be compared to determine areas of agreement as well as areas of divergence