

Key Insights
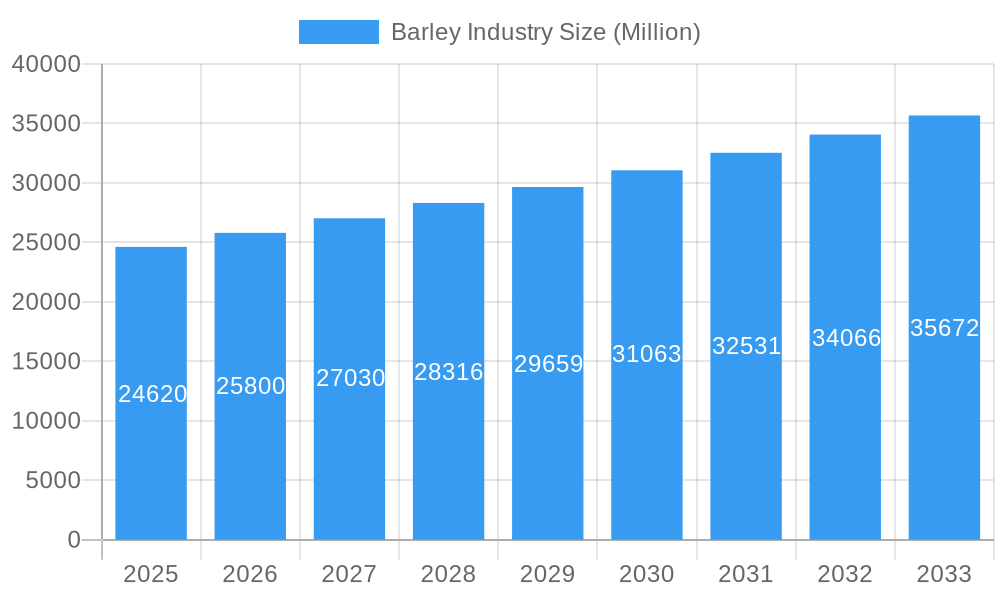
The global barley market, valued at $24.62 billion in 2025, is projected to experience steady growth, exhibiting a Compound Annual Growth Rate (CAGR) of 4.73% from 2025 to 2033. This growth is fueled by several key drivers. Increasing demand for barley in the food and beverage sector, particularly for brewing and distilling, remains a significant contributor. The burgeoning animal feed industry, utilizing barley as a cost-effective and nutritious ingredient, further propels market expansion. Furthermore, rising awareness of barley's nutritional benefits and its role in sustainable agriculture are driving consumption in food applications and seed markets. While challenges such as fluctuating crop yields due to climate change and competition from alternative grains exist, innovative farming techniques and advancements in barley processing technologies are mitigating these restraints. The market is segmented by application (food and beverage, feed, seed) and product type (malting barley, feed barley, food barley, seed barley), offering diverse growth opportunities across various segments. Regions like North America and Europe, with established agricultural infrastructure and high per capita consumption, dominate the market, but the Asia-Pacific region demonstrates significant potential for future growth, fueled by increasing disposable incomes and changing dietary habits.
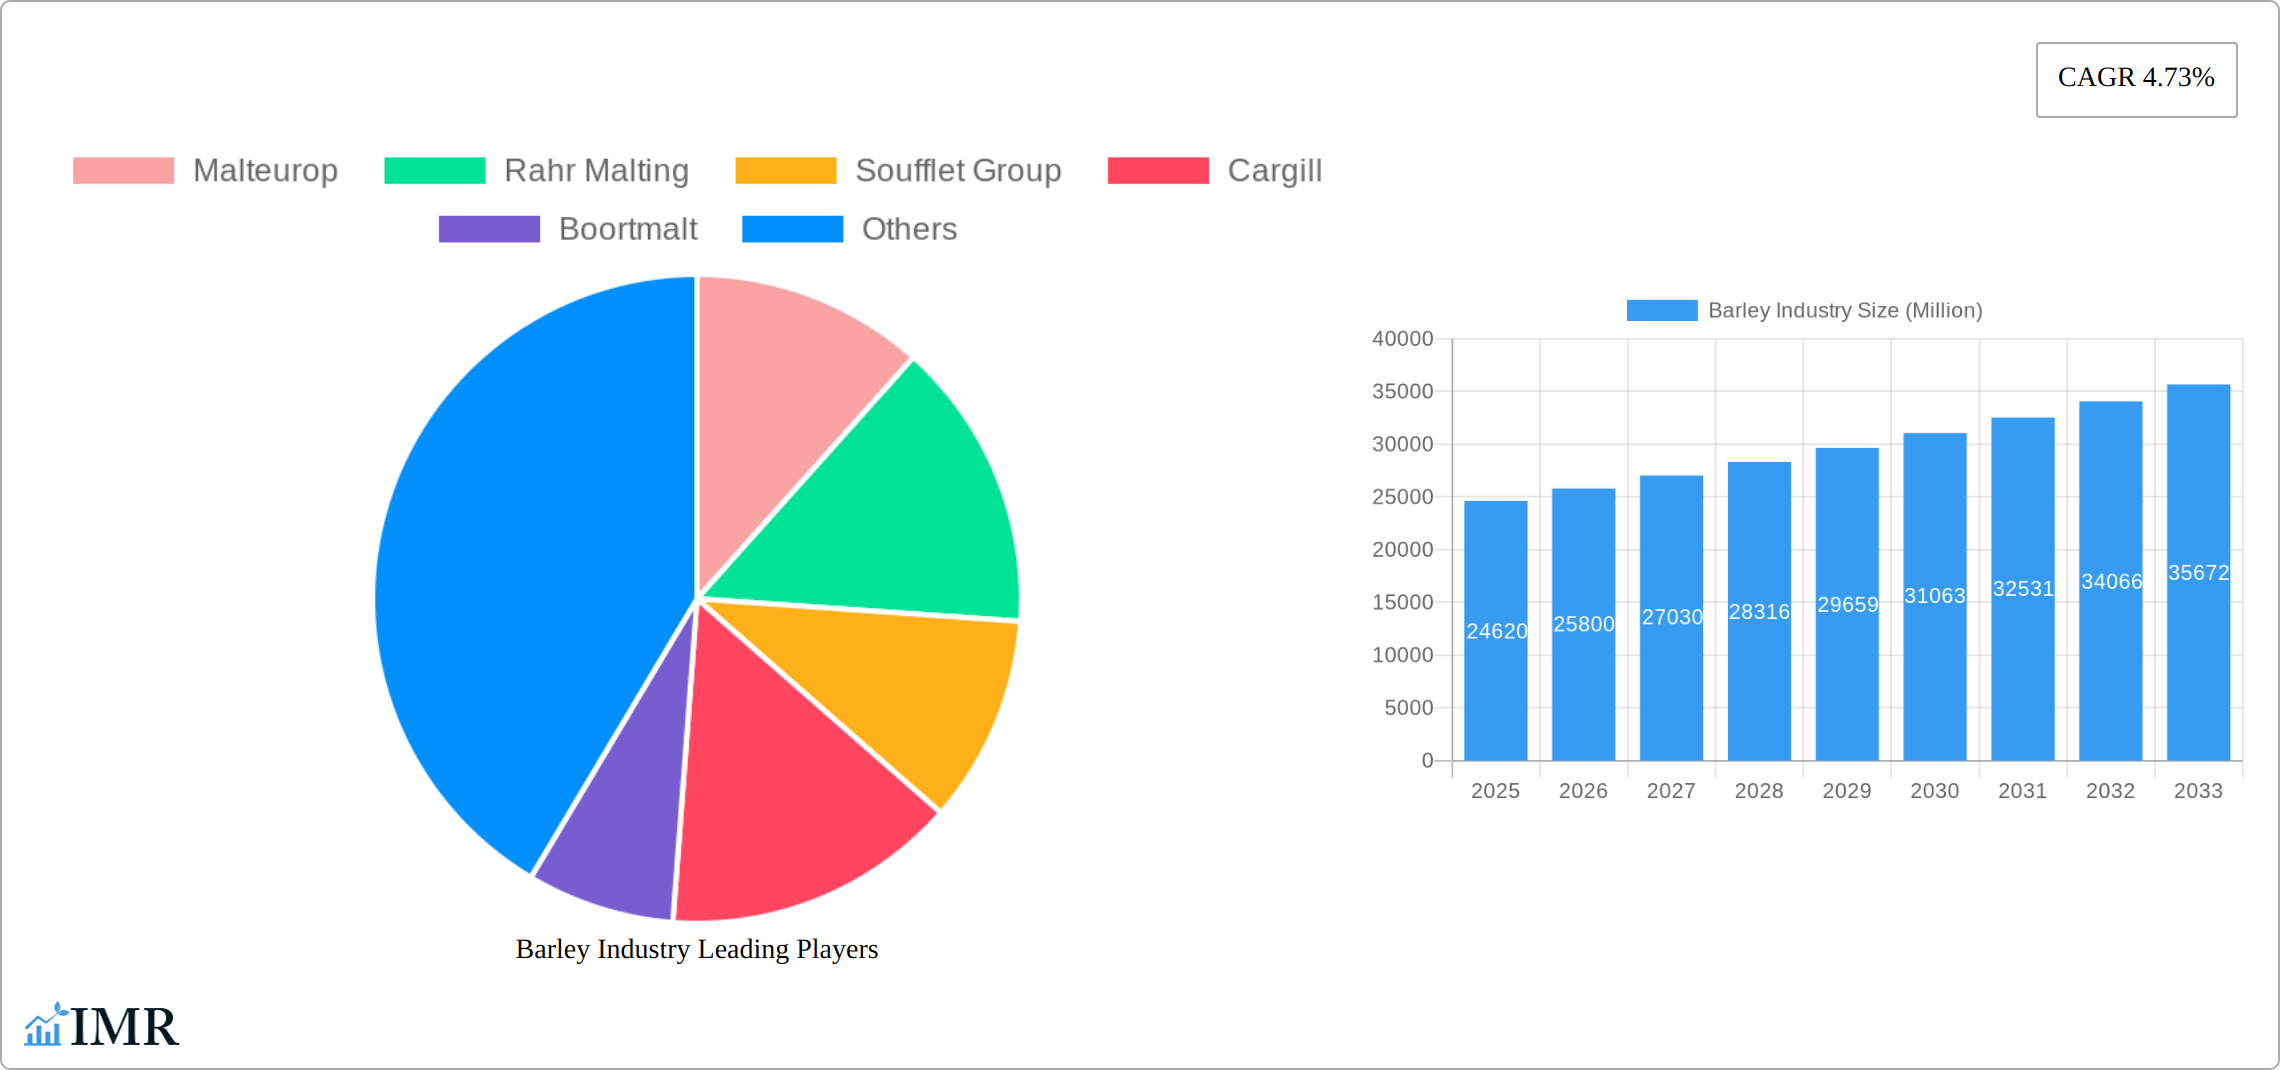
Barley Industry Market Size (In Billion)
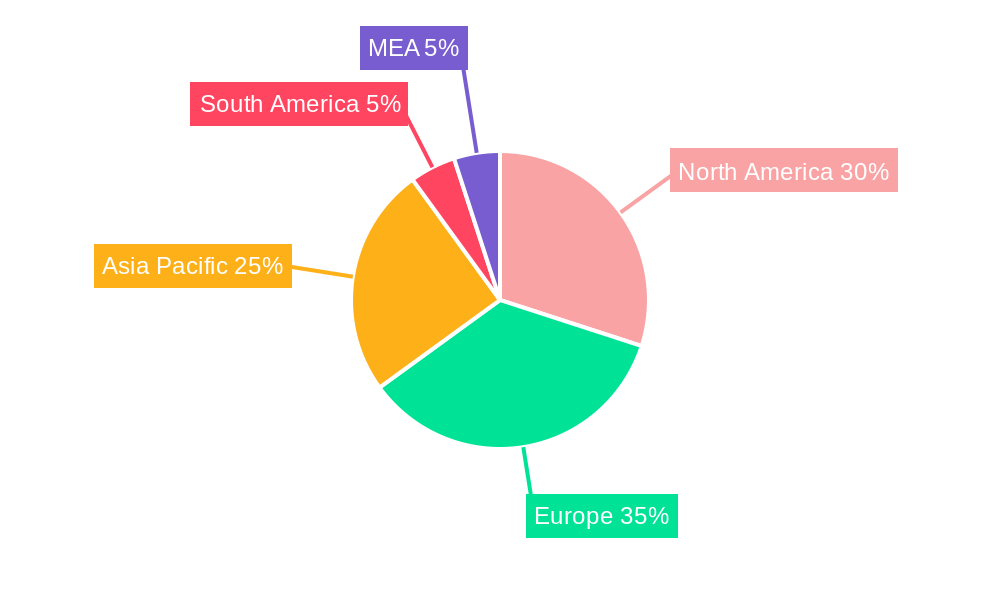
The competitive landscape is shaped by major players such as Malteurop, Rahr Malting, Soufflet Group, Cargill, and Boortmalt, each vying for market share through strategic partnerships, technological advancements, and geographic expansion. Regional variations in barley production and consumption patterns are noteworthy. While North America and Europe maintain significant market dominance due to established agricultural practices and high consumption rates, Asia-Pacific’s expanding middle class and growing demand for processed food products are anticipated to drive considerable growth in the coming years. The South American and MEA regions, while currently holding smaller market shares, represent potential growth areas driven by factors like increasing urbanization and changing consumer preferences. The forecast period (2025-2033) suggests a consistent upward trend, signifying a promising outlook for investors and stakeholders within the global barley market.
Barley Industry Company Market Share
Barley Industry Market Report: 2019-2033
This comprehensive report provides an in-depth analysis of the global barley industry, encompassing market dynamics, growth trends, regional insights, product landscapes, and future outlooks. The study period covers 2019-2033, with a base year of 2025 and a forecast period of 2025-2033. The report segments the market by application (Food and Beverage, Feed, Seed) and product type (Malting Barley, Feed Barley, Food Barley, Seed Barley), offering granular insights for industry professionals and investors. The report features key players like Malteurop, Rahr Malting, Soufflet Group, Cargill, and Boortmalt. Projected market values are presented in million units.
Barley Industry Market Dynamics & Structure
The global barley market is a moderately concentrated industry, with a few major players holding significant market share. Malteurop, Rahr Malting, Soufflet Group, Cargill, and Boortmalt are key players, collectively accounting for an estimated xx% of the global market in 2025. Market concentration is influenced by factors such as economies of scale in malting and processing, and established supply chains.
Technological innovation, particularly in breeding for yield and disease resistance, is a significant driver, while regulatory frameworks related to agricultural practices and food safety impact production and trade. Substitute products, like other grains, exert competitive pressure, particularly in the feed segment. End-user demographics, with shifts in consumer preferences towards healthier foods and sustainable production, are influencing market demand. M&A activity in the sector has been moderate in recent years, with xx deals recorded between 2019 and 2024, primarily focused on consolidating supply chains and expanding geographical reach.
- Market Concentration: Estimated xx% held by top 5 players in 2025.
- Technological Innovation: Focus on yield improvement, disease resistance, and sustainable farming practices.
- Regulatory Landscape: Evolving regulations concerning food safety, environmental protection, and trade policies.
- Competitive Substitutes: Other grains (wheat, corn, oats) compete primarily in the feed segment.
- End-User Demographics: Growing demand for healthier foods and sustainable agriculture.
- M&A Activity: xx deals recorded between 2019 and 2024, focusing on supply chain consolidation and geographic expansion.
Barley Industry Growth Trends & Insights
The global barley market experienced a Compound Annual Growth Rate (CAGR) of xx% during the historical period (2019-2024). This growth is projected to continue at a CAGR of xx% during the forecast period (2025-2033), driven by increasing demand from the food and beverage and feed industries. Market penetration of barley in various applications is relatively high in established markets, but opportunities exist in emerging economies. Technological disruptions, such as precision agriculture and advanced breeding techniques, are enhancing yields and efficiency. Shifting consumer preferences towards more sustainable and ethically sourced products are influencing production practices and market demand. Specific growth trajectories vary across segments and regions.
Dominant Regions, Countries, or Segments in Barley Industry
Europe remains the dominant region for barley production and consumption, driven by a confluence of factors: large-scale, efficient farming practices; well-established processing infrastructure; and robust demand from the brewing and food industries. Key European producers include France, Germany, and Ukraine, but significant production also occurs in other regions like Australia, Canada, and Russia, each with their own unique varietal strengths and market dynamics. Globally, the food and beverage sector, particularly the brewing industry, constitutes the largest consumer of barley. The animal feed industry represents a substantial secondary market, while the seed market, though smaller in volume, is vital for future production and genetic improvement. The industry's geographic distribution is constantly evolving due to factors such as climate change, shifting consumer preferences, and the emergence of new markets.
- Key Drivers of Regional Dominance: Efficient farming practices, advanced processing technologies, strong domestic demand, favorable government policies, and access to international markets.
- Food and Beverage Sector: Beer remains the primary driver, but expanding applications in foods, malts, and other products fuel sustained growth in this sector.
- Growth Potential: Emerging markets in Asia and Africa, alongside increasing demand for sustainable and functional food ingredients, present significant opportunities for expansion.
- Market Segmentation: The barley market is diverse, encompassing various barley types (e.g., malting barley, feed barley, food barley) each with distinct applications and value chains.
Barley Industry Product Landscape
The barley market offers a diverse range of products, including malting barley (primarily for brewing), feed barley, food barley, and seed barley. Recent innovations focus on developing barley varieties with improved yield, disease resistance, and nutritional qualities. Technological advancements in malting and processing technologies are enhancing the efficiency and quality of barley products. Unique selling propositions for individual barley types often revolve around their specific suitability for different applications (e.g., high-protein varieties for animal feed, specific enzyme profiles for brewing).
Key Drivers, Barriers & Challenges in Barley Industry
Key Drivers: Increasing global population driving food demand, growing demand for animal feed, rising consumer preference for craft beer, and technological advancements improving barley yield and quality.
Key Challenges: Climate change impacting yields and crop quality, fluctuating commodity prices, and trade regulations impacting international trade. Supply chain disruptions (e.g., logistical bottlenecks) have also created price volatility and impacted availability. The impact of these challenges can be quantified through reduced yields (estimated at xx% in some regions due to drought), increased production costs (estimated at xx% due to fertilizer price increases), and constrained market access.
Emerging Opportunities in Barley Industry
The barley industry is witnessing a surge in innovation, driven by several key opportunities: the development of novel food and beverage products leveraging barley's unique nutritional properties; the expansion into niche markets, such as gluten-free products and specialized malts; and the increasing demand for sustainably produced, locally sourced ingredients. Furthermore, advancements in barley breeding are leading to the development of varieties better adapted to climate change, enhancing both yield and resilience. This focus on sustainability is resonating strongly with environmentally conscious consumers.
Growth Accelerators in the Barley Industry
Technological advancements in barley breeding, precision agriculture, and efficient malting processes are significantly accelerating industry growth. Strategic collaborations between producers, processors, researchers, and marketers are crucial for optimizing value chains and bringing innovative products to market. Expansion into high-growth economies and the development of value-added barley products (e.g., barley flour, barley protein isolates) are further driving market expansion. Moreover, investments in research and development are crucial for improving yield, disease resistance, and nutritional content.
Key Players Shaping the Barley Industry Market
Notable Milestones in Barley Industry Sector
- April 2021: Intergrain's collaboration with Australian universities to improve barley yield stability demonstrated a commitment to research-driven advancements, enhancing Australian barley's global competitiveness.
- January 2023: The European Commission's updated Common Agricultural Policy (CAP) emphasizes sustainability and resilience within the European barley sector, signaling a shift towards environmentally friendly practices and potentially impacting production methods and market dynamics. This reflects a broader global trend toward sustainable agriculture.
- Ongoing Developments: Continuous advancements in genetics, agricultural technologies, and processing techniques are constantly shaping the industry landscape, leading to greater efficiency, sustainability, and higher-quality products.
In-Depth Barley Industry Market Outlook
The barley industry is poised for continued growth driven by rising global demand, technological innovations enhancing yields and efficiency, and strategic investments in research and development. Opportunities lie in value-added products, sustainable farming practices, and expansion into new markets. Strategic partnerships and sustainable practices will be crucial for long-term success.
Barley Industry Segmentation
- 1. Production Analysis
- 2. Consumption Analysis
- 3. Import Market Analysis (Value & Volume)
- 4. Export Market Analysis (Value & Volume)
- 5. Price Trend Analysis
Barley Industry Segmentation By Geography
-
1. North America
- 1.1. United States
-
2. Europe
- 2.1. Germany
-
3. Asia Pacific
- 3.1. China
-
4. South America
- 4.1. Argentina
- 5. Middle East
- 6. Saudi Arabia
Barley Industry Regional Market Share
Geographic Coverage of Barley Industry
Barley Industry REPORT HIGHLIGHTS
| Aspects | Details |
|---|---|
| Study Period | 2020-2034 |
| Base Year | 2025 |
| Estimated Year | 2026 |
| Forecast Period | 2026-2034 |
| Historical Period | 2020-2025 |
| Growth Rate | CAGR of 4.73% from 2020-2034 |
| Segmentation |
|
Table of Contents
- 1. Introduction
- 1.1. Research Scope
- 1.2. Market Segmentation
- 1.3. Research Objective
- 1.4. Definitions and Assumptions
- 2. Executive Summary
- 2.1. Market Snapshot
- 3. Market Dynamics
- 3.1. Market Drivers
- 3.2. Market Restrains
- 3.3. Market Trends
- 3.4. Market Opportunities
- 4. Market Factor Analysis
- 4.1. Porters Five Forces
- 4.1.1. Bargaining Power of Suppliers
- 4.1.2. Bargaining Power of Buyers
- 4.1.3. Threat of New Entrants
- 4.1.4. Threat of Substitutes
- 4.1.5. Competitive Rivalry
- 4.2. PESTEL analysis
- 4.3. BCG Analysis
- 4.3.1. Stars (High Growth, High Market Share)
- 4.3.2. Cash Cows (Low Growth, High Market Share)
- 4.3.3. Question Mark (High Growth, Low Market Share)
- 4.3.4. Dogs (Low Growth, Low Market Share)
- 4.4. Ansoff Matrix Analysis
- 4.5. Supply Chain Analysis
- 4.6. Regulatory Landscape
- 4.7. Current Market Potential and Opportunity Assessment (TAM–SAM–SOM Framework)
- 4.8. IMR Analyst Note
- 4.1. Porters Five Forces
- 5. Market Analysis, Insights and Forecast 2021-2033
- 5.1. Market Analysis, Insights and Forecast - by Production Analysis
- 5.2. Market Analysis, Insights and Forecast - by Consumption Analysis
- 5.3. Market Analysis, Insights and Forecast - by Import Market Analysis (Value & Volume)
- 5.4. Market Analysis, Insights and Forecast - by Export Market Analysis (Value & Volume)
- 5.5. Market Analysis, Insights and Forecast - by Price Trend Analysis
- 5.6. Market Analysis, Insights and Forecast - by Region
- 5.6.1. North America
- 5.6.2. Europe
- 5.6.3. Asia Pacific
- 5.6.4. South America
- 5.6.5. Middle East
- 5.6.6. Saudi Arabia
- 6. Global Barley Industry Analysis, Insights and Forecast, 2021-2033
- 6.1. Market Analysis, Insights and Forecast - by Production Analysis
- 6.2. Market Analysis, Insights and Forecast - by Consumption Analysis
- 6.3. Market Analysis, Insights and Forecast - by Import Market Analysis (Value & Volume)
- 6.4. Market Analysis, Insights and Forecast - by Export Market Analysis (Value & Volume)
- 6.5. Market Analysis, Insights and Forecast - by Price Trend Analysis
- 7. North America Barley Industry Analysis, Insights and Forecast, 2020-2032
- 7.1. Market Analysis, Insights and Forecast - by Production Analysis
- 7.2. Market Analysis, Insights and Forecast - by Consumption Analysis
- 7.3. Market Analysis, Insights and Forecast - by Import Market Analysis (Value & Volume)
- 7.4. Market Analysis, Insights and Forecast - by Export Market Analysis (Value & Volume)
- 7.5. Market Analysis, Insights and Forecast - by Price Trend Analysis
- 8. Europe Barley Industry Analysis, Insights and Forecast, 2020-2032
- 8.1. Market Analysis, Insights and Forecast - by Production Analysis
- 8.2. Market Analysis, Insights and Forecast - by Consumption Analysis
- 8.3. Market Analysis, Insights and Forecast - by Import Market Analysis (Value & Volume)
- 8.4. Market Analysis, Insights and Forecast - by Export Market Analysis (Value & Volume)
- 8.5. Market Analysis, Insights and Forecast - by Price Trend Analysis
- 9. Asia Pacific Barley Industry Analysis, Insights and Forecast, 2020-2032
- 9.1. Market Analysis, Insights and Forecast - by Production Analysis
- 9.2. Market Analysis, Insights and Forecast - by Consumption Analysis
- 9.3. Market Analysis, Insights and Forecast - by Import Market Analysis (Value & Volume)
- 9.4. Market Analysis, Insights and Forecast - by Export Market Analysis (Value & Volume)
- 9.5. Market Analysis, Insights and Forecast - by Price Trend Analysis
- 10. South America Barley Industry Analysis, Insights and Forecast, 2020-2032
- 10.1. Market Analysis, Insights and Forecast - by Production Analysis
- 10.2. Market Analysis, Insights and Forecast - by Consumption Analysis
- 10.3. Market Analysis, Insights and Forecast - by Import Market Analysis (Value & Volume)
- 10.4. Market Analysis, Insights and Forecast - by Export Market Analysis (Value & Volume)
- 10.5. Market Analysis, Insights and Forecast - by Price Trend Analysis
- 11. Middle East Barley Industry Analysis, Insights and Forecast, 2020-2032
- 11.1. Market Analysis, Insights and Forecast - by Production Analysis
- 11.2. Market Analysis, Insights and Forecast - by Consumption Analysis
- 11.3. Market Analysis, Insights and Forecast - by Import Market Analysis (Value & Volume)
- 11.4. Market Analysis, Insights and Forecast - by Export Market Analysis (Value & Volume)
- 11.5. Market Analysis, Insights and Forecast - by Price Trend Analysis
- 12. Saudi Arabia Barley Industry Analysis, Insights and Forecast, 2020-2032
- 12.1. Market Analysis, Insights and Forecast - by Production Analysis
- 12.2. Market Analysis, Insights and Forecast - by Consumption Analysis
- 12.3. Market Analysis, Insights and Forecast - by Import Market Analysis (Value & Volume)
- 12.4. Market Analysis, Insights and Forecast - by Export Market Analysis (Value & Volume)
- 12.5. Market Analysis, Insights and Forecast - by Price Trend Analysis
- 13. Competitive Analysis
- 13.1. Company Profiles
- 13.1.1 Malteurop
- 13.1.1.1. Company Overview
- 13.1.1.2. Products
- 13.1.1.3. Company Financials
- 13.1.1.4. SWOT Analysis
- 13.1.2 Rahr Malting
- 13.1.2.1. Company Overview
- 13.1.2.2. Products
- 13.1.2.3. Company Financials
- 13.1.2.4. SWOT Analysis
- 13.1.3 Soufflet Group
- 13.1.3.1. Company Overview
- 13.1.3.2. Products
- 13.1.3.3. Company Financials
- 13.1.3.4. SWOT Analysis
- 13.1.4 Cargill
- 13.1.4.1. Company Overview
- 13.1.4.2. Products
- 13.1.4.3. Company Financials
- 13.1.4.4. SWOT Analysis
- 13.1.5 Boortmalt
- 13.1.5.1. Company Overview
- 13.1.5.2. Products
- 13.1.5.3. Company Financials
- 13.1.5.4. SWOT Analysis
- 13.1.1 Malteurop
- 13.2. Market Entropy
- 13.2.1 Company's Key Areas Served
- 13.2.2 Recent Developments
- 13.3. Company Market Share Analysis 2025
- 13.3.1 Top 5 Companies Market Share Analysis
- 13.3.2 Top 3 Companies Market Share Analysis
- 13.4. List of Potential Customers
- 14. Research Methodology
List of Figures
- Figure 1: Global Barley Industry Revenue Breakdown (Million, %) by Region 2025 & 2033
- Figure 2: North America Barley Industry Revenue (Million), by Production Analysis 2025 & 2033
- Figure 3: North America Barley Industry Revenue Share (%), by Production Analysis 2025 & 2033
- Figure 4: North America Barley Industry Revenue (Million), by Consumption Analysis 2025 & 2033
- Figure 5: North America Barley Industry Revenue Share (%), by Consumption Analysis 2025 & 2033
- Figure 6: North America Barley Industry Revenue (Million), by Import Market Analysis (Value & Volume) 2025 & 2033
- Figure 7: North America Barley Industry Revenue Share (%), by Import Market Analysis (Value & Volume) 2025 & 2033
- Figure 8: North America Barley Industry Revenue (Million), by Export Market Analysis (Value & Volume) 2025 & 2033
- Figure 9: North America Barley Industry Revenue Share (%), by Export Market Analysis (Value & Volume) 2025 & 2033
- Figure 10: North America Barley Industry Revenue (Million), by Price Trend Analysis 2025 & 2033
- Figure 11: North America Barley Industry Revenue Share (%), by Price Trend Analysis 2025 & 2033
- Figure 12: North America Barley Industry Revenue (Million), by Country 2025 & 2033
- Figure 13: North America Barley Industry Revenue Share (%), by Country 2025 & 2033
- Figure 14: Europe Barley Industry Revenue (Million), by Production Analysis 2025 & 2033
- Figure 15: Europe Barley Industry Revenue Share (%), by Production Analysis 2025 & 2033
- Figure 16: Europe Barley Industry Revenue (Million), by Consumption Analysis 2025 & 2033
- Figure 17: Europe Barley Industry Revenue Share (%), by Consumption Analysis 2025 & 2033
- Figure 18: Europe Barley Industry Revenue (Million), by Import Market Analysis (Value & Volume) 2025 & 2033
- Figure 19: Europe Barley Industry Revenue Share (%), by Import Market Analysis (Value & Volume) 2025 & 2033
- Figure 20: Europe Barley Industry Revenue (Million), by Export Market Analysis (Value & Volume) 2025 & 2033
- Figure 21: Europe Barley Industry Revenue Share (%), by Export Market Analysis (Value & Volume) 2025 & 2033
- Figure 22: Europe Barley Industry Revenue (Million), by Price Trend Analysis 2025 & 2033
- Figure 23: Europe Barley Industry Revenue Share (%), by Price Trend Analysis 2025 & 2033
- Figure 24: Europe Barley Industry Revenue (Million), by Country 2025 & 2033
- Figure 25: Europe Barley Industry Revenue Share (%), by Country 2025 & 2033
- Figure 26: Asia Pacific Barley Industry Revenue (Million), by Production Analysis 2025 & 2033
- Figure 27: Asia Pacific Barley Industry Revenue Share (%), by Production Analysis 2025 & 2033
- Figure 28: Asia Pacific Barley Industry Revenue (Million), by Consumption Analysis 2025 & 2033
- Figure 29: Asia Pacific Barley Industry Revenue Share (%), by Consumption Analysis 2025 & 2033
- Figure 30: Asia Pacific Barley Industry Revenue (Million), by Import Market Analysis (Value & Volume) 2025 & 2033
- Figure 31: Asia Pacific Barley Industry Revenue Share (%), by Import Market Analysis (Value & Volume) 2025 & 2033
- Figure 32: Asia Pacific Barley Industry Revenue (Million), by Export Market Analysis (Value & Volume) 2025 & 2033
- Figure 33: Asia Pacific Barley Industry Revenue Share (%), by Export Market Analysis (Value & Volume) 2025 & 2033
- Figure 34: Asia Pacific Barley Industry Revenue (Million), by Price Trend Analysis 2025 & 2033
- Figure 35: Asia Pacific Barley Industry Revenue Share (%), by Price Trend Analysis 2025 & 2033
- Figure 36: Asia Pacific Barley Industry Revenue (Million), by Country 2025 & 2033
- Figure 37: Asia Pacific Barley Industry Revenue Share (%), by Country 2025 & 2033
- Figure 38: South America Barley Industry Revenue (Million), by Production Analysis 2025 & 2033
- Figure 39: South America Barley Industry Revenue Share (%), by Production Analysis 2025 & 2033
- Figure 40: South America Barley Industry Revenue (Million), by Consumption Analysis 2025 & 2033
- Figure 41: South America Barley Industry Revenue Share (%), by Consumption Analysis 2025 & 2033
- Figure 42: South America Barley Industry Revenue (Million), by Import Market Analysis (Value & Volume) 2025 & 2033
- Figure 43: South America Barley Industry Revenue Share (%), by Import Market Analysis (Value & Volume) 2025 & 2033
- Figure 44: South America Barley Industry Revenue (Million), by Export Market Analysis (Value & Volume) 2025 & 2033
- Figure 45: South America Barley Industry Revenue Share (%), by Export Market Analysis (Value & Volume) 2025 & 2033
- Figure 46: South America Barley Industry Revenue (Million), by Price Trend Analysis 2025 & 2033
- Figure 47: South America Barley Industry Revenue Share (%), by Price Trend Analysis 2025 & 2033
- Figure 48: South America Barley Industry Revenue (Million), by Country 2025 & 2033
- Figure 49: South America Barley Industry Revenue Share (%), by Country 2025 & 2033
- Figure 50: Middle East Barley Industry Revenue (Million), by Production Analysis 2025 & 2033
- Figure 51: Middle East Barley Industry Revenue Share (%), by Production Analysis 2025 & 2033
- Figure 52: Middle East Barley Industry Revenue (Million), by Consumption Analysis 2025 & 2033
- Figure 53: Middle East Barley Industry Revenue Share (%), by Consumption Analysis 2025 & 2033
- Figure 54: Middle East Barley Industry Revenue (Million), by Import Market Analysis (Value & Volume) 2025 & 2033
- Figure 55: Middle East Barley Industry Revenue Share (%), by Import Market Analysis (Value & Volume) 2025 & 2033
- Figure 56: Middle East Barley Industry Revenue (Million), by Export Market Analysis (Value & Volume) 2025 & 2033
- Figure 57: Middle East Barley Industry Revenue Share (%), by Export Market Analysis (Value & Volume) 2025 & 2033
- Figure 58: Middle East Barley Industry Revenue (Million), by Price Trend Analysis 2025 & 2033
- Figure 59: Middle East Barley Industry Revenue Share (%), by Price Trend Analysis 2025 & 2033
- Figure 60: Middle East Barley Industry Revenue (Million), by Country 2025 & 2033
- Figure 61: Middle East Barley Industry Revenue Share (%), by Country 2025 & 2033
- Figure 62: Saudi Arabia Barley Industry Revenue (Million), by Production Analysis 2025 & 2033
- Figure 63: Saudi Arabia Barley Industry Revenue Share (%), by Production Analysis 2025 & 2033
- Figure 64: Saudi Arabia Barley Industry Revenue (Million), by Consumption Analysis 2025 & 2033
- Figure 65: Saudi Arabia Barley Industry Revenue Share (%), by Consumption Analysis 2025 & 2033
- Figure 66: Saudi Arabia Barley Industry Revenue (Million), by Import Market Analysis (Value & Volume) 2025 & 2033
- Figure 67: Saudi Arabia Barley Industry Revenue Share (%), by Import Market Analysis (Value & Volume) 2025 & 2033
- Figure 68: Saudi Arabia Barley Industry Revenue (Million), by Export Market Analysis (Value & Volume) 2025 & 2033
- Figure 69: Saudi Arabia Barley Industry Revenue Share (%), by Export Market Analysis (Value & Volume) 2025 & 2033
- Figure 70: Saudi Arabia Barley Industry Revenue (Million), by Price Trend Analysis 2025 & 2033
- Figure 71: Saudi Arabia Barley Industry Revenue Share (%), by Price Trend Analysis 2025 & 2033
- Figure 72: Saudi Arabia Barley Industry Revenue (Million), by Country 2025 & 2033
- Figure 73: Saudi Arabia Barley Industry Revenue Share (%), by Country 2025 & 2033
List of Tables
- Table 1: Global Barley Industry Revenue Million Forecast, by Production Analysis 2020 & 2033
- Table 2: Global Barley Industry Revenue Million Forecast, by Consumption Analysis 2020 & 2033
- Table 3: Global Barley Industry Revenue Million Forecast, by Import Market Analysis (Value & Volume) 2020 & 2033
- Table 4: Global Barley Industry Revenue Million Forecast, by Export Market Analysis (Value & Volume) 2020 & 2033
- Table 5: Global Barley Industry Revenue Million Forecast, by Price Trend Analysis 2020 & 2033
- Table 6: Global Barley Industry Revenue Million Forecast, by Region 2020 & 2033
- Table 7: Global Barley Industry Revenue Million Forecast, by Production Analysis 2020 & 2033
- Table 8: Global Barley Industry Revenue Million Forecast, by Consumption Analysis 2020 & 2033
- Table 9: Global Barley Industry Revenue Million Forecast, by Import Market Analysis (Value & Volume) 2020 & 2033
- Table 10: Global Barley Industry Revenue Million Forecast, by Export Market Analysis (Value & Volume) 2020 & 2033
- Table 11: Global Barley Industry Revenue Million Forecast, by Price Trend Analysis 2020 & 2033
- Table 12: Global Barley Industry Revenue Million Forecast, by Country 2020 & 2033
- Table 13: United States Barley Industry Revenue (Million) Forecast, by Application 2020 & 2033
- Table 14: Global Barley Industry Revenue Million Forecast, by Production Analysis 2020 & 2033
- Table 15: Global Barley Industry Revenue Million Forecast, by Consumption Analysis 2020 & 2033
- Table 16: Global Barley Industry Revenue Million Forecast, by Import Market Analysis (Value & Volume) 2020 & 2033
- Table 17: Global Barley Industry Revenue Million Forecast, by Export Market Analysis (Value & Volume) 2020 & 2033
- Table 18: Global Barley Industry Revenue Million Forecast, by Price Trend Analysis 2020 & 2033
- Table 19: Global Barley Industry Revenue Million Forecast, by Country 2020 & 2033
- Table 20: Germany Barley Industry Revenue (Million) Forecast, by Application 2020 & 2033
- Table 21: Global Barley Industry Revenue Million Forecast, by Production Analysis 2020 & 2033
- Table 22: Global Barley Industry Revenue Million Forecast, by Consumption Analysis 2020 & 2033
- Table 23: Global Barley Industry Revenue Million Forecast, by Import Market Analysis (Value & Volume) 2020 & 2033
- Table 24: Global Barley Industry Revenue Million Forecast, by Export Market Analysis (Value & Volume) 2020 & 2033
- Table 25: Global Barley Industry Revenue Million Forecast, by Price Trend Analysis 2020 & 2033
- Table 26: Global Barley Industry Revenue Million Forecast, by Country 2020 & 2033
- Table 27: China Barley Industry Revenue (Million) Forecast, by Application 2020 & 2033
- Table 28: Global Barley Industry Revenue Million Forecast, by Production Analysis 2020 & 2033
- Table 29: Global Barley Industry Revenue Million Forecast, by Consumption Analysis 2020 & 2033
- Table 30: Global Barley Industry Revenue Million Forecast, by Import Market Analysis (Value & Volume) 2020 & 2033
- Table 31: Global Barley Industry Revenue Million Forecast, by Export Market Analysis (Value & Volume) 2020 & 2033
- Table 32: Global Barley Industry Revenue Million Forecast, by Price Trend Analysis 2020 & 2033
- Table 33: Global Barley Industry Revenue Million Forecast, by Country 2020 & 2033
- Table 34: Argentina Barley Industry Revenue (Million) Forecast, by Application 2020 & 2033
- Table 35: Global Barley Industry Revenue Million Forecast, by Production Analysis 2020 & 2033
- Table 36: Global Barley Industry Revenue Million Forecast, by Consumption Analysis 2020 & 2033
- Table 37: Global Barley Industry Revenue Million Forecast, by Import Market Analysis (Value & Volume) 2020 & 2033
- Table 38: Global Barley Industry Revenue Million Forecast, by Export Market Analysis (Value & Volume) 2020 & 2033
- Table 39: Global Barley Industry Revenue Million Forecast, by Price Trend Analysis 2020 & 2033
- Table 40: Global Barley Industry Revenue Million Forecast, by Country 2020 & 2033
- Table 41: Global Barley Industry Revenue Million Forecast, by Production Analysis 2020 & 2033
- Table 42: Global Barley Industry Revenue Million Forecast, by Consumption Analysis 2020 & 2033
- Table 43: Global Barley Industry Revenue Million Forecast, by Import Market Analysis (Value & Volume) 2020 & 2033
- Table 44: Global Barley Industry Revenue Million Forecast, by Export Market Analysis (Value & Volume) 2020 & 2033
- Table 45: Global Barley Industry Revenue Million Forecast, by Price Trend Analysis 2020 & 2033
- Table 46: Global Barley Industry Revenue Million Forecast, by Country 2020 & 2033
Frequently Asked Questions
1. What is the projected Compound Annual Growth Rate (CAGR) of the Barley Industry?
The projected CAGR is approximately 4.73%.
2. Which companies are prominent players in the Barley Industry?
Key companies in the market include Malteurop , Rahr Malting , Soufflet Group , Cargill, Boortmalt .
3. What are the main segments of the Barley Industry?
The market segments include Production Analysis, Consumption Analysis, Import Market Analysis (Value & Volume), Export Market Analysis (Value & Volume), Price Trend Analysis.
4. Can you provide details about the market size?
The market size is estimated to be USD 24.62 Million as of 2022.
5. What are some drivers contributing to market growth?
Increasing Berry Consumption for Health Benefits; Increasing Adoption of High-Technology Farm Practices; Growing Usage of Berries in the Food and Beverage Industries.
6. What are the notable trends driving market growth?
Emerging Applications is Various Industries Led to Growth in Exports.
7. Are there any restraints impacting market growth?
High Production Cost Involved in Berry Production; Increasing Disease and Pest Infestations.
8. Can you provide examples of recent developments in the market?
January 2023: The European Commission's new Common Agricultural Policy aims to support European farmers in transitioning to a more sustainable and resilient agricultural industry and preserving the diversity of rural communities.
9. What pricing options are available for accessing the report?
Pricing options include single-user, multi-user, and enterprise licenses priced at USD 4750, USD 5250, and USD 8750 respectively.
10. Is the market size provided in terms of value or volume?
The market size is provided in terms of value, measured in Million.
11. Are there any specific market keywords associated with the report?
Yes, the market keyword associated with the report is "Barley Industry," which aids in identifying and referencing the specific market segment covered.
12. How do I determine which pricing option suits my needs best?
The pricing options vary based on user requirements and access needs. Individual users may opt for single-user licenses, while businesses requiring broader access may choose multi-user or enterprise licenses for cost-effective access to the report.
13. Are there any additional resources or data provided in the Barley Industry report?
While the report offers comprehensive insights, it's advisable to review the specific contents or supplementary materials provided to ascertain if additional resources or data are available.
14. How can I stay updated on further developments or reports in the Barley Industry?
To stay informed about further developments, trends, and reports in the Barley Industry, consider subscribing to industry newsletters, following relevant companies and organizations, or regularly checking reputable industry news sources and publications.
Methodology
Step 1 - Identification of Relevant Samples Size from Population Database


Step 2 - Approaches for Defining Global Market Size (Value, Volume* & Price*)

Note*: In applicable scenarios
Step 3 - Data Sources
Primary Research
- Web Analytics
- Survey Reports
- Research Institute
- Latest Research Reports
- Opinion Leaders
Secondary Research
- Annual Reports
- White Paper
- Latest Press Release
- Industry Association
- Paid Database
- Investor Presentations

Step 4 - Data Triangulation
Involves using different sources of information in order to increase the validity of a study
These sources are likely to be stakeholders in a program - participants, other researchers, program staff, other community members, and so on.
Then we put all data in single framework & apply various statistical tools to find out the dynamic on the market.
During the analysis stage, feedback from the stakeholder groups would be compared to determine areas of agreement as well as areas of divergence