

Key Insights
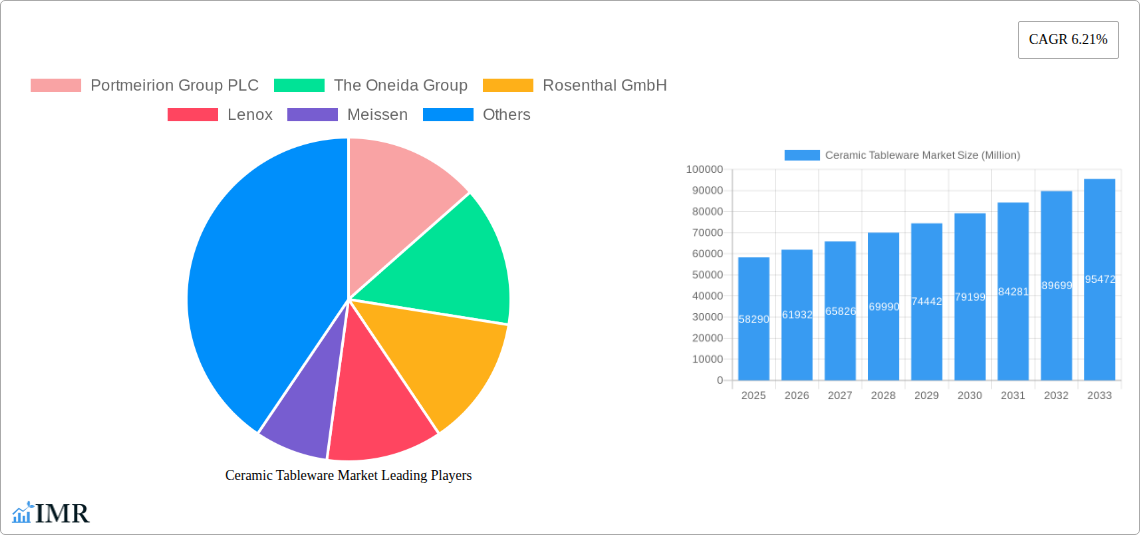
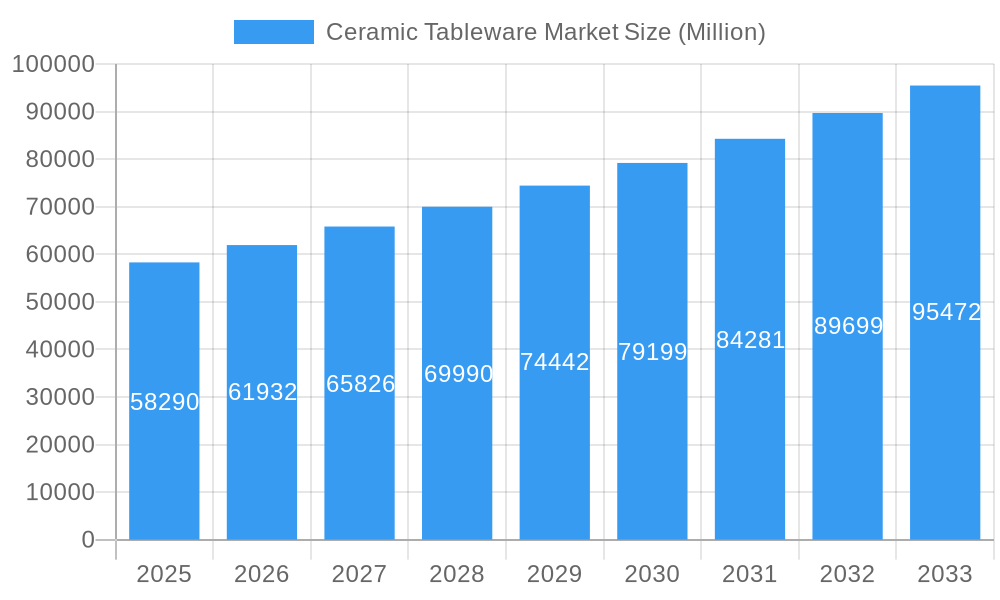
The global ceramic tableware market, valued at $58.29 billion in 2025, is projected to experience robust growth, exhibiting a Compound Annual Growth Rate (CAGR) of 6.21% from 2025 to 2033. This expansion is driven by several key factors. Rising disposable incomes in developing economies are fueling increased demand for high-quality tableware, particularly in the household segment. The growing popularity of casual dining and home entertaining further boosts consumption. Simultaneously, the shift towards sustainable and eco-friendly products is creating opportunities for ceramic tableware manufacturers, given its inherent durability and recyclability compared to disposable alternatives. Innovation in design and material science is also a significant driver, with manufacturers constantly introducing new styles, patterns, and functionalities to appeal to diverse consumer preferences. The online distribution channel is experiencing considerable growth, providing increased accessibility and convenience to consumers worldwide. However, the market faces certain restraints, including fluctuations in raw material prices and increasing competition from alternative materials like melamine and plastic. Nonetheless, the overall outlook remains positive, with the market expected to reach significant value by 2033.
Ceramic Tableware Market Market Size (In Billion)
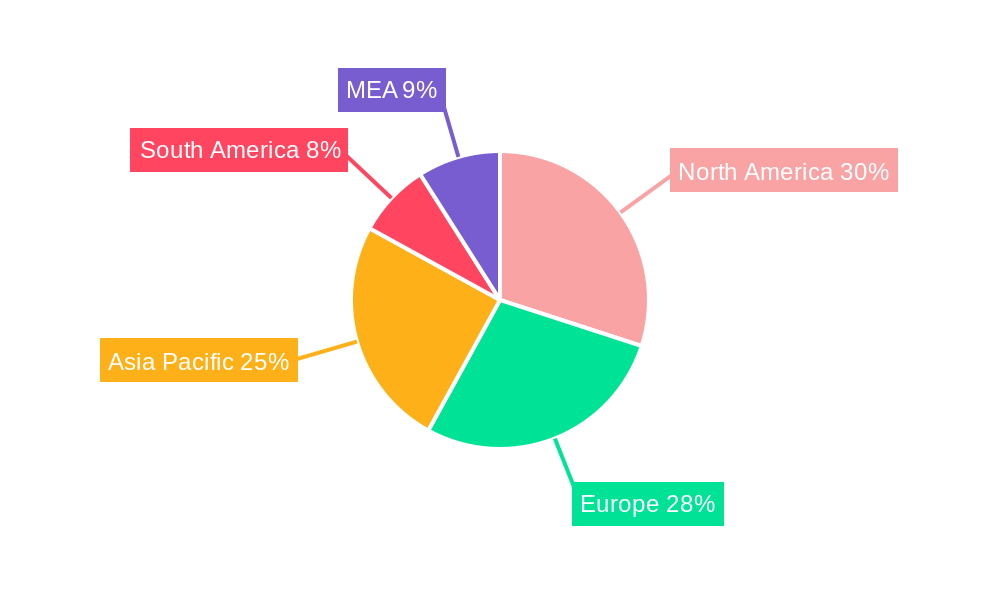
Segment-wise, porcelain and bone china continue to dominate, prized for their elegance and durability. However, stoneware (ceramic) is gaining traction due to its affordability and versatility. The household segment remains the largest end-user category, though the commercial sector, encompassing restaurants and hotels, is showing considerable growth potential driven by the emphasis on enhancing dining experiences. Geographically, North America and Europe are currently major market players, with established consumer bases and high purchasing power. However, rapidly developing economies in Asia-Pacific, particularly China and India, represent significant growth opportunities due to expanding middle classes and increasing urbanization. Strategic partnerships, product diversification, and targeted marketing campaigns will be crucial for companies to capitalize on the growth potential within specific segments and regions. The competitive landscape is marked by both established global players and regional manufacturers, fostering innovation and price competitiveness.
Ceramic Tableware Market Company Market Share
Ceramic Tableware Market: A Comprehensive Report (2019-2033)
This in-depth report provides a comprehensive analysis of the global Ceramic Tableware Market, encompassing historical data (2019-2024), current estimations (2025), and future projections (2025-2033). It meticulously examines market dynamics, growth trends, regional dominance, product landscape, key players, and emerging opportunities within the parent market of tableware and the child market of ceramic tableware. The report is invaluable for industry professionals, investors, and strategic decision-makers seeking a thorough understanding of this evolving sector. The market size is projected to reach xx Million units by 2033.
Ceramic Tableware Market Dynamics & Structure
The global ceramic tableware market is characterized by a moderately concentrated landscape, with several major players holding significant market share. However, the presence of numerous smaller regional players and emerging brands introduces a degree of fragmentation. Technological innovation, particularly in materials science and manufacturing processes, is a key driver, enabling the creation of more durable, aesthetically pleasing, and functional tableware. Regulatory frameworks related to food safety and environmental sustainability exert influence, impacting material choices and manufacturing practices. The market also faces competition from substitute materials like melamine and plastic, particularly in the commercial sector. End-user demographics, with a shift towards younger consumers prioritizing aesthetics and sustainability, are shaping demand. Mergers and acquisitions (M&A) activity within the sector has been moderate, with larger players strategically acquiring smaller companies to expand their product portfolios and geographic reach.
- Market Concentration: Moderately concentrated, with a xx% market share held by the top 5 players in 2025.
- Technological Innovation: Focus on lightweight, durable materials; eco-friendly production methods.
- Regulatory Framework: Stringent food safety regulations and growing emphasis on sustainable practices.
- Competitive Substitutes: Melamine, plastic, and other materials posing competitive pressure, especially in commercial segments.
- End-User Demographics: Growing demand from millennials and Gen Z, prioritizing aesthetics and sustainability.
- M&A Trends: Moderate activity, with strategic acquisitions to expand product portfolios and market reach. An estimated xx M&A deals occurred between 2019 and 2024.
Ceramic Tableware Market Growth Trends & Insights
The global ceramic tableware market experienced robust growth between 2019 and 2024, driven by factors such as rising disposable incomes, changing lifestyles, and increasing urbanization. The market size is estimated at xx Million units in 2025, exhibiting a CAGR of xx% during the historical period. Technological advancements, such as the introduction of innovative designs and materials, have significantly contributed to market expansion. Consumer behavior is shifting towards premium and specialized tableware, reflecting a growing preference for personalized dining experiences. Adoption rates for sustainable and ethically sourced ceramic tableware are increasing, prompting manufacturers to adopt eco-friendly practices. Disruptions in the supply chain due to geopolitical events and the COVID-19 pandemic have temporarily impacted production and distribution, however the market is expected to recover and maintain a steady growth trajectory. The forecast period (2025-2033) projects sustained growth driven by continued consumer demand and technological innovation.
Dominant Regions, Countries, or Segments in Ceramic Tableware Market
The North American and European markets currently dominate the global ceramic tableware market, driven by strong consumer demand, well-established distribution networks, and a high degree of brand awareness. Within these regions, the household segment accounts for the largest share of demand. However, significant growth potential exists in Asia-Pacific, particularly in emerging economies like India and China. The Porcelain and Bone China segment holds a larger market share than Stoneware, reflecting consumer preference for higher-end tableware. Supermarkets and hypermarkets remain the primary distribution channel, although online sales are growing rapidly.
- Leading Regions: North America and Europe (holding a combined xx% market share in 2025).
- High-Growth Regions: Asia-Pacific, driven by rising disposable incomes and urbanization.
- Dominant Segment (Type): Porcelain and Bone China (xx% market share in 2025).
- Dominant Segment (End User): Household (xx% market share in 2025).
- Dominant Segment (Distribution Channel): Supermarkets & Hypermarkets (xx% market share in 2025).
- Key Drivers (Asia-Pacific): Rising middle class, increasing disposable income, and growing urbanization.
- Key Drivers (Europe/North America): Strong consumer demand, established distribution networks, and high brand awareness.
Ceramic Tableware Market Product Landscape
The ceramic tableware market offers a diverse range of products, including dinnerware sets, individual pieces (plates, bowls, cups), and specialized items like tea sets and serving dishes. Innovations focus on improved durability, lightweight designs, enhanced aesthetics (unique shapes, colors, patterns), and incorporation of sustainable materials. Manufacturers are increasingly emphasizing unique selling propositions, such as artisan craftsmanship, eco-friendly production, and health-conscious material choices. Technological advancements involve incorporating antimicrobial properties and using advanced glazing techniques for improved durability and stain resistance.
Key Drivers, Barriers & Challenges in Ceramic Tableware Market
Key Drivers: Rising disposable incomes, changing lifestyles, increasing urbanization, and growing preference for aesthetically pleasing and functional tableware are major drivers. Technological innovation, such as the development of new materials and production techniques, is also fueling market expansion. Government initiatives promoting local industries and sustainable practices in certain regions further stimulate growth.
Key Barriers & Challenges: Fluctuations in raw material prices, competition from substitute materials (plastic, melamine), and stringent environmental regulations can pose challenges. Supply chain disruptions and geopolitical instability also impact production and distribution. The high energy consumption involved in ceramic production presents an environmental concern. Competition from lower-cost producers in emerging markets also adds pressure.
Emerging Opportunities in Ceramic Tableware Market
Untapped markets in developing economies, particularly in Africa and South America, present significant growth potential. Opportunities exist for developing specialized tableware for niche markets, such as eco-conscious consumers, and for creating customized or personalized tableware options. Growing interest in sustainable and ethically sourced materials provides opportunities for companies that prioritize environmentally friendly manufacturing practices.
Growth Accelerators in the Ceramic Tableware Market Industry
Technological breakthroughs in materials science and manufacturing processes, such as the development of lighter, stronger, and more durable ceramics, are key growth accelerators. Strategic partnerships between manufacturers and designers to create innovative and aesthetically pleasing products are also crucial. Market expansion into new geographic regions and targeting specific demographic segments contribute significantly to growth.
Key Players Shaping the Ceramic Tableware Market Market
- Portmeirion Group PLC
- The Oneida Group
- Rosenthal GmbH
- Lenox
- Meissen
- Libbey
- Seltmann Weiden
- RAK Porcelain
- Narumi
- KAHLA Porzellan
- WMF
- SCHONWALD
- Churchill China
- Villeroy & Boch
- TATA ceramics
- Sitong Group
- Fiskars Group
Notable Milestones in Ceramic Tableware Market Sector
- 2020: Increased adoption of e-commerce platforms by major players.
- 2021: Launch of several sustainable and ethically sourced tableware lines by key manufacturers.
- 2022: Several mergers and acquisitions aimed at expanding product portfolios and geographical reach.
- 2023: Introduction of innovative materials with enhanced durability and antimicrobial properties.
- 2024: Growing focus on customization and personalization of tableware.
In-Depth Ceramic Tableware Market Market Outlook
The future of the ceramic tableware market appears promising, with sustained growth expected driven by increasing consumer demand, technological advancements, and market expansion into new regions. Strategic partnerships, innovations in sustainable materials, and a focus on customization and personalization will play a key role in shaping the future market landscape. The market's strong growth trajectory is expected to continue into the forecast period, offering attractive opportunities for both established players and new entrants.
Ceramic Tableware Market Segmentation
-
1. Type
- 1.1. Porcelain and Bone China
- 1.2. Stoneware (Ceramic)
- 1.3. Others
-
2. End User
- 2.1. Household
-
2.2. Commercial
- 2.2.1. Accommodation and Hospitality Segment
- 2.2.2. Food Service Segment
- 2.2.3. Others
-
3. Distribution Channel
- 3.1. Supermarkets & Hypermarkets
- 3.2. Specialty Stores
- 3.3. Wholesalers
- 3.4. Online
- 3.5. Others
Ceramic Tableware Market Segmentation By Geography
- 1. North America
- 2. Asia Pacific
- 3. Europe
- 4. Latin America
- 5. Middle East and Africa
Ceramic Tableware Market Regional Market Share
Geographic Coverage of Ceramic Tableware Market
Ceramic Tableware Market REPORT HIGHLIGHTS
| Aspects | Details |
|---|---|
| Study Period | 2020-2034 |
| Base Year | 2025 |
| Estimated Year | 2026 |
| Forecast Period | 2026-2034 |
| Historical Period | 2020-2025 |
| Growth Rate | CAGR of 6.21% from 2020-2034 |
| Segmentation |
|
Table of Contents
- 1. Introduction
- 1.1. Research Scope
- 1.2. Market Segmentation
- 1.3. Research Objective
- 1.4. Definitions and Assumptions
- 2. Executive Summary
- 2.1. Market Snapshot
- 3. Market Dynamics
- 3.1. Market Drivers
- 3.2. Market Restrains
- 3.3. Market Trends
- 3.4. Market Opportunities
- 4. Market Factor Analysis
- 4.1. Porters Five Forces
- 4.1.1. Bargaining Power of Suppliers
- 4.1.2. Bargaining Power of Buyers
- 4.1.3. Threat of New Entrants
- 4.1.4. Threat of Substitutes
- 4.1.5. Competitive Rivalry
- 4.2. PESTEL analysis
- 4.3. BCG Analysis
- 4.3.1. Stars (High Growth, High Market Share)
- 4.3.2. Cash Cows (Low Growth, High Market Share)
- 4.3.3. Question Mark (High Growth, Low Market Share)
- 4.3.4. Dogs (Low Growth, Low Market Share)
- 4.4. Ansoff Matrix Analysis
- 4.5. Supply Chain Analysis
- 4.6. Regulatory Landscape
- 4.7. Current Market Potential and Opportunity Assessment (TAM–SAM–SOM Framework)
- 4.8. IMR Analyst Note
- 4.1. Porters Five Forces
- 5. Market Analysis, Insights and Forecast 2021-2033
- 5.1. Market Analysis, Insights and Forecast - by Type
- 5.1.1. Porcelain and Bone China
- 5.1.2. Stoneware (Ceramic)
- 5.1.3. Others
- 5.2. Market Analysis, Insights and Forecast - by End User
- 5.2.1. Household
- 5.2.2. Commercial
- 5.2.2.1. Accommodation and Hospitality Segment
- 5.2.2.2. Food Service Segment
- 5.2.2.3. Others
- 5.3. Market Analysis, Insights and Forecast - by Distribution Channel
- 5.3.1. Supermarkets & Hypermarkets
- 5.3.2. Specialty Stores
- 5.3.3. Wholesalers
- 5.3.4. Online
- 5.3.5. Others
- 5.4. Market Analysis, Insights and Forecast - by Region
- 5.4.1. North America
- 5.4.2. Asia Pacific
- 5.4.3. Europe
- 5.4.4. Latin America
- 5.4.5. Middle East and Africa
- 5.1. Market Analysis, Insights and Forecast - by Type
- 6. Global Ceramic Tableware Market Analysis, Insights and Forecast, 2021-2033
- 6.1. Market Analysis, Insights and Forecast - by Type
- 6.1.1. Porcelain and Bone China
- 6.1.2. Stoneware (Ceramic)
- 6.1.3. Others
- 6.2. Market Analysis, Insights and Forecast - by End User
- 6.2.1. Household
- 6.2.2. Commercial
- 6.2.2.1. Accommodation and Hospitality Segment
- 6.2.2.2. Food Service Segment
- 6.2.2.3. Others
- 6.3. Market Analysis, Insights and Forecast - by Distribution Channel
- 6.3.1. Supermarkets & Hypermarkets
- 6.3.2. Specialty Stores
- 6.3.3. Wholesalers
- 6.3.4. Online
- 6.3.5. Others
- 6.1. Market Analysis, Insights and Forecast - by Type
- 7. North America Ceramic Tableware Market Analysis, Insights and Forecast, 2020-2032
- 7.1. Market Analysis, Insights and Forecast - by Type
- 7.1.1. Porcelain and Bone China
- 7.1.2. Stoneware (Ceramic)
- 7.1.3. Others
- 7.2. Market Analysis, Insights and Forecast - by End User
- 7.2.1. Household
- 7.2.2. Commercial
- 7.2.2.1. Accommodation and Hospitality Segment
- 7.2.2.2. Food Service Segment
- 7.2.2.3. Others
- 7.3. Market Analysis, Insights and Forecast - by Distribution Channel
- 7.3.1. Supermarkets & Hypermarkets
- 7.3.2. Specialty Stores
- 7.3.3. Wholesalers
- 7.3.4. Online
- 7.3.5. Others
- 7.1. Market Analysis, Insights and Forecast - by Type
- 8. Asia Pacific Ceramic Tableware Market Analysis, Insights and Forecast, 2020-2032
- 8.1. Market Analysis, Insights and Forecast - by Type
- 8.1.1. Porcelain and Bone China
- 8.1.2. Stoneware (Ceramic)
- 8.1.3. Others
- 8.2. Market Analysis, Insights and Forecast - by End User
- 8.2.1. Household
- 8.2.2. Commercial
- 8.2.2.1. Accommodation and Hospitality Segment
- 8.2.2.2. Food Service Segment
- 8.2.2.3. Others
- 8.3. Market Analysis, Insights and Forecast - by Distribution Channel
- 8.3.1. Supermarkets & Hypermarkets
- 8.3.2. Specialty Stores
- 8.3.3. Wholesalers
- 8.3.4. Online
- 8.3.5. Others
- 8.1. Market Analysis, Insights and Forecast - by Type
- 9. Europe Ceramic Tableware Market Analysis, Insights and Forecast, 2020-2032
- 9.1. Market Analysis, Insights and Forecast - by Type
- 9.1.1. Porcelain and Bone China
- 9.1.2. Stoneware (Ceramic)
- 9.1.3. Others
- 9.2. Market Analysis, Insights and Forecast - by End User
- 9.2.1. Household
- 9.2.2. Commercial
- 9.2.2.1. Accommodation and Hospitality Segment
- 9.2.2.2. Food Service Segment
- 9.2.2.3. Others
- 9.3. Market Analysis, Insights and Forecast - by Distribution Channel
- 9.3.1. Supermarkets & Hypermarkets
- 9.3.2. Specialty Stores
- 9.3.3. Wholesalers
- 9.3.4. Online
- 9.3.5. Others
- 9.1. Market Analysis, Insights and Forecast - by Type
- 10. Latin America Ceramic Tableware Market Analysis, Insights and Forecast, 2020-2032
- 10.1. Market Analysis, Insights and Forecast - by Type
- 10.1.1. Porcelain and Bone China
- 10.1.2. Stoneware (Ceramic)
- 10.1.3. Others
- 10.2. Market Analysis, Insights and Forecast - by End User
- 10.2.1. Household
- 10.2.2. Commercial
- 10.2.2.1. Accommodation and Hospitality Segment
- 10.2.2.2. Food Service Segment
- 10.2.2.3. Others
- 10.3. Market Analysis, Insights and Forecast - by Distribution Channel
- 10.3.1. Supermarkets & Hypermarkets
- 10.3.2. Specialty Stores
- 10.3.3. Wholesalers
- 10.3.4. Online
- 10.3.5. Others
- 10.1. Market Analysis, Insights and Forecast - by Type
- 11. Middle East and Africa Ceramic Tableware Market Analysis, Insights and Forecast, 2020-2032
- 11.1. Market Analysis, Insights and Forecast - by Type
- 11.1.1. Porcelain and Bone China
- 11.1.2. Stoneware (Ceramic)
- 11.1.3. Others
- 11.2. Market Analysis, Insights and Forecast - by End User
- 11.2.1. Household
- 11.2.2. Commercial
- 11.2.2.1. Accommodation and Hospitality Segment
- 11.2.2.2. Food Service Segment
- 11.2.2.3. Others
- 11.3. Market Analysis, Insights and Forecast - by Distribution Channel
- 11.3.1. Supermarkets & Hypermarkets
- 11.3.2. Specialty Stores
- 11.3.3. Wholesalers
- 11.3.4. Online
- 11.3.5. Others
- 11.1. Market Analysis, Insights and Forecast - by Type
- 12. Competitive Analysis
- 12.1. Company Profiles
- 12.1.1 Portmeirion Group PLC
- 12.1.1.1. Company Overview
- 12.1.1.2. Products
- 12.1.1.3. Company Financials
- 12.1.1.4. SWOT Analysis
- 12.1.2 The Oneida Group
- 12.1.2.1. Company Overview
- 12.1.2.2. Products
- 12.1.2.3. Company Financials
- 12.1.2.4. SWOT Analysis
- 12.1.3 Rosenthal GmbH
- 12.1.3.1. Company Overview
- 12.1.3.2. Products
- 12.1.3.3. Company Financials
- 12.1.3.4. SWOT Analysis
- 12.1.4 Lenox
- 12.1.4.1. Company Overview
- 12.1.4.2. Products
- 12.1.4.3. Company Financials
- 12.1.4.4. SWOT Analysis
- 12.1.5 Meissen
- 12.1.5.1. Company Overview
- 12.1.5.2. Products
- 12.1.5.3. Company Financials
- 12.1.5.4. SWOT Analysis
- 12.1.6 Libbey
- 12.1.6.1. Company Overview
- 12.1.6.2. Products
- 12.1.6.3. Company Financials
- 12.1.6.4. SWOT Analysis
- 12.1.7 Seltmann Weiden
- 12.1.7.1. Company Overview
- 12.1.7.2. Products
- 12.1.7.3. Company Financials
- 12.1.7.4. SWOT Analysis
- 12.1.8 RAK Porcelain
- 12.1.8.1. Company Overview
- 12.1.8.2. Products
- 12.1.8.3. Company Financials
- 12.1.8.4. SWOT Analysis
- 12.1.9 Narumi
- 12.1.9.1. Company Overview
- 12.1.9.2. Products
- 12.1.9.3. Company Financials
- 12.1.9.4. SWOT Analysis
- 12.1.10 KAHLA Porzellan
- 12.1.10.1. Company Overview
- 12.1.10.2. Products
- 12.1.10.3. Company Financials
- 12.1.10.4. SWOT Analysis
- 12.1.11 WMF
- 12.1.11.1. Company Overview
- 12.1.11.2. Products
- 12.1.11.3. Company Financials
- 12.1.11.4. SWOT Analysis
- 12.1.12 SCHONWALD
- 12.1.12.1. Company Overview
- 12.1.12.2. Products
- 12.1.12.3. Company Financials
- 12.1.12.4. SWOT Analysis
- 12.1.13 Churchill China
- 12.1.13.1. Company Overview
- 12.1.13.2. Products
- 12.1.13.3. Company Financials
- 12.1.13.4. SWOT Analysis
- 12.1.14 Villeroy & Boch
- 12.1.14.1. Company Overview
- 12.1.14.2. Products
- 12.1.14.3. Company Financials
- 12.1.14.4. SWOT Analysis
- 12.1.15 TATA ceramics
- 12.1.15.1. Company Overview
- 12.1.15.2. Products
- 12.1.15.3. Company Financials
- 12.1.15.4. SWOT Analysis
- 12.1.16 Sitong Group
- 12.1.16.1. Company Overview
- 12.1.16.2. Products
- 12.1.16.3. Company Financials
- 12.1.16.4. SWOT Analysis
- 12.1.17 Fiskars Group
- 12.1.17.1. Company Overview
- 12.1.17.2. Products
- 12.1.17.3. Company Financials
- 12.1.17.4. SWOT Analysis
- 12.1.1 Portmeirion Group PLC
- 12.2. Market Entropy
- 12.2.1 Company's Key Areas Served
- 12.2.2 Recent Developments
- 12.3. Company Market Share Analysis 2025
- 12.3.1 Top 5 Companies Market Share Analysis
- 12.3.2 Top 3 Companies Market Share Analysis
- 12.4. List of Potential Customers
- 13. Research Methodology
List of Figures
- Figure 1: Global Ceramic Tableware Market Revenue Breakdown (Million, %) by Region 2025 & 2033
- Figure 2: Global Ceramic Tableware Market Volume Breakdown (K Unit, %) by Region 2025 & 2033
- Figure 3: North America Ceramic Tableware Market Revenue (Million), by Type 2025 & 2033
- Figure 4: North America Ceramic Tableware Market Volume (K Unit), by Type 2025 & 2033
- Figure 5: North America Ceramic Tableware Market Revenue Share (%), by Type 2025 & 2033
- Figure 6: North America Ceramic Tableware Market Volume Share (%), by Type 2025 & 2033
- Figure 7: North America Ceramic Tableware Market Revenue (Million), by End User 2025 & 2033
- Figure 8: North America Ceramic Tableware Market Volume (K Unit), by End User 2025 & 2033
- Figure 9: North America Ceramic Tableware Market Revenue Share (%), by End User 2025 & 2033
- Figure 10: North America Ceramic Tableware Market Volume Share (%), by End User 2025 & 2033
- Figure 11: North America Ceramic Tableware Market Revenue (Million), by Distribution Channel 2025 & 2033
- Figure 12: North America Ceramic Tableware Market Volume (K Unit), by Distribution Channel 2025 & 2033
- Figure 13: North America Ceramic Tableware Market Revenue Share (%), by Distribution Channel 2025 & 2033
- Figure 14: North America Ceramic Tableware Market Volume Share (%), by Distribution Channel 2025 & 2033
- Figure 15: North America Ceramic Tableware Market Revenue (Million), by Country 2025 & 2033
- Figure 16: North America Ceramic Tableware Market Volume (K Unit), by Country 2025 & 2033
- Figure 17: North America Ceramic Tableware Market Revenue Share (%), by Country 2025 & 2033
- Figure 18: North America Ceramic Tableware Market Volume Share (%), by Country 2025 & 2033
- Figure 19: Asia Pacific Ceramic Tableware Market Revenue (Million), by Type 2025 & 2033
- Figure 20: Asia Pacific Ceramic Tableware Market Volume (K Unit), by Type 2025 & 2033
- Figure 21: Asia Pacific Ceramic Tableware Market Revenue Share (%), by Type 2025 & 2033
- Figure 22: Asia Pacific Ceramic Tableware Market Volume Share (%), by Type 2025 & 2033
- Figure 23: Asia Pacific Ceramic Tableware Market Revenue (Million), by End User 2025 & 2033
- Figure 24: Asia Pacific Ceramic Tableware Market Volume (K Unit), by End User 2025 & 2033
- Figure 25: Asia Pacific Ceramic Tableware Market Revenue Share (%), by End User 2025 & 2033
- Figure 26: Asia Pacific Ceramic Tableware Market Volume Share (%), by End User 2025 & 2033
- Figure 27: Asia Pacific Ceramic Tableware Market Revenue (Million), by Distribution Channel 2025 & 2033
- Figure 28: Asia Pacific Ceramic Tableware Market Volume (K Unit), by Distribution Channel 2025 & 2033
- Figure 29: Asia Pacific Ceramic Tableware Market Revenue Share (%), by Distribution Channel 2025 & 2033
- Figure 30: Asia Pacific Ceramic Tableware Market Volume Share (%), by Distribution Channel 2025 & 2033
- Figure 31: Asia Pacific Ceramic Tableware Market Revenue (Million), by Country 2025 & 2033
- Figure 32: Asia Pacific Ceramic Tableware Market Volume (K Unit), by Country 2025 & 2033
- Figure 33: Asia Pacific Ceramic Tableware Market Revenue Share (%), by Country 2025 & 2033
- Figure 34: Asia Pacific Ceramic Tableware Market Volume Share (%), by Country 2025 & 2033
- Figure 35: Europe Ceramic Tableware Market Revenue (Million), by Type 2025 & 2033
- Figure 36: Europe Ceramic Tableware Market Volume (K Unit), by Type 2025 & 2033
- Figure 37: Europe Ceramic Tableware Market Revenue Share (%), by Type 2025 & 2033
- Figure 38: Europe Ceramic Tableware Market Volume Share (%), by Type 2025 & 2033
- Figure 39: Europe Ceramic Tableware Market Revenue (Million), by End User 2025 & 2033
- Figure 40: Europe Ceramic Tableware Market Volume (K Unit), by End User 2025 & 2033
- Figure 41: Europe Ceramic Tableware Market Revenue Share (%), by End User 2025 & 2033
- Figure 42: Europe Ceramic Tableware Market Volume Share (%), by End User 2025 & 2033
- Figure 43: Europe Ceramic Tableware Market Revenue (Million), by Distribution Channel 2025 & 2033
- Figure 44: Europe Ceramic Tableware Market Volume (K Unit), by Distribution Channel 2025 & 2033
- Figure 45: Europe Ceramic Tableware Market Revenue Share (%), by Distribution Channel 2025 & 2033
- Figure 46: Europe Ceramic Tableware Market Volume Share (%), by Distribution Channel 2025 & 2033
- Figure 47: Europe Ceramic Tableware Market Revenue (Million), by Country 2025 & 2033
- Figure 48: Europe Ceramic Tableware Market Volume (K Unit), by Country 2025 & 2033
- Figure 49: Europe Ceramic Tableware Market Revenue Share (%), by Country 2025 & 2033
- Figure 50: Europe Ceramic Tableware Market Volume Share (%), by Country 2025 & 2033
- Figure 51: Latin America Ceramic Tableware Market Revenue (Million), by Type 2025 & 2033
- Figure 52: Latin America Ceramic Tableware Market Volume (K Unit), by Type 2025 & 2033
- Figure 53: Latin America Ceramic Tableware Market Revenue Share (%), by Type 2025 & 2033
- Figure 54: Latin America Ceramic Tableware Market Volume Share (%), by Type 2025 & 2033
- Figure 55: Latin America Ceramic Tableware Market Revenue (Million), by End User 2025 & 2033
- Figure 56: Latin America Ceramic Tableware Market Volume (K Unit), by End User 2025 & 2033
- Figure 57: Latin America Ceramic Tableware Market Revenue Share (%), by End User 2025 & 2033
- Figure 58: Latin America Ceramic Tableware Market Volume Share (%), by End User 2025 & 2033
- Figure 59: Latin America Ceramic Tableware Market Revenue (Million), by Distribution Channel 2025 & 2033
- Figure 60: Latin America Ceramic Tableware Market Volume (K Unit), by Distribution Channel 2025 & 2033
- Figure 61: Latin America Ceramic Tableware Market Revenue Share (%), by Distribution Channel 2025 & 2033
- Figure 62: Latin America Ceramic Tableware Market Volume Share (%), by Distribution Channel 2025 & 2033
- Figure 63: Latin America Ceramic Tableware Market Revenue (Million), by Country 2025 & 2033
- Figure 64: Latin America Ceramic Tableware Market Volume (K Unit), by Country 2025 & 2033
- Figure 65: Latin America Ceramic Tableware Market Revenue Share (%), by Country 2025 & 2033
- Figure 66: Latin America Ceramic Tableware Market Volume Share (%), by Country 2025 & 2033
- Figure 67: Middle East and Africa Ceramic Tableware Market Revenue (Million), by Type 2025 & 2033
- Figure 68: Middle East and Africa Ceramic Tableware Market Volume (K Unit), by Type 2025 & 2033
- Figure 69: Middle East and Africa Ceramic Tableware Market Revenue Share (%), by Type 2025 & 2033
- Figure 70: Middle East and Africa Ceramic Tableware Market Volume Share (%), by Type 2025 & 2033
- Figure 71: Middle East and Africa Ceramic Tableware Market Revenue (Million), by End User 2025 & 2033
- Figure 72: Middle East and Africa Ceramic Tableware Market Volume (K Unit), by End User 2025 & 2033
- Figure 73: Middle East and Africa Ceramic Tableware Market Revenue Share (%), by End User 2025 & 2033
- Figure 74: Middle East and Africa Ceramic Tableware Market Volume Share (%), by End User 2025 & 2033
- Figure 75: Middle East and Africa Ceramic Tableware Market Revenue (Million), by Distribution Channel 2025 & 2033
- Figure 76: Middle East and Africa Ceramic Tableware Market Volume (K Unit), by Distribution Channel 2025 & 2033
- Figure 77: Middle East and Africa Ceramic Tableware Market Revenue Share (%), by Distribution Channel 2025 & 2033
- Figure 78: Middle East and Africa Ceramic Tableware Market Volume Share (%), by Distribution Channel 2025 & 2033
- Figure 79: Middle East and Africa Ceramic Tableware Market Revenue (Million), by Country 2025 & 2033
- Figure 80: Middle East and Africa Ceramic Tableware Market Volume (K Unit), by Country 2025 & 2033
- Figure 81: Middle East and Africa Ceramic Tableware Market Revenue Share (%), by Country 2025 & 2033
- Figure 82: Middle East and Africa Ceramic Tableware Market Volume Share (%), by Country 2025 & 2033
List of Tables
- Table 1: Global Ceramic Tableware Market Revenue Million Forecast, by Type 2020 & 2033
- Table 2: Global Ceramic Tableware Market Volume K Unit Forecast, by Type 2020 & 2033
- Table 3: Global Ceramic Tableware Market Revenue Million Forecast, by End User 2020 & 2033
- Table 4: Global Ceramic Tableware Market Volume K Unit Forecast, by End User 2020 & 2033
- Table 5: Global Ceramic Tableware Market Revenue Million Forecast, by Distribution Channel 2020 & 2033
- Table 6: Global Ceramic Tableware Market Volume K Unit Forecast, by Distribution Channel 2020 & 2033
- Table 7: Global Ceramic Tableware Market Revenue Million Forecast, by Region 2020 & 2033
- Table 8: Global Ceramic Tableware Market Volume K Unit Forecast, by Region 2020 & 2033
- Table 9: Global Ceramic Tableware Market Revenue Million Forecast, by Type 2020 & 2033
- Table 10: Global Ceramic Tableware Market Volume K Unit Forecast, by Type 2020 & 2033
- Table 11: Global Ceramic Tableware Market Revenue Million Forecast, by End User 2020 & 2033
- Table 12: Global Ceramic Tableware Market Volume K Unit Forecast, by End User 2020 & 2033
- Table 13: Global Ceramic Tableware Market Revenue Million Forecast, by Distribution Channel 2020 & 2033
- Table 14: Global Ceramic Tableware Market Volume K Unit Forecast, by Distribution Channel 2020 & 2033
- Table 15: Global Ceramic Tableware Market Revenue Million Forecast, by Country 2020 & 2033
- Table 16: Global Ceramic Tableware Market Volume K Unit Forecast, by Country 2020 & 2033
- Table 17: Global Ceramic Tableware Market Revenue Million Forecast, by Type 2020 & 2033
- Table 18: Global Ceramic Tableware Market Volume K Unit Forecast, by Type 2020 & 2033
- Table 19: Global Ceramic Tableware Market Revenue Million Forecast, by End User 2020 & 2033
- Table 20: Global Ceramic Tableware Market Volume K Unit Forecast, by End User 2020 & 2033
- Table 21: Global Ceramic Tableware Market Revenue Million Forecast, by Distribution Channel 2020 & 2033
- Table 22: Global Ceramic Tableware Market Volume K Unit Forecast, by Distribution Channel 2020 & 2033
- Table 23: Global Ceramic Tableware Market Revenue Million Forecast, by Country 2020 & 2033
- Table 24: Global Ceramic Tableware Market Volume K Unit Forecast, by Country 2020 & 2033
- Table 25: Global Ceramic Tableware Market Revenue Million Forecast, by Type 2020 & 2033
- Table 26: Global Ceramic Tableware Market Volume K Unit Forecast, by Type 2020 & 2033
- Table 27: Global Ceramic Tableware Market Revenue Million Forecast, by End User 2020 & 2033
- Table 28: Global Ceramic Tableware Market Volume K Unit Forecast, by End User 2020 & 2033
- Table 29: Global Ceramic Tableware Market Revenue Million Forecast, by Distribution Channel 2020 & 2033
- Table 30: Global Ceramic Tableware Market Volume K Unit Forecast, by Distribution Channel 2020 & 2033
- Table 31: Global Ceramic Tableware Market Revenue Million Forecast, by Country 2020 & 2033
- Table 32: Global Ceramic Tableware Market Volume K Unit Forecast, by Country 2020 & 2033
- Table 33: Global Ceramic Tableware Market Revenue Million Forecast, by Type 2020 & 2033
- Table 34: Global Ceramic Tableware Market Volume K Unit Forecast, by Type 2020 & 2033
- Table 35: Global Ceramic Tableware Market Revenue Million Forecast, by End User 2020 & 2033
- Table 36: Global Ceramic Tableware Market Volume K Unit Forecast, by End User 2020 & 2033
- Table 37: Global Ceramic Tableware Market Revenue Million Forecast, by Distribution Channel 2020 & 2033
- Table 38: Global Ceramic Tableware Market Volume K Unit Forecast, by Distribution Channel 2020 & 2033
- Table 39: Global Ceramic Tableware Market Revenue Million Forecast, by Country 2020 & 2033
- Table 40: Global Ceramic Tableware Market Volume K Unit Forecast, by Country 2020 & 2033
- Table 41: Global Ceramic Tableware Market Revenue Million Forecast, by Type 2020 & 2033
- Table 42: Global Ceramic Tableware Market Volume K Unit Forecast, by Type 2020 & 2033
- Table 43: Global Ceramic Tableware Market Revenue Million Forecast, by End User 2020 & 2033
- Table 44: Global Ceramic Tableware Market Volume K Unit Forecast, by End User 2020 & 2033
- Table 45: Global Ceramic Tableware Market Revenue Million Forecast, by Distribution Channel 2020 & 2033
- Table 46: Global Ceramic Tableware Market Volume K Unit Forecast, by Distribution Channel 2020 & 2033
- Table 47: Global Ceramic Tableware Market Revenue Million Forecast, by Country 2020 & 2033
- Table 48: Global Ceramic Tableware Market Volume K Unit Forecast, by Country 2020 & 2033
Frequently Asked Questions
1. What is the projected Compound Annual Growth Rate (CAGR) of the Ceramic Tableware Market?
The projected CAGR is approximately 6.21%.
2. Which companies are prominent players in the Ceramic Tableware Market?
Key companies in the market include Portmeirion Group PLC, The Oneida Group, Rosenthal GmbH, Lenox, Meissen, Libbey, Seltmann Weiden, RAK Porcelain, Narumi, KAHLA Porzellan, WMF, SCHONWALD, Churchill China, Villeroy & Boch, TATA ceramics, Sitong Group, Fiskars Group.
3. What are the main segments of the Ceramic Tableware Market?
The market segments include Type, End User, Distribution Channel.
4. Can you provide details about the market size?
The market size is estimated to be USD 58.29 Million as of 2022.
5. What are some drivers contributing to market growth?
Increasing Demand for Office Supplies; Growing E-commerce Trends.
6. What are the notable trends driving market growth?
Rapid Growth of Online Sales is Driving the Market.
7. Are there any restraints impacting market growth?
Increasing Digitization of Work and Communication.
8. Can you provide examples of recent developments in the market?
N/A
9. What pricing options are available for accessing the report?
Pricing options include single-user, multi-user, and enterprise licenses priced at USD 4750, USD 5250, and USD 8750 respectively.
10. Is the market size provided in terms of value or volume?
The market size is provided in terms of value, measured in Million and volume, measured in K Unit.
11. Are there any specific market keywords associated with the report?
Yes, the market keyword associated with the report is "Ceramic Tableware Market," which aids in identifying and referencing the specific market segment covered.
12. How do I determine which pricing option suits my needs best?
The pricing options vary based on user requirements and access needs. Individual users may opt for single-user licenses, while businesses requiring broader access may choose multi-user or enterprise licenses for cost-effective access to the report.
13. Are there any additional resources or data provided in the Ceramic Tableware Market report?
While the report offers comprehensive insights, it's advisable to review the specific contents or supplementary materials provided to ascertain if additional resources or data are available.
14. How can I stay updated on further developments or reports in the Ceramic Tableware Market?
To stay informed about further developments, trends, and reports in the Ceramic Tableware Market, consider subscribing to industry newsletters, following relevant companies and organizations, or regularly checking reputable industry news sources and publications.
Methodology
Step 1 - Identification of Relevant Samples Size from Population Database


Step 2 - Approaches for Defining Global Market Size (Value, Volume* & Price*)

Note*: In applicable scenarios
Step 3 - Data Sources
Primary Research
- Web Analytics
- Survey Reports
- Research Institute
- Latest Research Reports
- Opinion Leaders
Secondary Research
- Annual Reports
- White Paper
- Latest Press Release
- Industry Association
- Paid Database
- Investor Presentations

Step 4 - Data Triangulation
Involves using different sources of information in order to increase the validity of a study
These sources are likely to be stakeholders in a program - participants, other researchers, program staff, other community members, and so on.
Then we put all data in single framework & apply various statistical tools to find out the dynamic on the market.
During the analysis stage, feedback from the stakeholder groups would be compared to determine areas of agreement as well as areas of divergence