

Key Insights
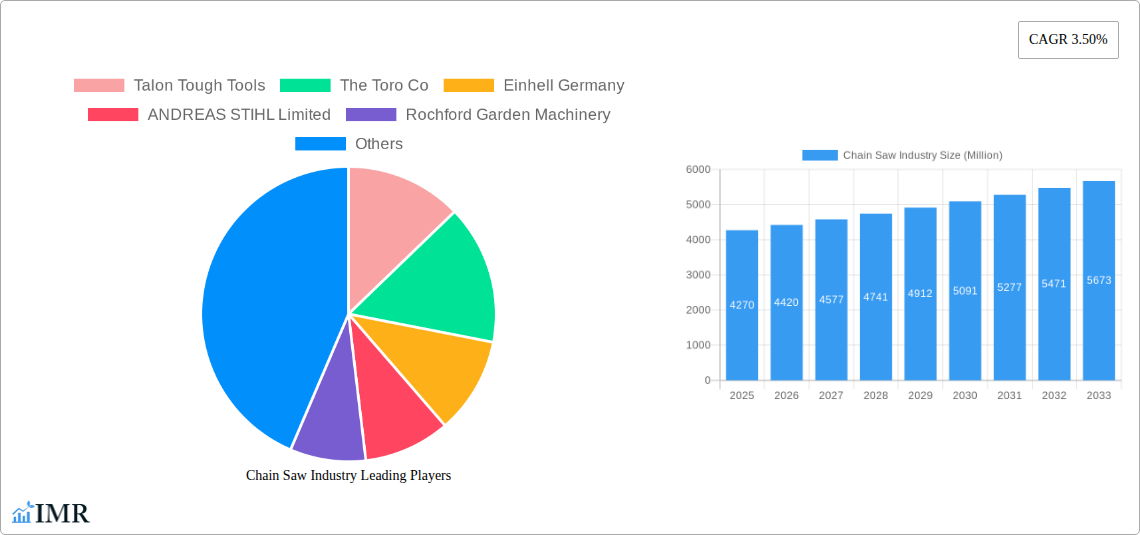
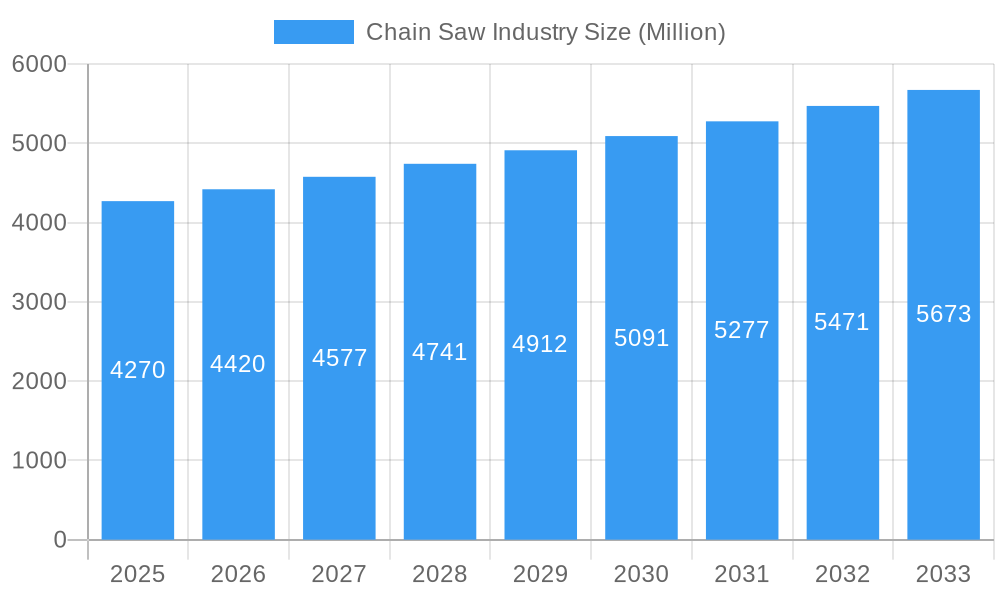
The global chainsaw market, valued at $4.27 billion in 2025, is projected to experience steady growth, driven by increasing demand from both residential and industrial sectors. The 3.50% CAGR indicates a consistent expansion through 2033, fueled by several key factors. Rising urbanization and landscaping trends are boosting residential chainsaw sales, while forestry, agriculture, and construction activities continue to drive demand in the industrial segment. The market is segmented by power source (gas-powered, electric-powered, battery-powered, and other) and application (residential and industrial). Gas-powered chainsaws currently dominate, but battery-powered models are gaining traction due to enhanced portability, reduced emissions, and quieter operation. This shift reflects a growing consumer preference for environmentally friendly and user-friendly equipment. While competition among established players like Stihl, Husqvarna, and Toro is intense, the market also presents opportunities for smaller companies specializing in niche segments or innovative technologies. Potential restraints include fluctuating raw material prices, stringent emission regulations, and concerns about workplace safety. However, ongoing technological advancements, focusing on improved performance, safety features, and reduced environmental impact, are expected to offset these challenges and sustain market growth. Regional growth is expected to be diverse, with established markets in North America and Europe witnessing steady expansion, while Asia-Pacific and South America are poised for significant growth due to increasing infrastructure development and rising disposable incomes.
Chain Saw Industry Market Size (In Billion)
The forecast period (2025-2033) suggests a gradual yet consistent upward trajectory for the chainsaw market. While precise figures for each segment and region require more detailed data, the current market dynamics and CAGR projection allow for a reasonable estimation of market expansion. The continued adoption of battery-powered models, coupled with the ongoing development of more efficient and eco-friendly chainsaw technology, is expected to be a key driver of this growth. The established presence of major players, combined with the entry of new entrants into niche markets, contributes to a healthy level of competition, further stimulating innovation and market expansion. Government initiatives promoting sustainable forestry and responsible land management practices will also play a significant role in shaping the future landscape of the chainsaw market.
Chain Saw Industry Company Market Share
Chain Saw Industry Market Report: 2019-2033
This comprehensive report provides an in-depth analysis of the global chain saw industry, encompassing market dynamics, growth trends, competitive landscape, and future outlook. The study period covers 2019-2033, with a base year of 2025 and a forecast period of 2025-2033. The report is essential for industry professionals, investors, and anyone seeking a thorough understanding of this dynamic market. It analyzes parent markets (outdoor power equipment) and child markets (forestry, landscaping, arboriculture) to provide a holistic view.
Chain Saw Industry Market Dynamics & Structure
The global chain saw market is characterized by a moderately concentrated landscape, with key players like STIHL, Husqvarna, and Bosch holding significant market share. Technological innovation, particularly in battery technology and emission reduction, is a major driver. Stringent environmental regulations in several regions are influencing product development and adoption, pushing manufacturers towards eco-friendly solutions. The market also faces competition from alternative tools, such as pole saws and hand tools, particularly in the residential segment. Demographic shifts, including an aging population in developed countries and a growing middle class in developing economies, are impacting demand patterns. M&A activity has been relatively stable in recent years, with a total of xx deals valued at approximately xx million USD during the historical period (2019-2024).
- Market Concentration: Moderately concentrated, with top 5 players holding approximately xx% market share.
- Technological Innovation: Focus on battery power, improved ergonomics, and reduced emissions.
- Regulatory Framework: Increasingly stringent emission and safety standards globally.
- Competitive Substitutes: Pole saws, hand saws, and other arboricultural tools.
- End-User Demographics: Growth driven by professional users and increasing DIY activities.
- M&A Trends: Relatively stable activity with xx deals completed between 2019-2024.
Chain Saw Industry Growth Trends & Insights
The global chain saw market experienced steady growth between 2019 and 2024, with a CAGR of xx%. This growth is attributed to increased demand from the professional forestry and landscaping sectors, as well as a rise in DIY projects among homeowners. The adoption rate of battery-powered chainsaws is increasing significantly, driven by advancements in battery technology and growing environmental awareness. However, consumer behavior is evolving, with a greater emphasis on safety features, user-friendliness, and ease of maintenance. The shift towards cordless models is expected to continue throughout the forecast period (2025-2033), contributing to a projected CAGR of xx% and market penetration reaching xx% by 2033.
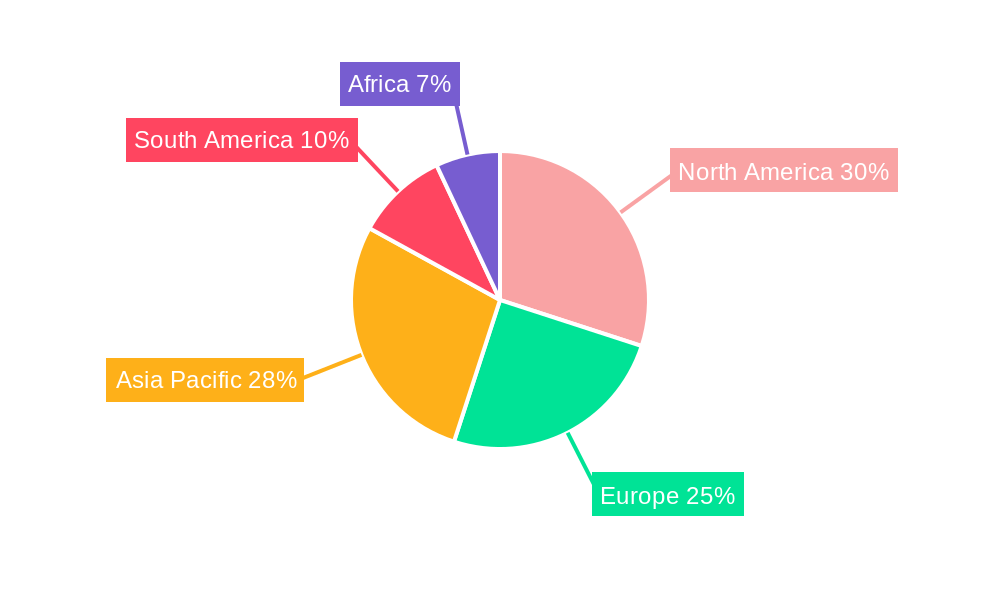
Dominant Regions, Countries, or Segments in Chain Saw Industry
North America and Europe currently dominate the chain saw market, driven by high per capita income, robust construction activity, and strong demand for landscaping services. However, rapidly developing economies in Asia-Pacific are witnessing significant growth, particularly in countries like China and India. Within product types, gas-powered chainsaws still hold the largest market share, but the battery-powered segment is experiencing the fastest growth. In terms of application, the industrial segment accounts for a larger share of revenue but the residential segment shows higher growth potential.
- Key Drivers (North America & Europe): High disposable income, developed infrastructure, strong landscaping sector.
- Key Drivers (Asia-Pacific): Increasing urbanization, rising disposable incomes, growing forestry and construction industries.
- Product Type Dominance: Gas-powered (currently dominant), Battery-powered (fastest growing).
- Application Dominance: Industrial (largest revenue), Residential (high growth).
Chain Saw Industry Product Landscape
The chain saw market offers a wide range of products, from basic residential models to sophisticated professional-grade tools. Recent innovations include improved cutting performance, enhanced safety features (such as chain brakes and anti-vibration systems), and lighter-weight designs. Battery-powered chainsaws are gaining popularity due to their reduced emissions, noise levels, and ease of use. The key selling propositions include enhanced power-to-weight ratios, improved ergonomics, and reduced maintenance requirements. The integration of smart technologies, such as Bluetooth connectivity for monitoring performance and maintenance, is also emerging.
Key Drivers, Barriers & Challenges in Chain Saw Industry
Key Drivers:
- Increasing demand from the construction and landscaping industries.
- Rising adoption of battery-powered chainsaws due to their environmental benefits.
- Technological advancements resulting in improved performance and safety.
Challenges:
- Fluctuations in raw material prices impacting manufacturing costs.
- Stringent emission regulations limiting the use of gas-powered chainsaws.
- Intense competition from established players and emerging brands.
- Supply chain disruptions and their impact on production and availability.
Emerging Opportunities in Chain Saw Industry
- Growing demand for lightweight and ergonomic designs catering to the needs of aging professionals.
- Expansion into developing markets with a focus on affordability and accessibility.
- Development of innovative applications in arboriculture and forestry.
- Opportunities for growth in the development and adoption of sustainably sourced materials in manufacturing.
Growth Accelerators in the Chain Saw Industry Industry
Technological advancements such as improved battery technology and enhanced cutting systems will continue to drive growth. Strategic partnerships and collaborations between manufacturers and technology providers will play a vital role in accelerating innovation and market penetration. Expansion into new geographical markets with untapped potential will also boost industry growth, particularly in emerging economies.
Key Players Shaping the Chain Saw Industry Market
- Talon Tough Tools
- The Toro Co
- Einhell Germany
- ANDREAS STIHL Limited
- Rochford Garden Machinery
- Robert Bosch GmbH
- SUMEC Group Corporation
- AL-KO Kober
- STIGA SpA
- Emak SPA
- Yamabiko Corp
- Stanley Black & Decker Inc
- Hitachi Ltd
- Husqvarna AB
- Blount International Inc
Notable Milestones in Chain Saw Industry Sector
- April 2023: Husqvarna launched T542i XP® and 542i XP®, the world's first battery chainsaws with a clutch, signifying a major advancement in battery-powered chainsaw technology.
- May 2023: Robert Bosch GmbH launched a new advanced cordless chainsaw (AdvancedChain 36V-35-40), strengthening its presence in the growing cordless segment.
In-Depth Chain Saw Industry Market Outlook
The chain saw market is poised for sustained growth, driven by ongoing technological innovation, expansion into new markets, and the increasing adoption of battery-powered models. Strategic partnerships and investments in research and development will be crucial for companies to maintain a competitive edge. The focus on sustainability and eco-friendly solutions will further shape the industry's trajectory in the coming years, creating significant opportunities for manufacturers who prioritize innovation and environmental responsibility.
Chain Saw Industry Segmentation
- 1. Production Analysis
- 2. Consumption Analysis
- 3. Import Market Analysis (Value & Volume)
- 4. Export Market Analysis (Value & Volume)
- 5. Price Trend Analysis
Chain Saw Industry Segmentation By Geography
-
1. North America
- 1.1. United States
- 1.2. Canada
- 1.3. Mexico
-
2. South America
- 2.1. Brazil
- 2.2. Argentina
- 2.3. Rest of South America
-
3. Europe
- 3.1. United Kingdom
- 3.2. Germany
- 3.3. France
- 3.4. Italy
- 3.5. Spain
- 3.6. Russia
- 3.7. Benelux
- 3.8. Nordics
- 3.9. Rest of Europe
-
4. Middle East & Africa
- 4.1. Turkey
- 4.2. Israel
- 4.3. GCC
- 4.4. North Africa
- 4.5. South Africa
- 4.6. Rest of Middle East & Africa
-
5. Asia Pacific
- 5.1. China
- 5.2. India
- 5.3. Japan
- 5.4. South Korea
- 5.5. ASEAN
- 5.6. Oceania
- 5.7. Rest of Asia Pacific
Chain Saw Industry Regional Market Share
Geographic Coverage of Chain Saw Industry
Chain Saw Industry REPORT HIGHLIGHTS
| Aspects | Details |
|---|---|
| Study Period | 2020-2034 |
| Base Year | 2025 |
| Estimated Year | 2026 |
| Forecast Period | 2026-2034 |
| Historical Period | 2020-2025 |
| Growth Rate | CAGR of 3.50% from 2020-2034 |
| Segmentation |
|
Table of Contents
- 1. Introduction
- 1.1. Research Scope
- 1.2. Market Segmentation
- 1.3. Research Objective
- 1.4. Definitions and Assumptions
- 2. Executive Summary
- 2.1. Market Snapshot
- 3. Market Dynamics
- 3.1. Market Drivers
- 3.2. Market Restrains
- 3.3. Market Trends
- 3.4. Market Opportunities
- 4. Market Factor Analysis
- 4.1. Porters Five Forces
- 4.1.1. Bargaining Power of Suppliers
- 4.1.2. Bargaining Power of Buyers
- 4.1.3. Threat of New Entrants
- 4.1.4. Threat of Substitutes
- 4.1.5. Competitive Rivalry
- 4.2. PESTEL analysis
- 4.3. BCG Analysis
- 4.3.1. Stars (High Growth, High Market Share)
- 4.3.2. Cash Cows (Low Growth, High Market Share)
- 4.3.3. Question Mark (High Growth, Low Market Share)
- 4.3.4. Dogs (Low Growth, Low Market Share)
- 4.4. Ansoff Matrix Analysis
- 4.5. Supply Chain Analysis
- 4.6. Regulatory Landscape
- 4.7. Current Market Potential and Opportunity Assessment (TAM–SAM–SOM Framework)
- 4.8. IMR Analyst Note
- 4.1. Porters Five Forces
- 5. Market Analysis, Insights and Forecast 2021-2033
- 5.1. Market Analysis, Insights and Forecast - by Production Analysis
- 5.2. Market Analysis, Insights and Forecast - by Consumption Analysis
- 5.3. Market Analysis, Insights and Forecast - by Import Market Analysis (Value & Volume)
- 5.4. Market Analysis, Insights and Forecast - by Export Market Analysis (Value & Volume)
- 5.5. Market Analysis, Insights and Forecast - by Price Trend Analysis
- 5.6. Market Analysis, Insights and Forecast - by Region
- 5.6.1. North America
- 5.6.2. South America
- 5.6.3. Europe
- 5.6.4. Middle East & Africa
- 5.6.5. Asia Pacific
- 6. Global Chain Saw Industry Analysis, Insights and Forecast, 2021-2033
- 6.1. Market Analysis, Insights and Forecast - by Production Analysis
- 6.2. Market Analysis, Insights and Forecast - by Consumption Analysis
- 6.3. Market Analysis, Insights and Forecast - by Import Market Analysis (Value & Volume)
- 6.4. Market Analysis, Insights and Forecast - by Export Market Analysis (Value & Volume)
- 6.5. Market Analysis, Insights and Forecast - by Price Trend Analysis
- 7. North America Chain Saw Industry Analysis, Insights and Forecast, 2020-2032
- 7.1. Market Analysis, Insights and Forecast - by Production Analysis
- 7.2. Market Analysis, Insights and Forecast - by Consumption Analysis
- 7.3. Market Analysis, Insights and Forecast - by Import Market Analysis (Value & Volume)
- 7.4. Market Analysis, Insights and Forecast - by Export Market Analysis (Value & Volume)
- 7.5. Market Analysis, Insights and Forecast - by Price Trend Analysis
- 8. South America Chain Saw Industry Analysis, Insights and Forecast, 2020-2032
- 8.1. Market Analysis, Insights and Forecast - by Production Analysis
- 8.2. Market Analysis, Insights and Forecast - by Consumption Analysis
- 8.3. Market Analysis, Insights and Forecast - by Import Market Analysis (Value & Volume)
- 8.4. Market Analysis, Insights and Forecast - by Export Market Analysis (Value & Volume)
- 8.5. Market Analysis, Insights and Forecast - by Price Trend Analysis
- 9. Europe Chain Saw Industry Analysis, Insights and Forecast, 2020-2032
- 9.1. Market Analysis, Insights and Forecast - by Production Analysis
- 9.2. Market Analysis, Insights and Forecast - by Consumption Analysis
- 9.3. Market Analysis, Insights and Forecast - by Import Market Analysis (Value & Volume)
- 9.4. Market Analysis, Insights and Forecast - by Export Market Analysis (Value & Volume)
- 9.5. Market Analysis, Insights and Forecast - by Price Trend Analysis
- 10. Middle East & Africa Chain Saw Industry Analysis, Insights and Forecast, 2020-2032
- 10.1. Market Analysis, Insights and Forecast - by Production Analysis
- 10.2. Market Analysis, Insights and Forecast - by Consumption Analysis
- 10.3. Market Analysis, Insights and Forecast - by Import Market Analysis (Value & Volume)
- 10.4. Market Analysis, Insights and Forecast - by Export Market Analysis (Value & Volume)
- 10.5. Market Analysis, Insights and Forecast - by Price Trend Analysis
- 11. Asia Pacific Chain Saw Industry Analysis, Insights and Forecast, 2020-2032
- 11.1. Market Analysis, Insights and Forecast - by Production Analysis
- 11.2. Market Analysis, Insights and Forecast - by Consumption Analysis
- 11.3. Market Analysis, Insights and Forecast - by Import Market Analysis (Value & Volume)
- 11.4. Market Analysis, Insights and Forecast - by Export Market Analysis (Value & Volume)
- 11.5. Market Analysis, Insights and Forecast - by Price Trend Analysis
- 12. Competitive Analysis
- 12.1. Company Profiles
- 12.1.1 Talon Tough Tools
- 12.1.1.1. Company Overview
- 12.1.1.2. Products
- 12.1.1.3. Company Financials
- 12.1.1.4. SWOT Analysis
- 12.1.2 The Toro Co
- 12.1.2.1. Company Overview
- 12.1.2.2. Products
- 12.1.2.3. Company Financials
- 12.1.2.4. SWOT Analysis
- 12.1.3 Einhell Germany
- 12.1.3.1. Company Overview
- 12.1.3.2. Products
- 12.1.3.3. Company Financials
- 12.1.3.4. SWOT Analysis
- 12.1.4 ANDREAS STIHL Limited
- 12.1.4.1. Company Overview
- 12.1.4.2. Products
- 12.1.4.3. Company Financials
- 12.1.4.4. SWOT Analysis
- 12.1.5 Rochford Garden Machinery
- 12.1.5.1. Company Overview
- 12.1.5.2. Products
- 12.1.5.3. Company Financials
- 12.1.5.4. SWOT Analysis
- 12.1.6 Robert Bosch GmbH
- 12.1.6.1. Company Overview
- 12.1.6.2. Products
- 12.1.6.3. Company Financials
- 12.1.6.4. SWOT Analysis
- 12.1.7 SUMEC Group Corporation
- 12.1.7.1. Company Overview
- 12.1.7.2. Products
- 12.1.7.3. Company Financials
- 12.1.7.4. SWOT Analysis
- 12.1.8 AL-KO Kober
- 12.1.8.1. Company Overview
- 12.1.8.2. Products
- 12.1.8.3. Company Financials
- 12.1.8.4. SWOT Analysis
- 12.1.9 STIGA SpA
- 12.1.9.1. Company Overview
- 12.1.9.2. Products
- 12.1.9.3. Company Financials
- 12.1.9.4. SWOT Analysis
- 12.1.10 Emak SPA
- 12.1.10.1. Company Overview
- 12.1.10.2. Products
- 12.1.10.3. Company Financials
- 12.1.10.4. SWOT Analysis
- 12.1.11 Yamabiko Corp
- 12.1.11.1. Company Overview
- 12.1.11.2. Products
- 12.1.11.3. Company Financials
- 12.1.11.4. SWOT Analysis
- 12.1.12 Stanley Black & Decker Inc
- 12.1.12.1. Company Overview
- 12.1.12.2. Products
- 12.1.12.3. Company Financials
- 12.1.12.4. SWOT Analysis
- 12.1.13 Hitachi Ltd
- 12.1.13.1. Company Overview
- 12.1.13.2. Products
- 12.1.13.3. Company Financials
- 12.1.13.4. SWOT Analysis
- 12.1.14 Husqvarna AB
- 12.1.14.1. Company Overview
- 12.1.14.2. Products
- 12.1.14.3. Company Financials
- 12.1.14.4. SWOT Analysis
- 12.1.15 Blount International Inc
- 12.1.15.1. Company Overview
- 12.1.15.2. Products
- 12.1.15.3. Company Financials
- 12.1.15.4. SWOT Analysis
- 12.1.1 Talon Tough Tools
- 12.2. Market Entropy
- 12.2.1 Company's Key Areas Served
- 12.2.2 Recent Developments
- 12.3. Company Market Share Analysis 2025
- 12.3.1 Top 5 Companies Market Share Analysis
- 12.3.2 Top 3 Companies Market Share Analysis
- 12.4. List of Potential Customers
- 13. Research Methodology
List of Figures
- Figure 1: Global Chain Saw Industry Revenue Breakdown (Million, %) by Region 2025 & 2033
- Figure 2: Global Chain Saw Industry Volume Breakdown (Kiloton, %) by Region 2025 & 2033
- Figure 3: North America Chain Saw Industry Revenue (Million), by Production Analysis 2025 & 2033
- Figure 4: North America Chain Saw Industry Volume (Kiloton), by Production Analysis 2025 & 2033
- Figure 5: North America Chain Saw Industry Revenue Share (%), by Production Analysis 2025 & 2033
- Figure 6: North America Chain Saw Industry Volume Share (%), by Production Analysis 2025 & 2033
- Figure 7: North America Chain Saw Industry Revenue (Million), by Consumption Analysis 2025 & 2033
- Figure 8: North America Chain Saw Industry Volume (Kiloton), by Consumption Analysis 2025 & 2033
- Figure 9: North America Chain Saw Industry Revenue Share (%), by Consumption Analysis 2025 & 2033
- Figure 10: North America Chain Saw Industry Volume Share (%), by Consumption Analysis 2025 & 2033
- Figure 11: North America Chain Saw Industry Revenue (Million), by Import Market Analysis (Value & Volume) 2025 & 2033
- Figure 12: North America Chain Saw Industry Volume (Kiloton), by Import Market Analysis (Value & Volume) 2025 & 2033
- Figure 13: North America Chain Saw Industry Revenue Share (%), by Import Market Analysis (Value & Volume) 2025 & 2033
- Figure 14: North America Chain Saw Industry Volume Share (%), by Import Market Analysis (Value & Volume) 2025 & 2033
- Figure 15: North America Chain Saw Industry Revenue (Million), by Export Market Analysis (Value & Volume) 2025 & 2033
- Figure 16: North America Chain Saw Industry Volume (Kiloton), by Export Market Analysis (Value & Volume) 2025 & 2033
- Figure 17: North America Chain Saw Industry Revenue Share (%), by Export Market Analysis (Value & Volume) 2025 & 2033
- Figure 18: North America Chain Saw Industry Volume Share (%), by Export Market Analysis (Value & Volume) 2025 & 2033
- Figure 19: North America Chain Saw Industry Revenue (Million), by Price Trend Analysis 2025 & 2033
- Figure 20: North America Chain Saw Industry Volume (Kiloton), by Price Trend Analysis 2025 & 2033
- Figure 21: North America Chain Saw Industry Revenue Share (%), by Price Trend Analysis 2025 & 2033
- Figure 22: North America Chain Saw Industry Volume Share (%), by Price Trend Analysis 2025 & 2033
- Figure 23: North America Chain Saw Industry Revenue (Million), by Country 2025 & 2033
- Figure 24: North America Chain Saw Industry Volume (Kiloton), by Country 2025 & 2033
- Figure 25: North America Chain Saw Industry Revenue Share (%), by Country 2025 & 2033
- Figure 26: North America Chain Saw Industry Volume Share (%), by Country 2025 & 2033
- Figure 27: South America Chain Saw Industry Revenue (Million), by Production Analysis 2025 & 2033
- Figure 28: South America Chain Saw Industry Volume (Kiloton), by Production Analysis 2025 & 2033
- Figure 29: South America Chain Saw Industry Revenue Share (%), by Production Analysis 2025 & 2033
- Figure 30: South America Chain Saw Industry Volume Share (%), by Production Analysis 2025 & 2033
- Figure 31: South America Chain Saw Industry Revenue (Million), by Consumption Analysis 2025 & 2033
- Figure 32: South America Chain Saw Industry Volume (Kiloton), by Consumption Analysis 2025 & 2033
- Figure 33: South America Chain Saw Industry Revenue Share (%), by Consumption Analysis 2025 & 2033
- Figure 34: South America Chain Saw Industry Volume Share (%), by Consumption Analysis 2025 & 2033
- Figure 35: South America Chain Saw Industry Revenue (Million), by Import Market Analysis (Value & Volume) 2025 & 2033
- Figure 36: South America Chain Saw Industry Volume (Kiloton), by Import Market Analysis (Value & Volume) 2025 & 2033
- Figure 37: South America Chain Saw Industry Revenue Share (%), by Import Market Analysis (Value & Volume) 2025 & 2033
- Figure 38: South America Chain Saw Industry Volume Share (%), by Import Market Analysis (Value & Volume) 2025 & 2033
- Figure 39: South America Chain Saw Industry Revenue (Million), by Export Market Analysis (Value & Volume) 2025 & 2033
- Figure 40: South America Chain Saw Industry Volume (Kiloton), by Export Market Analysis (Value & Volume) 2025 & 2033
- Figure 41: South America Chain Saw Industry Revenue Share (%), by Export Market Analysis (Value & Volume) 2025 & 2033
- Figure 42: South America Chain Saw Industry Volume Share (%), by Export Market Analysis (Value & Volume) 2025 & 2033
- Figure 43: South America Chain Saw Industry Revenue (Million), by Price Trend Analysis 2025 & 2033
- Figure 44: South America Chain Saw Industry Volume (Kiloton), by Price Trend Analysis 2025 & 2033
- Figure 45: South America Chain Saw Industry Revenue Share (%), by Price Trend Analysis 2025 & 2033
- Figure 46: South America Chain Saw Industry Volume Share (%), by Price Trend Analysis 2025 & 2033
- Figure 47: South America Chain Saw Industry Revenue (Million), by Country 2025 & 2033
- Figure 48: South America Chain Saw Industry Volume (Kiloton), by Country 2025 & 2033
- Figure 49: South America Chain Saw Industry Revenue Share (%), by Country 2025 & 2033
- Figure 50: South America Chain Saw Industry Volume Share (%), by Country 2025 & 2033
- Figure 51: Europe Chain Saw Industry Revenue (Million), by Production Analysis 2025 & 2033
- Figure 52: Europe Chain Saw Industry Volume (Kiloton), by Production Analysis 2025 & 2033
- Figure 53: Europe Chain Saw Industry Revenue Share (%), by Production Analysis 2025 & 2033
- Figure 54: Europe Chain Saw Industry Volume Share (%), by Production Analysis 2025 & 2033
- Figure 55: Europe Chain Saw Industry Revenue (Million), by Consumption Analysis 2025 & 2033
- Figure 56: Europe Chain Saw Industry Volume (Kiloton), by Consumption Analysis 2025 & 2033
- Figure 57: Europe Chain Saw Industry Revenue Share (%), by Consumption Analysis 2025 & 2033
- Figure 58: Europe Chain Saw Industry Volume Share (%), by Consumption Analysis 2025 & 2033
- Figure 59: Europe Chain Saw Industry Revenue (Million), by Import Market Analysis (Value & Volume) 2025 & 2033
- Figure 60: Europe Chain Saw Industry Volume (Kiloton), by Import Market Analysis (Value & Volume) 2025 & 2033
- Figure 61: Europe Chain Saw Industry Revenue Share (%), by Import Market Analysis (Value & Volume) 2025 & 2033
- Figure 62: Europe Chain Saw Industry Volume Share (%), by Import Market Analysis (Value & Volume) 2025 & 2033
- Figure 63: Europe Chain Saw Industry Revenue (Million), by Export Market Analysis (Value & Volume) 2025 & 2033
- Figure 64: Europe Chain Saw Industry Volume (Kiloton), by Export Market Analysis (Value & Volume) 2025 & 2033
- Figure 65: Europe Chain Saw Industry Revenue Share (%), by Export Market Analysis (Value & Volume) 2025 & 2033
- Figure 66: Europe Chain Saw Industry Volume Share (%), by Export Market Analysis (Value & Volume) 2025 & 2033
- Figure 67: Europe Chain Saw Industry Revenue (Million), by Price Trend Analysis 2025 & 2033
- Figure 68: Europe Chain Saw Industry Volume (Kiloton), by Price Trend Analysis 2025 & 2033
- Figure 69: Europe Chain Saw Industry Revenue Share (%), by Price Trend Analysis 2025 & 2033
- Figure 70: Europe Chain Saw Industry Volume Share (%), by Price Trend Analysis 2025 & 2033
- Figure 71: Europe Chain Saw Industry Revenue (Million), by Country 2025 & 2033
- Figure 72: Europe Chain Saw Industry Volume (Kiloton), by Country 2025 & 2033
- Figure 73: Europe Chain Saw Industry Revenue Share (%), by Country 2025 & 2033
- Figure 74: Europe Chain Saw Industry Volume Share (%), by Country 2025 & 2033
- Figure 75: Middle East & Africa Chain Saw Industry Revenue (Million), by Production Analysis 2025 & 2033
- Figure 76: Middle East & Africa Chain Saw Industry Volume (Kiloton), by Production Analysis 2025 & 2033
- Figure 77: Middle East & Africa Chain Saw Industry Revenue Share (%), by Production Analysis 2025 & 2033
- Figure 78: Middle East & Africa Chain Saw Industry Volume Share (%), by Production Analysis 2025 & 2033
- Figure 79: Middle East & Africa Chain Saw Industry Revenue (Million), by Consumption Analysis 2025 & 2033
- Figure 80: Middle East & Africa Chain Saw Industry Volume (Kiloton), by Consumption Analysis 2025 & 2033
- Figure 81: Middle East & Africa Chain Saw Industry Revenue Share (%), by Consumption Analysis 2025 & 2033
- Figure 82: Middle East & Africa Chain Saw Industry Volume Share (%), by Consumption Analysis 2025 & 2033
- Figure 83: Middle East & Africa Chain Saw Industry Revenue (Million), by Import Market Analysis (Value & Volume) 2025 & 2033
- Figure 84: Middle East & Africa Chain Saw Industry Volume (Kiloton), by Import Market Analysis (Value & Volume) 2025 & 2033
- Figure 85: Middle East & Africa Chain Saw Industry Revenue Share (%), by Import Market Analysis (Value & Volume) 2025 & 2033
- Figure 86: Middle East & Africa Chain Saw Industry Volume Share (%), by Import Market Analysis (Value & Volume) 2025 & 2033
- Figure 87: Middle East & Africa Chain Saw Industry Revenue (Million), by Export Market Analysis (Value & Volume) 2025 & 2033
- Figure 88: Middle East & Africa Chain Saw Industry Volume (Kiloton), by Export Market Analysis (Value & Volume) 2025 & 2033
- Figure 89: Middle East & Africa Chain Saw Industry Revenue Share (%), by Export Market Analysis (Value & Volume) 2025 & 2033
- Figure 90: Middle East & Africa Chain Saw Industry Volume Share (%), by Export Market Analysis (Value & Volume) 2025 & 2033
- Figure 91: Middle East & Africa Chain Saw Industry Revenue (Million), by Price Trend Analysis 2025 & 2033
- Figure 92: Middle East & Africa Chain Saw Industry Volume (Kiloton), by Price Trend Analysis 2025 & 2033
- Figure 93: Middle East & Africa Chain Saw Industry Revenue Share (%), by Price Trend Analysis 2025 & 2033
- Figure 94: Middle East & Africa Chain Saw Industry Volume Share (%), by Price Trend Analysis 2025 & 2033
- Figure 95: Middle East & Africa Chain Saw Industry Revenue (Million), by Country 2025 & 2033
- Figure 96: Middle East & Africa Chain Saw Industry Volume (Kiloton), by Country 2025 & 2033
- Figure 97: Middle East & Africa Chain Saw Industry Revenue Share (%), by Country 2025 & 2033
- Figure 98: Middle East & Africa Chain Saw Industry Volume Share (%), by Country 2025 & 2033
- Figure 99: Asia Pacific Chain Saw Industry Revenue (Million), by Production Analysis 2025 & 2033
- Figure 100: Asia Pacific Chain Saw Industry Volume (Kiloton), by Production Analysis 2025 & 2033
- Figure 101: Asia Pacific Chain Saw Industry Revenue Share (%), by Production Analysis 2025 & 2033
- Figure 102: Asia Pacific Chain Saw Industry Volume Share (%), by Production Analysis 2025 & 2033
- Figure 103: Asia Pacific Chain Saw Industry Revenue (Million), by Consumption Analysis 2025 & 2033
- Figure 104: Asia Pacific Chain Saw Industry Volume (Kiloton), by Consumption Analysis 2025 & 2033
- Figure 105: Asia Pacific Chain Saw Industry Revenue Share (%), by Consumption Analysis 2025 & 2033
- Figure 106: Asia Pacific Chain Saw Industry Volume Share (%), by Consumption Analysis 2025 & 2033
- Figure 107: Asia Pacific Chain Saw Industry Revenue (Million), by Import Market Analysis (Value & Volume) 2025 & 2033
- Figure 108: Asia Pacific Chain Saw Industry Volume (Kiloton), by Import Market Analysis (Value & Volume) 2025 & 2033
- Figure 109: Asia Pacific Chain Saw Industry Revenue Share (%), by Import Market Analysis (Value & Volume) 2025 & 2033
- Figure 110: Asia Pacific Chain Saw Industry Volume Share (%), by Import Market Analysis (Value & Volume) 2025 & 2033
- Figure 111: Asia Pacific Chain Saw Industry Revenue (Million), by Export Market Analysis (Value & Volume) 2025 & 2033
- Figure 112: Asia Pacific Chain Saw Industry Volume (Kiloton), by Export Market Analysis (Value & Volume) 2025 & 2033
- Figure 113: Asia Pacific Chain Saw Industry Revenue Share (%), by Export Market Analysis (Value & Volume) 2025 & 2033
- Figure 114: Asia Pacific Chain Saw Industry Volume Share (%), by Export Market Analysis (Value & Volume) 2025 & 2033
- Figure 115: Asia Pacific Chain Saw Industry Revenue (Million), by Price Trend Analysis 2025 & 2033
- Figure 116: Asia Pacific Chain Saw Industry Volume (Kiloton), by Price Trend Analysis 2025 & 2033
- Figure 117: Asia Pacific Chain Saw Industry Revenue Share (%), by Price Trend Analysis 2025 & 2033
- Figure 118: Asia Pacific Chain Saw Industry Volume Share (%), by Price Trend Analysis 2025 & 2033
- Figure 119: Asia Pacific Chain Saw Industry Revenue (Million), by Country 2025 & 2033
- Figure 120: Asia Pacific Chain Saw Industry Volume (Kiloton), by Country 2025 & 2033
- Figure 121: Asia Pacific Chain Saw Industry Revenue Share (%), by Country 2025 & 2033
- Figure 122: Asia Pacific Chain Saw Industry Volume Share (%), by Country 2025 & 2033
List of Tables
- Table 1: Global Chain Saw Industry Revenue Million Forecast, by Production Analysis 2020 & 2033
- Table 2: Global Chain Saw Industry Volume Kiloton Forecast, by Production Analysis 2020 & 2033
- Table 3: Global Chain Saw Industry Revenue Million Forecast, by Consumption Analysis 2020 & 2033
- Table 4: Global Chain Saw Industry Volume Kiloton Forecast, by Consumption Analysis 2020 & 2033
- Table 5: Global Chain Saw Industry Revenue Million Forecast, by Import Market Analysis (Value & Volume) 2020 & 2033
- Table 6: Global Chain Saw Industry Volume Kiloton Forecast, by Import Market Analysis (Value & Volume) 2020 & 2033
- Table 7: Global Chain Saw Industry Revenue Million Forecast, by Export Market Analysis (Value & Volume) 2020 & 2033
- Table 8: Global Chain Saw Industry Volume Kiloton Forecast, by Export Market Analysis (Value & Volume) 2020 & 2033
- Table 9: Global Chain Saw Industry Revenue Million Forecast, by Price Trend Analysis 2020 & 2033
- Table 10: Global Chain Saw Industry Volume Kiloton Forecast, by Price Trend Analysis 2020 & 2033
- Table 11: Global Chain Saw Industry Revenue Million Forecast, by Region 2020 & 2033
- Table 12: Global Chain Saw Industry Volume Kiloton Forecast, by Region 2020 & 2033
- Table 13: Global Chain Saw Industry Revenue Million Forecast, by Production Analysis 2020 & 2033
- Table 14: Global Chain Saw Industry Volume Kiloton Forecast, by Production Analysis 2020 & 2033
- Table 15: Global Chain Saw Industry Revenue Million Forecast, by Consumption Analysis 2020 & 2033
- Table 16: Global Chain Saw Industry Volume Kiloton Forecast, by Consumption Analysis 2020 & 2033
- Table 17: Global Chain Saw Industry Revenue Million Forecast, by Import Market Analysis (Value & Volume) 2020 & 2033
- Table 18: Global Chain Saw Industry Volume Kiloton Forecast, by Import Market Analysis (Value & Volume) 2020 & 2033
- Table 19: Global Chain Saw Industry Revenue Million Forecast, by Export Market Analysis (Value & Volume) 2020 & 2033
- Table 20: Global Chain Saw Industry Volume Kiloton Forecast, by Export Market Analysis (Value & Volume) 2020 & 2033
- Table 21: Global Chain Saw Industry Revenue Million Forecast, by Price Trend Analysis 2020 & 2033
- Table 22: Global Chain Saw Industry Volume Kiloton Forecast, by Price Trend Analysis 2020 & 2033
- Table 23: Global Chain Saw Industry Revenue Million Forecast, by Country 2020 & 2033
- Table 24: Global Chain Saw Industry Volume Kiloton Forecast, by Country 2020 & 2033
- Table 25: United States Chain Saw Industry Revenue (Million) Forecast, by Application 2020 & 2033
- Table 26: United States Chain Saw Industry Volume (Kiloton) Forecast, by Application 2020 & 2033
- Table 27: Canada Chain Saw Industry Revenue (Million) Forecast, by Application 2020 & 2033
- Table 28: Canada Chain Saw Industry Volume (Kiloton) Forecast, by Application 2020 & 2033
- Table 29: Mexico Chain Saw Industry Revenue (Million) Forecast, by Application 2020 & 2033
- Table 30: Mexico Chain Saw Industry Volume (Kiloton) Forecast, by Application 2020 & 2033
- Table 31: Global Chain Saw Industry Revenue Million Forecast, by Production Analysis 2020 & 2033
- Table 32: Global Chain Saw Industry Volume Kiloton Forecast, by Production Analysis 2020 & 2033
- Table 33: Global Chain Saw Industry Revenue Million Forecast, by Consumption Analysis 2020 & 2033
- Table 34: Global Chain Saw Industry Volume Kiloton Forecast, by Consumption Analysis 2020 & 2033
- Table 35: Global Chain Saw Industry Revenue Million Forecast, by Import Market Analysis (Value & Volume) 2020 & 2033
- Table 36: Global Chain Saw Industry Volume Kiloton Forecast, by Import Market Analysis (Value & Volume) 2020 & 2033
- Table 37: Global Chain Saw Industry Revenue Million Forecast, by Export Market Analysis (Value & Volume) 2020 & 2033
- Table 38: Global Chain Saw Industry Volume Kiloton Forecast, by Export Market Analysis (Value & Volume) 2020 & 2033
- Table 39: Global Chain Saw Industry Revenue Million Forecast, by Price Trend Analysis 2020 & 2033
- Table 40: Global Chain Saw Industry Volume Kiloton Forecast, by Price Trend Analysis 2020 & 2033
- Table 41: Global Chain Saw Industry Revenue Million Forecast, by Country 2020 & 2033
- Table 42: Global Chain Saw Industry Volume Kiloton Forecast, by Country 2020 & 2033
- Table 43: Brazil Chain Saw Industry Revenue (Million) Forecast, by Application 2020 & 2033
- Table 44: Brazil Chain Saw Industry Volume (Kiloton) Forecast, by Application 2020 & 2033
- Table 45: Argentina Chain Saw Industry Revenue (Million) Forecast, by Application 2020 & 2033
- Table 46: Argentina Chain Saw Industry Volume (Kiloton) Forecast, by Application 2020 & 2033
- Table 47: Rest of South America Chain Saw Industry Revenue (Million) Forecast, by Application 2020 & 2033
- Table 48: Rest of South America Chain Saw Industry Volume (Kiloton) Forecast, by Application 2020 & 2033
- Table 49: Global Chain Saw Industry Revenue Million Forecast, by Production Analysis 2020 & 2033
- Table 50: Global Chain Saw Industry Volume Kiloton Forecast, by Production Analysis 2020 & 2033
- Table 51: Global Chain Saw Industry Revenue Million Forecast, by Consumption Analysis 2020 & 2033
- Table 52: Global Chain Saw Industry Volume Kiloton Forecast, by Consumption Analysis 2020 & 2033
- Table 53: Global Chain Saw Industry Revenue Million Forecast, by Import Market Analysis (Value & Volume) 2020 & 2033
- Table 54: Global Chain Saw Industry Volume Kiloton Forecast, by Import Market Analysis (Value & Volume) 2020 & 2033
- Table 55: Global Chain Saw Industry Revenue Million Forecast, by Export Market Analysis (Value & Volume) 2020 & 2033
- Table 56: Global Chain Saw Industry Volume Kiloton Forecast, by Export Market Analysis (Value & Volume) 2020 & 2033
- Table 57: Global Chain Saw Industry Revenue Million Forecast, by Price Trend Analysis 2020 & 2033
- Table 58: Global Chain Saw Industry Volume Kiloton Forecast, by Price Trend Analysis 2020 & 2033
- Table 59: Global Chain Saw Industry Revenue Million Forecast, by Country 2020 & 2033
- Table 60: Global Chain Saw Industry Volume Kiloton Forecast, by Country 2020 & 2033
- Table 61: United Kingdom Chain Saw Industry Revenue (Million) Forecast, by Application 2020 & 2033
- Table 62: United Kingdom Chain Saw Industry Volume (Kiloton) Forecast, by Application 2020 & 2033
- Table 63: Germany Chain Saw Industry Revenue (Million) Forecast, by Application 2020 & 2033
- Table 64: Germany Chain Saw Industry Volume (Kiloton) Forecast, by Application 2020 & 2033
- Table 65: France Chain Saw Industry Revenue (Million) Forecast, by Application 2020 & 2033
- Table 66: France Chain Saw Industry Volume (Kiloton) Forecast, by Application 2020 & 2033
- Table 67: Italy Chain Saw Industry Revenue (Million) Forecast, by Application 2020 & 2033
- Table 68: Italy Chain Saw Industry Volume (Kiloton) Forecast, by Application 2020 & 2033
- Table 69: Spain Chain Saw Industry Revenue (Million) Forecast, by Application 2020 & 2033
- Table 70: Spain Chain Saw Industry Volume (Kiloton) Forecast, by Application 2020 & 2033
- Table 71: Russia Chain Saw Industry Revenue (Million) Forecast, by Application 2020 & 2033
- Table 72: Russia Chain Saw Industry Volume (Kiloton) Forecast, by Application 2020 & 2033
- Table 73: Benelux Chain Saw Industry Revenue (Million) Forecast, by Application 2020 & 2033
- Table 74: Benelux Chain Saw Industry Volume (Kiloton) Forecast, by Application 2020 & 2033
- Table 75: Nordics Chain Saw Industry Revenue (Million) Forecast, by Application 2020 & 2033
- Table 76: Nordics Chain Saw Industry Volume (Kiloton) Forecast, by Application 2020 & 2033
- Table 77: Rest of Europe Chain Saw Industry Revenue (Million) Forecast, by Application 2020 & 2033
- Table 78: Rest of Europe Chain Saw Industry Volume (Kiloton) Forecast, by Application 2020 & 2033
- Table 79: Global Chain Saw Industry Revenue Million Forecast, by Production Analysis 2020 & 2033
- Table 80: Global Chain Saw Industry Volume Kiloton Forecast, by Production Analysis 2020 & 2033
- Table 81: Global Chain Saw Industry Revenue Million Forecast, by Consumption Analysis 2020 & 2033
- Table 82: Global Chain Saw Industry Volume Kiloton Forecast, by Consumption Analysis 2020 & 2033
- Table 83: Global Chain Saw Industry Revenue Million Forecast, by Import Market Analysis (Value & Volume) 2020 & 2033
- Table 84: Global Chain Saw Industry Volume Kiloton Forecast, by Import Market Analysis (Value & Volume) 2020 & 2033
- Table 85: Global Chain Saw Industry Revenue Million Forecast, by Export Market Analysis (Value & Volume) 2020 & 2033
- Table 86: Global Chain Saw Industry Volume Kiloton Forecast, by Export Market Analysis (Value & Volume) 2020 & 2033
- Table 87: Global Chain Saw Industry Revenue Million Forecast, by Price Trend Analysis 2020 & 2033
- Table 88: Global Chain Saw Industry Volume Kiloton Forecast, by Price Trend Analysis 2020 & 2033
- Table 89: Global Chain Saw Industry Revenue Million Forecast, by Country 2020 & 2033
- Table 90: Global Chain Saw Industry Volume Kiloton Forecast, by Country 2020 & 2033
- Table 91: Turkey Chain Saw Industry Revenue (Million) Forecast, by Application 2020 & 2033
- Table 92: Turkey Chain Saw Industry Volume (Kiloton) Forecast, by Application 2020 & 2033
- Table 93: Israel Chain Saw Industry Revenue (Million) Forecast, by Application 2020 & 2033
- Table 94: Israel Chain Saw Industry Volume (Kiloton) Forecast, by Application 2020 & 2033
- Table 95: GCC Chain Saw Industry Revenue (Million) Forecast, by Application 2020 & 2033
- Table 96: GCC Chain Saw Industry Volume (Kiloton) Forecast, by Application 2020 & 2033
- Table 97: North Africa Chain Saw Industry Revenue (Million) Forecast, by Application 2020 & 2033
- Table 98: North Africa Chain Saw Industry Volume (Kiloton) Forecast, by Application 2020 & 2033
- Table 99: South Africa Chain Saw Industry Revenue (Million) Forecast, by Application 2020 & 2033
- Table 100: South Africa Chain Saw Industry Volume (Kiloton) Forecast, by Application 2020 & 2033
- Table 101: Rest of Middle East & Africa Chain Saw Industry Revenue (Million) Forecast, by Application 2020 & 2033
- Table 102: Rest of Middle East & Africa Chain Saw Industry Volume (Kiloton) Forecast, by Application 2020 & 2033
- Table 103: Global Chain Saw Industry Revenue Million Forecast, by Production Analysis 2020 & 2033
- Table 104: Global Chain Saw Industry Volume Kiloton Forecast, by Production Analysis 2020 & 2033
- Table 105: Global Chain Saw Industry Revenue Million Forecast, by Consumption Analysis 2020 & 2033
- Table 106: Global Chain Saw Industry Volume Kiloton Forecast, by Consumption Analysis 2020 & 2033
- Table 107: Global Chain Saw Industry Revenue Million Forecast, by Import Market Analysis (Value & Volume) 2020 & 2033
- Table 108: Global Chain Saw Industry Volume Kiloton Forecast, by Import Market Analysis (Value & Volume) 2020 & 2033
- Table 109: Global Chain Saw Industry Revenue Million Forecast, by Export Market Analysis (Value & Volume) 2020 & 2033
- Table 110: Global Chain Saw Industry Volume Kiloton Forecast, by Export Market Analysis (Value & Volume) 2020 & 2033
- Table 111: Global Chain Saw Industry Revenue Million Forecast, by Price Trend Analysis 2020 & 2033
- Table 112: Global Chain Saw Industry Volume Kiloton Forecast, by Price Trend Analysis 2020 & 2033
- Table 113: Global Chain Saw Industry Revenue Million Forecast, by Country 2020 & 2033
- Table 114: Global Chain Saw Industry Volume Kiloton Forecast, by Country 2020 & 2033
- Table 115: China Chain Saw Industry Revenue (Million) Forecast, by Application 2020 & 2033
- Table 116: China Chain Saw Industry Volume (Kiloton) Forecast, by Application 2020 & 2033
- Table 117: India Chain Saw Industry Revenue (Million) Forecast, by Application 2020 & 2033
- Table 118: India Chain Saw Industry Volume (Kiloton) Forecast, by Application 2020 & 2033
- Table 119: Japan Chain Saw Industry Revenue (Million) Forecast, by Application 2020 & 2033
- Table 120: Japan Chain Saw Industry Volume (Kiloton) Forecast, by Application 2020 & 2033
- Table 121: South Korea Chain Saw Industry Revenue (Million) Forecast, by Application 2020 & 2033
- Table 122: South Korea Chain Saw Industry Volume (Kiloton) Forecast, by Application 2020 & 2033
- Table 123: ASEAN Chain Saw Industry Revenue (Million) Forecast, by Application 2020 & 2033
- Table 124: ASEAN Chain Saw Industry Volume (Kiloton) Forecast, by Application 2020 & 2033
- Table 125: Oceania Chain Saw Industry Revenue (Million) Forecast, by Application 2020 & 2033
- Table 126: Oceania Chain Saw Industry Volume (Kiloton) Forecast, by Application 2020 & 2033
- Table 127: Rest of Asia Pacific Chain Saw Industry Revenue (Million) Forecast, by Application 2020 & 2033
- Table 128: Rest of Asia Pacific Chain Saw Industry Volume (Kiloton) Forecast, by Application 2020 & 2033
Frequently Asked Questions
1. What is the projected Compound Annual Growth Rate (CAGR) of the Chain Saw Industry?
The projected CAGR is approximately 3.50%.
2. Which companies are prominent players in the Chain Saw Industry?
Key companies in the market include Talon Tough Tools, The Toro Co, Einhell Germany, ANDREAS STIHL Limited, Rochford Garden Machinery, Robert Bosch GmbH, SUMEC Group Corporation, AL-KO Kober, STIGA SpA, Emak SPA, Yamabiko Corp, Stanley Black & Decker Inc, Hitachi Ltd, Husqvarna AB, Blount International Inc.
3. What are the main segments of the Chain Saw Industry?
The market segments include Production Analysis, Consumption Analysis, Import Market Analysis (Value & Volume), Export Market Analysis (Value & Volume), Price Trend Analysis.
4. Can you provide details about the market size?
The market size is estimated to be USD 4.27 Million as of 2022.
5. What are some drivers contributing to market growth?
Decreasing Per Capita Arable Land; Increased Demand for Food.
6. What are the notable trends driving market growth?
Increasing Deforestation and Demand for Commodities and Shelter.
7. Are there any restraints impacting market growth?
High Initial Investments; Requirement of Precision Agriculture.
8. Can you provide examples of recent developments in the market?
April 2023: Husqvarna launched T542i XP® and 542i XP®, which the company claims to be the world's first battery chainsaws with a clutch, offering a kick-start of energy at the beginning of every cut and the familiar feel of gas-powered counterparts
9. What pricing options are available for accessing the report?
Pricing options include single-user, multi-user, and enterprise licenses priced at USD 4750, USD 5250, and USD 8750 respectively.
10. Is the market size provided in terms of value or volume?
The market size is provided in terms of value, measured in Million and volume, measured in Kiloton.
11. Are there any specific market keywords associated with the report?
Yes, the market keyword associated with the report is "Chain Saw Industry," which aids in identifying and referencing the specific market segment covered.
12. How do I determine which pricing option suits my needs best?
The pricing options vary based on user requirements and access needs. Individual users may opt for single-user licenses, while businesses requiring broader access may choose multi-user or enterprise licenses for cost-effective access to the report.
13. Are there any additional resources or data provided in the Chain Saw Industry report?
While the report offers comprehensive insights, it's advisable to review the specific contents or supplementary materials provided to ascertain if additional resources or data are available.
14. How can I stay updated on further developments or reports in the Chain Saw Industry?
To stay informed about further developments, trends, and reports in the Chain Saw Industry, consider subscribing to industry newsletters, following relevant companies and organizations, or regularly checking reputable industry news sources and publications.
Methodology
Step 1 - Identification of Relevant Samples Size from Population Database


Step 2 - Approaches for Defining Global Market Size (Value, Volume* & Price*)

Note*: In applicable scenarios
Step 3 - Data Sources
Primary Research
- Web Analytics
- Survey Reports
- Research Institute
- Latest Research Reports
- Opinion Leaders
Secondary Research
- Annual Reports
- White Paper
- Latest Press Release
- Industry Association
- Paid Database
- Investor Presentations

Step 4 - Data Triangulation
Involves using different sources of information in order to increase the validity of a study
These sources are likely to be stakeholders in a program - participants, other researchers, program staff, other community members, and so on.
Then we put all data in single framework & apply various statistical tools to find out the dynamic on the market.
During the analysis stage, feedback from the stakeholder groups would be compared to determine areas of agreement as well as areas of divergence