

Key Insights
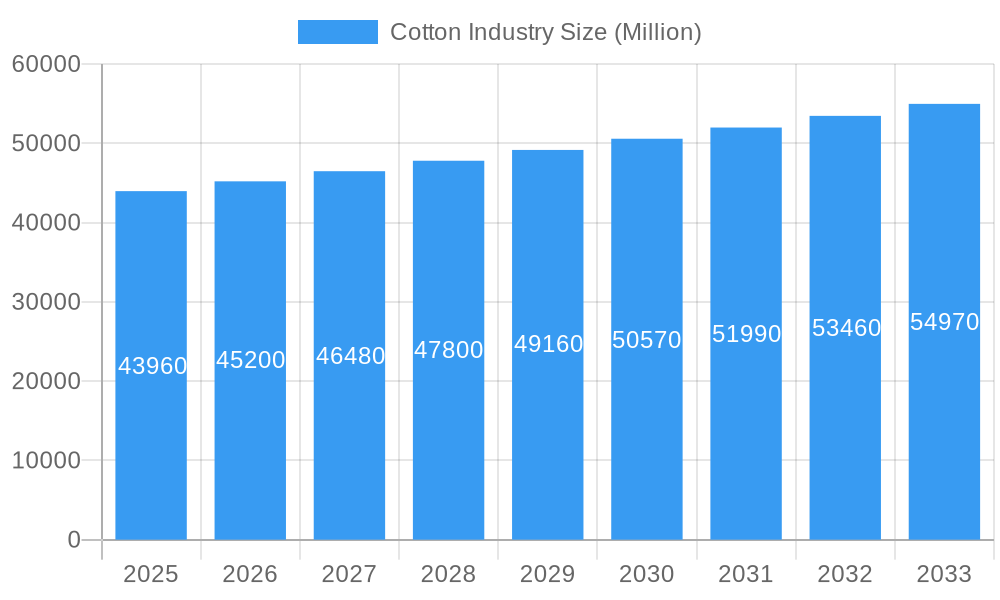
The global cotton industry, valued at $43.96 billion in 2025, is projected to experience steady growth, with a Compound Annual Growth Rate (CAGR) of 2.70% from 2025 to 2033. This growth is driven by several factors. The increasing demand for apparel and home textiles, particularly in developing economies experiencing rapid urbanization and rising disposable incomes, is a significant driver. Furthermore, advancements in cotton farming techniques, including the development of pest-resistant and higher-yield varieties, contribute to increased production and efficiency. The industry is also witnessing a shift towards sustainable and ethically sourced cotton, responding to growing consumer awareness and environmental concerns. This includes initiatives promoting water conservation and reduced pesticide use in cotton cultivation. However, the industry faces challenges such as fluctuating cotton prices influenced by global supply and demand dynamics, competition from synthetic fibers, and the impact of climate change on crop yields. Effective strategies for mitigating these challenges include diversification of end-use applications, fostering collaboration across the value chain, and investing in research and development to improve cotton quality and resilience.
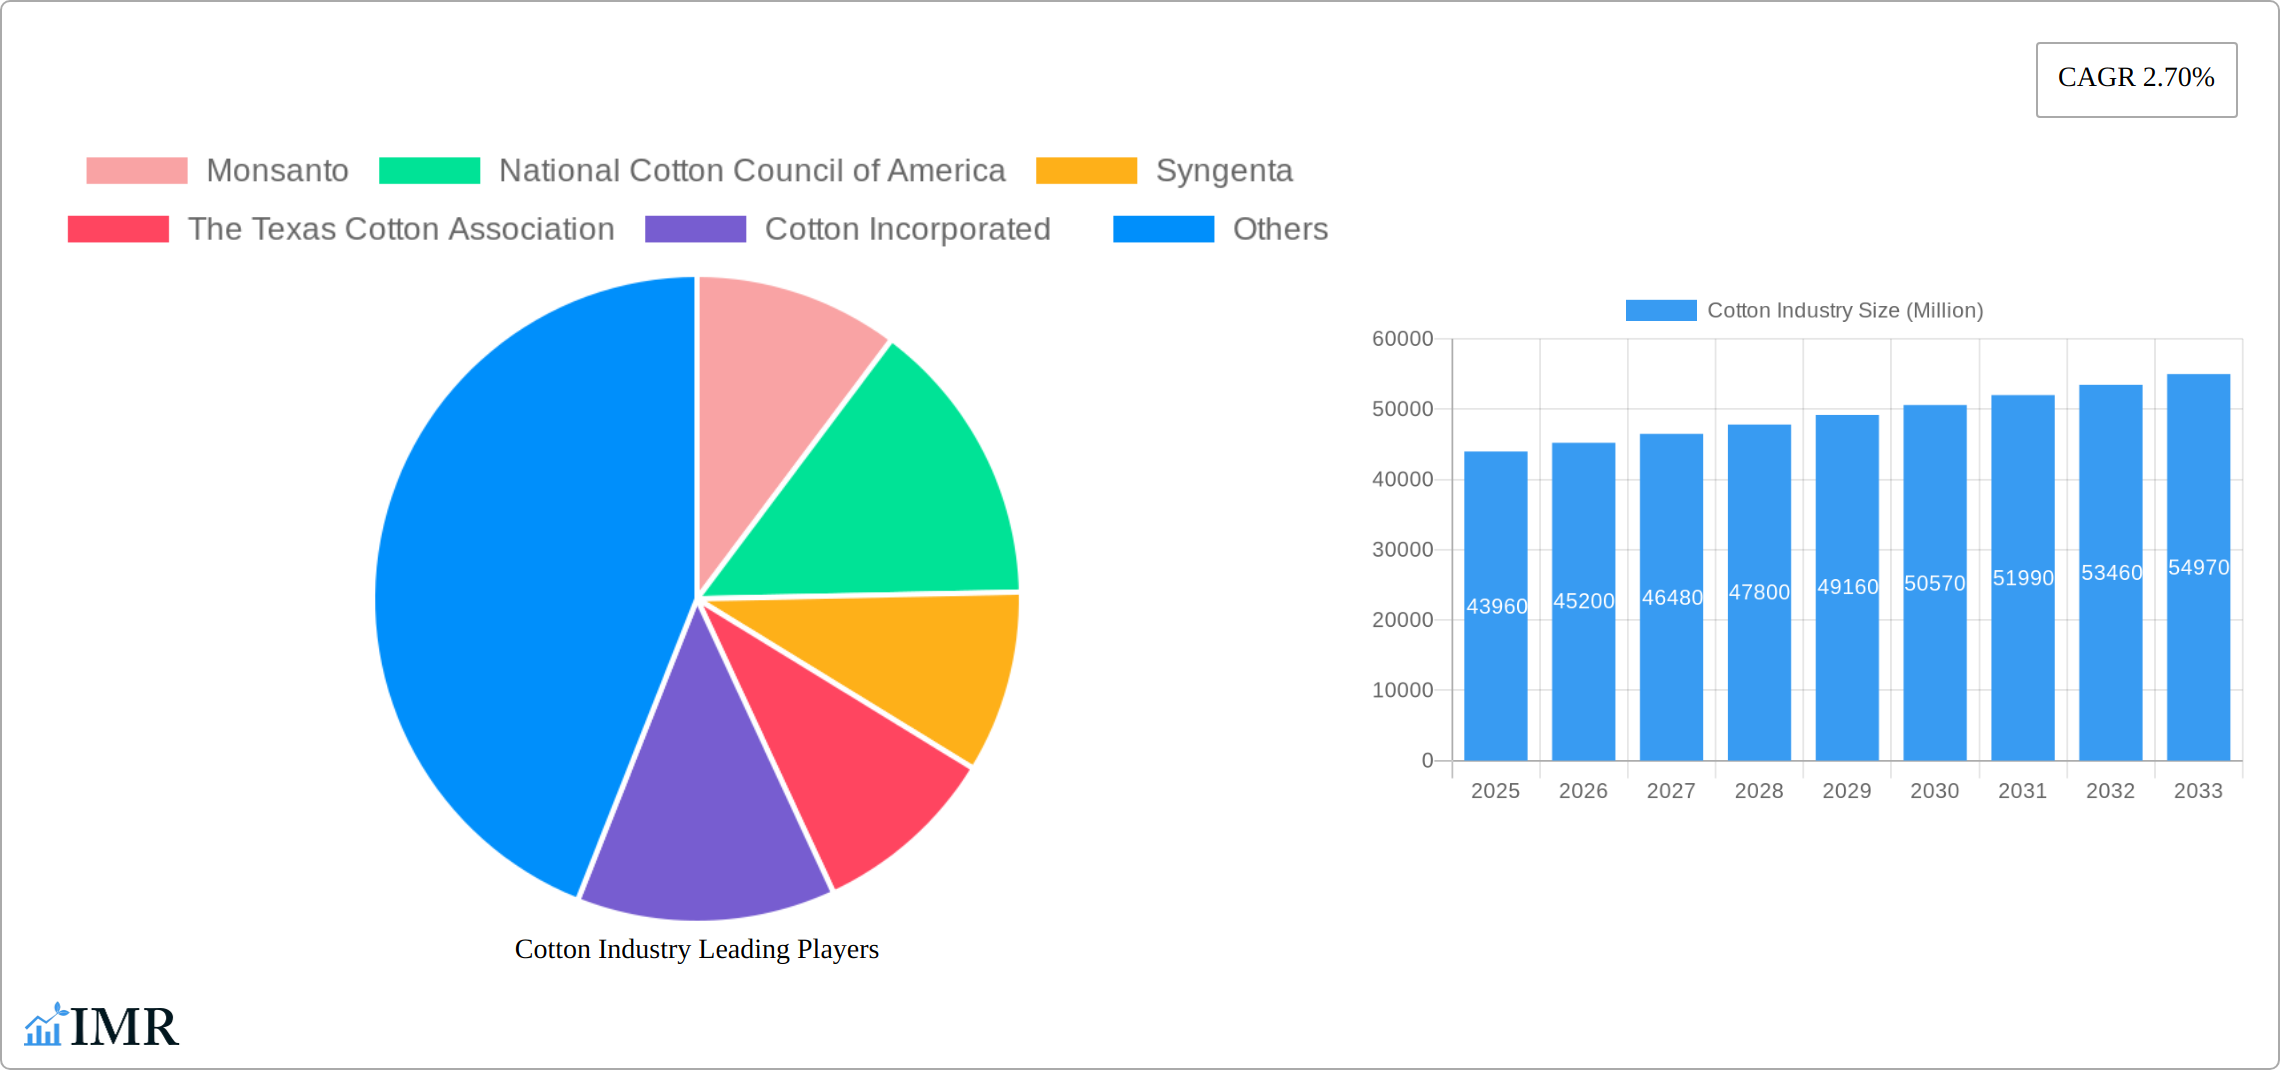
Cotton Industry Market Size (In Billion)
Segment-wise analysis reveals strong performance across various categories. While short-staple cotton dominates the fiber length segment, there is consistent demand for medium and long-staple cotton for specialized applications in premium apparel. Similarly, the different grades (SLM, M, SM) cater to diverse quality requirements within the textile industry, while white cotton remains the dominant color due to its versatility. Regional analysis suggests that Asia-Pacific, particularly China and India, are major consumers and producers of cotton, fueled by their robust textile industries. North America and Europe also play significant roles as both consumers and importers, with a focus on high-quality and sustainable cotton products. The competitive landscape is shaped by a mix of large multinational corporations like Monsanto, Syngenta, and Bayer CropScience, alongside regional associations and smaller players involved in cotton farming, processing, and trading. The forecast period (2025-2033) suggests continued growth for the cotton industry, albeit at a moderate pace, reflecting a combination of positive growth drivers and persistent challenges. The industry's future hinges on its ability to innovate, adapt to evolving consumer preferences, and promote sustainable practices throughout the supply chain.
Cotton Industry Company Market Share
Cotton Industry Market Report: 2019-2033
This comprehensive report provides an in-depth analysis of the global cotton industry, encompassing market dynamics, growth trends, key players, and future outlook. Covering the period from 2019 to 2033, with a focus on 2025, this report is an essential resource for industry professionals, investors, and stakeholders seeking to understand and capitalize on opportunities within this dynamic sector. The report segments the market by fiber length (short-staple, medium-staple, long-staple), grade (Strict Low Middling (SLM), Middling (M), Strict Middling (SM)), color (white, colored), and end-use (apparel, home textiles, industrial applications). Parent markets include agriculture and textiles, while child markets span diverse consumer goods.
Cotton Industry Market Dynamics & Structure
The cotton industry presents a moderately concentrated market structure, with key players like Bayer, Syngenta, and BASF (following the Bayer-Monsanto merger) holding substantial market share. Technological innovation, particularly in seed genetics, precision agriculture, and pest management, is a primary growth driver. Stringent regulatory frameworks concerning pesticide use, water conservation, and sustainable farming practices significantly impact production, trade, and profitability. The industry faces ongoing competitive pressure from synthetic fibers (polyester, nylon, and other blends), especially in price-sensitive markets. End-user demand, heavily influenced by apparel trends and consumer preferences for sustainable products, shapes market dynamics. Mergers and acquisitions (M&A) activity remains significant, with billions of USD in deals annually focused on seed technology, agricultural input companies, and textile processing advancements. Geopolitical factors and fluctuating commodity prices also introduce volatility.
- Market Concentration: Oligopolistic, with a few multinational corporations controlling a significant portion of the global seed supply and influencing production.
- Technological Innovation: Emphasis on genetically modified (GM) cotton, improved fiber quality (length, strength, fineness), water-efficient varieties, and disease-resistant strains. Precision agriculture technologies optimize resource utilization.
- Regulatory Frameworks: Differ across regions, impacting pesticide registration, water usage rights, environmental compliance, and labor standards. Increasingly, regulations promote sustainability and traceability.
- Competitive Substitutes: Synthetic fibers present ongoing competition, driving innovation in cotton production and processing to enhance its value proposition (e.g., comfort, breathability, biodegradability).
- M&A Trends: Consolidation continues, driven by economies of scale, access to technology, and expansion into new markets. Vertical integration is also observed, with companies controlling multiple stages of the cotton supply chain.
Cotton Industry Growth Trends & Insights
The global cotton industry's growth from 2019 to 2024 was volatile, impacted by weather patterns, fluctuating global demand (influenced by economic cycles and fashion trends), and geopolitical events. The market size, estimated at [Insert Updated Market Size in USD or Million Units] in 2024, is projected to reach [Insert Updated Market Size Projection] by 2033, exhibiting a CAGR of [Insert Updated CAGR]% during the forecast period (2025-2033). The adoption of advanced technologies, like drought-resistant and pest-resistant cotton varieties and precision agriculture, contributes to productivity improvements. Consumer preference shifts toward sustainable and ethically sourced cotton, coupled with growing awareness of environmental and social responsibility, are creating significant demand for organic and certified cotton. Traceability and transparency initiatives are gaining momentum.
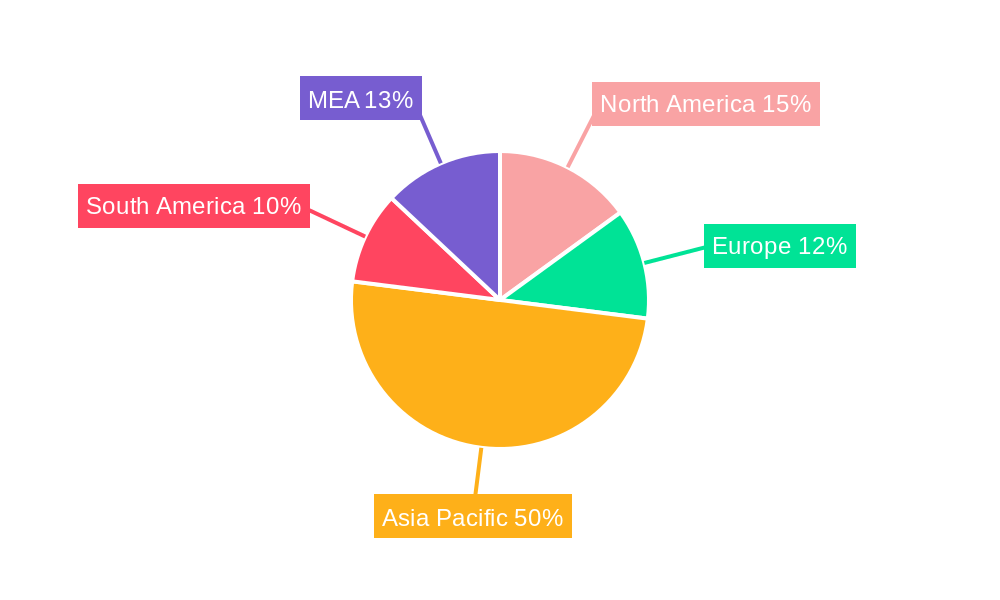
Dominant Regions, Countries, or Segments in Cotton Industry
India and China remain the dominant cotton-producing countries, accounting for a combined xx% of global production in 2024. The apparel segment represents the largest end-use sector, consuming approximately xx% of global cotton production. Within fiber length, medium-staple cotton dominates due to its versatility and cost-effectiveness. Strict Middling (SM) grade commands a higher price due to its superior quality. White cotton maintains the largest share in terms of color due to its preferred use in most apparel applications.
- Key Drivers: Government support for cotton farmers, favorable climatic conditions in key regions, and strong demand from the apparel industry.
- Dominance Factors: Established production infrastructure, large domestic market, and access to affordable labor.
- Growth Potential: Emerging economies in Asia and Africa offer significant growth potential for cotton production and consumption.
Cotton Industry Product Landscape
The cotton industry's product landscape is dynamic, characterized by continuous advancements in seed technology leading to enhanced fiber characteristics. New cotton varieties are developed to meet diverse market demands, including superior fiber length, strength, micronaire, and color. Value-added cotton products, including organic, sustainably produced, and certified cotton (e.g., Fairtrade, GOTS), are experiencing strong growth due to increasing consumer awareness. Technological progress in precision agriculture (e.g., GPS-guided irrigation, variable rate fertilization) and automation in harvesting and ginning processes improves efficiency and reduces environmental impact. Innovation in textile manufacturing is also extending the applications of cotton, leveraging its natural properties for diverse uses (apparel, home textiles, industrial applications).
Key Drivers, Barriers & Challenges in Cotton Industry
Key Drivers: Increasing global population and rising apparel consumption; advancements in cotton seed technology leading to higher yields; demand for organic and sustainable cotton; government support for cotton farming in many countries.
Challenges and Restraints: Fluctuations in cotton prices; vulnerability to pests and diseases; water scarcity and environmental concerns; competition from synthetic fibers; high production costs in some regions; supply chain disruptions negatively impacting production and pricing. These factors collectively contribute to an estimated xx% reduction in potential market growth annually.
Emerging Opportunities in Cotton Industry
The cotton industry is witnessing a rise in demand for sustainable and ethically sourced cotton, creating lucrative opportunities for organic cotton farmers and producers. Innovative applications of cotton in high-performance textiles and industrial materials offer significant growth potential. Untapped markets in emerging economies represent substantial growth avenues. Technological advances like blockchain technology for traceability and transparency are transforming the supply chain, strengthening trust and sustainability initiatives.
Growth Accelerators in the Cotton Industry
Technological breakthroughs in seed technology, precision agriculture, and efficient processing methods are driving productivity gains and cost reductions. Strategic partnerships between seed companies, textile manufacturers, and retailers are fostering sustainability and traceability initiatives throughout the supply chain. Market expansion strategies focused on emerging economies are unlocking new growth opportunities. Government initiatives to support cotton farmers are vital in ensuring the continued success of this crucial industry.
Key Players Shaping the Cotton Industry Market
- BASF Agricultural Solutions (formerly part of Bayer)
- National Cotton Council of America
- Syngenta
- The Texas Cotton Association
- Cotton Incorporated
- International Cotton Association
- Bayer Crop Science
- [Add other relevant key players - e.g., large textile manufacturers, ginning companies]
Notable Milestones in Cotton Industry Sector
- September 2022: Launch of two new organic cotton varieties in India, boosting organic cotton production.
- August 2022: Several major apparel brands joined the Organic Cotton Accelerator (OCA), demonstrating growing commitment to sustainable practices.
- March 2022: Armor seed company introduced two new cotton varieties with improved fiber quality and pest resistance, enhancing crop yields.
In-Depth Cotton Industry Market Outlook
The cotton industry's future is promising, driven by continuous technological advancements, increasing global demand, and a growing emphasis on sustainability. Strategic partnerships across the supply chain, from seed production to textile manufacturing, are crucial for unlocking market opportunities and improving industry resilience. The adoption of sustainable practices—such as reducing water consumption, minimizing pesticide use, and promoting fair labor practices—is not just a trend but a necessity for long-term growth and market competitiveness. Traceability and transparency initiatives, enabling consumers to verify the origin and production methods of cotton products, are becoming increasingly important. The industry's focus on innovation and collaboration will be key to addressing challenges and capturing future growth opportunities within the global textile market.
Cotton Industry Segmentation
- 1. Production Analysis
- 2. Consumption Analysis
- 3. Import Market Analysis (Value & Volume)
- 4. Export Market Analysis (Value & Volume)
- 5. Price Trend Analysis
Cotton Industry Segmentation By Geography
-
1. North America
- 1.1. United States
- 1.2. Canada
- 1.3. Mexico
-
2. Europe
- 2.1. Germany
- 2.2. France
- 2.3. Russia
- 2.4. Greece
- 2.5. Italy
-
3. Asia Pacific
- 3.1. China
- 3.2. India
- 3.3. Australia
- 3.4. Pakistan
- 3.5. Bangladesh
-
4. South America
- 4.1. Brazil
- 4.2. Argentina
- 5. Middle East
-
6. South Africa
- 6.1. Turkey
- 6.2. Egypt
Cotton Industry Regional Market Share
Geographic Coverage of Cotton Industry
Cotton Industry REPORT HIGHLIGHTS
| Aspects | Details |
|---|---|
| Study Period | 2020-2034 |
| Base Year | 2025 |
| Estimated Year | 2026 |
| Forecast Period | 2026-2034 |
| Historical Period | 2020-2025 |
| Growth Rate | CAGR of 2.70% from 2020-2034 |
| Segmentation |
|
Table of Contents
- 1. Introduction
- 1.1. Research Scope
- 1.2. Market Segmentation
- 1.3. Research Objective
- 1.4. Definitions and Assumptions
- 2. Executive Summary
- 2.1. Market Snapshot
- 3. Market Dynamics
- 3.1. Market Drivers
- 3.2. Market Restrains
- 3.3. Market Trends
- 3.4. Market Opportunities
- 4. Market Factor Analysis
- 4.1. Porters Five Forces
- 4.1.1. Bargaining Power of Suppliers
- 4.1.2. Bargaining Power of Buyers
- 4.1.3. Threat of New Entrants
- 4.1.4. Threat of Substitutes
- 4.1.5. Competitive Rivalry
- 4.2. PESTEL analysis
- 4.3. BCG Analysis
- 4.3.1. Stars (High Growth, High Market Share)
- 4.3.2. Cash Cows (Low Growth, High Market Share)
- 4.3.3. Question Mark (High Growth, Low Market Share)
- 4.3.4. Dogs (Low Growth, Low Market Share)
- 4.4. Ansoff Matrix Analysis
- 4.5. Supply Chain Analysis
- 4.6. Regulatory Landscape
- 4.7. Current Market Potential and Opportunity Assessment (TAM–SAM–SOM Framework)
- 4.8. IMR Analyst Note
- 4.1. Porters Five Forces
- 5. Market Analysis, Insights and Forecast 2021-2033
- 5.1. Market Analysis, Insights and Forecast - by Production Analysis
- 5.2. Market Analysis, Insights and Forecast - by Consumption Analysis
- 5.3. Market Analysis, Insights and Forecast - by Import Market Analysis (Value & Volume)
- 5.4. Market Analysis, Insights and Forecast - by Export Market Analysis (Value & Volume)
- 5.5. Market Analysis, Insights and Forecast - by Price Trend Analysis
- 5.6. Market Analysis, Insights and Forecast - by Region
- 5.6.1. North America
- 5.6.2. Europe
- 5.6.3. Asia Pacific
- 5.6.4. South America
- 5.6.5. Middle East
- 5.6.6. South Africa
- 6. Global Cotton Industry Analysis, Insights and Forecast, 2021-2033
- 6.1. Market Analysis, Insights and Forecast - by Production Analysis
- 6.2. Market Analysis, Insights and Forecast - by Consumption Analysis
- 6.3. Market Analysis, Insights and Forecast - by Import Market Analysis (Value & Volume)
- 6.4. Market Analysis, Insights and Forecast - by Export Market Analysis (Value & Volume)
- 6.5. Market Analysis, Insights and Forecast - by Price Trend Analysis
- 7. North America Cotton Industry Analysis, Insights and Forecast, 2020-2032
- 7.1. Market Analysis, Insights and Forecast - by Production Analysis
- 7.2. Market Analysis, Insights and Forecast - by Consumption Analysis
- 7.3. Market Analysis, Insights and Forecast - by Import Market Analysis (Value & Volume)
- 7.4. Market Analysis, Insights and Forecast - by Export Market Analysis (Value & Volume)
- 7.5. Market Analysis, Insights and Forecast - by Price Trend Analysis
- 8. Europe Cotton Industry Analysis, Insights and Forecast, 2020-2032
- 8.1. Market Analysis, Insights and Forecast - by Production Analysis
- 8.2. Market Analysis, Insights and Forecast - by Consumption Analysis
- 8.3. Market Analysis, Insights and Forecast - by Import Market Analysis (Value & Volume)
- 8.4. Market Analysis, Insights and Forecast - by Export Market Analysis (Value & Volume)
- 8.5. Market Analysis, Insights and Forecast - by Price Trend Analysis
- 9. Asia Pacific Cotton Industry Analysis, Insights and Forecast, 2020-2032
- 9.1. Market Analysis, Insights and Forecast - by Production Analysis
- 9.2. Market Analysis, Insights and Forecast - by Consumption Analysis
- 9.3. Market Analysis, Insights and Forecast - by Import Market Analysis (Value & Volume)
- 9.4. Market Analysis, Insights and Forecast - by Export Market Analysis (Value & Volume)
- 9.5. Market Analysis, Insights and Forecast - by Price Trend Analysis
- 10. South America Cotton Industry Analysis, Insights and Forecast, 2020-2032
- 10.1. Market Analysis, Insights and Forecast - by Production Analysis
- 10.2. Market Analysis, Insights and Forecast - by Consumption Analysis
- 10.3. Market Analysis, Insights and Forecast - by Import Market Analysis (Value & Volume)
- 10.4. Market Analysis, Insights and Forecast - by Export Market Analysis (Value & Volume)
- 10.5. Market Analysis, Insights and Forecast - by Price Trend Analysis
- 11. Middle East Cotton Industry Analysis, Insights and Forecast, 2020-2032
- 11.1. Market Analysis, Insights and Forecast - by Production Analysis
- 11.2. Market Analysis, Insights and Forecast - by Consumption Analysis
- 11.3. Market Analysis, Insights and Forecast - by Import Market Analysis (Value & Volume)
- 11.4. Market Analysis, Insights and Forecast - by Export Market Analysis (Value & Volume)
- 11.5. Market Analysis, Insights and Forecast - by Price Trend Analysis
- 12. South Africa Cotton Industry Analysis, Insights and Forecast, 2020-2032
- 12.1. Market Analysis, Insights and Forecast - by Production Analysis
- 12.2. Market Analysis, Insights and Forecast - by Consumption Analysis
- 12.3. Market Analysis, Insights and Forecast - by Import Market Analysis (Value & Volume)
- 12.4. Market Analysis, Insights and Forecast - by Export Market Analysis (Value & Volume)
- 12.5. Market Analysis, Insights and Forecast - by Price Trend Analysis
- 13. Competitive Analysis
- 13.1. Company Profiles
- 13.1.1 Monsanto
- 13.1.1.1. Company Overview
- 13.1.1.2. Products
- 13.1.1.3. Company Financials
- 13.1.1.4. SWOT Analysis
- 13.1.2 National Cotton Council of America
- 13.1.2.1. Company Overview
- 13.1.2.2. Products
- 13.1.2.3. Company Financials
- 13.1.2.4. SWOT Analysis
- 13.1.3 Syngenta
- 13.1.3.1. Company Overview
- 13.1.3.2. Products
- 13.1.3.3. Company Financials
- 13.1.3.4. SWOT Analysis
- 13.1.4 The Texas Cotton Association
- 13.1.4.1. Company Overview
- 13.1.4.2. Products
- 13.1.4.3. Company Financials
- 13.1.4.4. SWOT Analysis
- 13.1.5 Cotton Incorporated
- 13.1.5.1. Company Overview
- 13.1.5.2. Products
- 13.1.5.3. Company Financials
- 13.1.5.4. SWOT Analysis
- 13.1.6 International Cotton Association
- 13.1.6.1. Company Overview
- 13.1.6.2. Products
- 13.1.6.3. Company Financials
- 13.1.6.4. SWOT Analysis
- 13.1.7 Bayer CropScience
- 13.1.7.1. Company Overview
- 13.1.7.2. Products
- 13.1.7.3. Company Financials
- 13.1.7.4. SWOT Analysis
- 13.1.1 Monsanto
- 13.2. Market Entropy
- 13.2.1 Company's Key Areas Served
- 13.2.2 Recent Developments
- 13.3. Company Market Share Analysis 2025
- 13.3.1 Top 5 Companies Market Share Analysis
- 13.3.2 Top 3 Companies Market Share Analysis
- 13.4. List of Potential Customers
- 14. Research Methodology
List of Figures
- Figure 1: Global Cotton Industry Revenue Breakdown (Million, %) by Region 2025 & 2033
- Figure 2: Global Cotton Industry Volume Breakdown (Kiloton, %) by Region 2025 & 2033
- Figure 3: North America Cotton Industry Revenue (Million), by Production Analysis 2025 & 2033
- Figure 4: North America Cotton Industry Volume (Kiloton), by Production Analysis 2025 & 2033
- Figure 5: North America Cotton Industry Revenue Share (%), by Production Analysis 2025 & 2033
- Figure 6: North America Cotton Industry Volume Share (%), by Production Analysis 2025 & 2033
- Figure 7: North America Cotton Industry Revenue (Million), by Consumption Analysis 2025 & 2033
- Figure 8: North America Cotton Industry Volume (Kiloton), by Consumption Analysis 2025 & 2033
- Figure 9: North America Cotton Industry Revenue Share (%), by Consumption Analysis 2025 & 2033
- Figure 10: North America Cotton Industry Volume Share (%), by Consumption Analysis 2025 & 2033
- Figure 11: North America Cotton Industry Revenue (Million), by Import Market Analysis (Value & Volume) 2025 & 2033
- Figure 12: North America Cotton Industry Volume (Kiloton), by Import Market Analysis (Value & Volume) 2025 & 2033
- Figure 13: North America Cotton Industry Revenue Share (%), by Import Market Analysis (Value & Volume) 2025 & 2033
- Figure 14: North America Cotton Industry Volume Share (%), by Import Market Analysis (Value & Volume) 2025 & 2033
- Figure 15: North America Cotton Industry Revenue (Million), by Export Market Analysis (Value & Volume) 2025 & 2033
- Figure 16: North America Cotton Industry Volume (Kiloton), by Export Market Analysis (Value & Volume) 2025 & 2033
- Figure 17: North America Cotton Industry Revenue Share (%), by Export Market Analysis (Value & Volume) 2025 & 2033
- Figure 18: North America Cotton Industry Volume Share (%), by Export Market Analysis (Value & Volume) 2025 & 2033
- Figure 19: North America Cotton Industry Revenue (Million), by Price Trend Analysis 2025 & 2033
- Figure 20: North America Cotton Industry Volume (Kiloton), by Price Trend Analysis 2025 & 2033
- Figure 21: North America Cotton Industry Revenue Share (%), by Price Trend Analysis 2025 & 2033
- Figure 22: North America Cotton Industry Volume Share (%), by Price Trend Analysis 2025 & 2033
- Figure 23: North America Cotton Industry Revenue (Million), by Country 2025 & 2033
- Figure 24: North America Cotton Industry Volume (Kiloton), by Country 2025 & 2033
- Figure 25: North America Cotton Industry Revenue Share (%), by Country 2025 & 2033
- Figure 26: North America Cotton Industry Volume Share (%), by Country 2025 & 2033
- Figure 27: Europe Cotton Industry Revenue (Million), by Production Analysis 2025 & 2033
- Figure 28: Europe Cotton Industry Volume (Kiloton), by Production Analysis 2025 & 2033
- Figure 29: Europe Cotton Industry Revenue Share (%), by Production Analysis 2025 & 2033
- Figure 30: Europe Cotton Industry Volume Share (%), by Production Analysis 2025 & 2033
- Figure 31: Europe Cotton Industry Revenue (Million), by Consumption Analysis 2025 & 2033
- Figure 32: Europe Cotton Industry Volume (Kiloton), by Consumption Analysis 2025 & 2033
- Figure 33: Europe Cotton Industry Revenue Share (%), by Consumption Analysis 2025 & 2033
- Figure 34: Europe Cotton Industry Volume Share (%), by Consumption Analysis 2025 & 2033
- Figure 35: Europe Cotton Industry Revenue (Million), by Import Market Analysis (Value & Volume) 2025 & 2033
- Figure 36: Europe Cotton Industry Volume (Kiloton), by Import Market Analysis (Value & Volume) 2025 & 2033
- Figure 37: Europe Cotton Industry Revenue Share (%), by Import Market Analysis (Value & Volume) 2025 & 2033
- Figure 38: Europe Cotton Industry Volume Share (%), by Import Market Analysis (Value & Volume) 2025 & 2033
- Figure 39: Europe Cotton Industry Revenue (Million), by Export Market Analysis (Value & Volume) 2025 & 2033
- Figure 40: Europe Cotton Industry Volume (Kiloton), by Export Market Analysis (Value & Volume) 2025 & 2033
- Figure 41: Europe Cotton Industry Revenue Share (%), by Export Market Analysis (Value & Volume) 2025 & 2033
- Figure 42: Europe Cotton Industry Volume Share (%), by Export Market Analysis (Value & Volume) 2025 & 2033
- Figure 43: Europe Cotton Industry Revenue (Million), by Price Trend Analysis 2025 & 2033
- Figure 44: Europe Cotton Industry Volume (Kiloton), by Price Trend Analysis 2025 & 2033
- Figure 45: Europe Cotton Industry Revenue Share (%), by Price Trend Analysis 2025 & 2033
- Figure 46: Europe Cotton Industry Volume Share (%), by Price Trend Analysis 2025 & 2033
- Figure 47: Europe Cotton Industry Revenue (Million), by Country 2025 & 2033
- Figure 48: Europe Cotton Industry Volume (Kiloton), by Country 2025 & 2033
- Figure 49: Europe Cotton Industry Revenue Share (%), by Country 2025 & 2033
- Figure 50: Europe Cotton Industry Volume Share (%), by Country 2025 & 2033
- Figure 51: Asia Pacific Cotton Industry Revenue (Million), by Production Analysis 2025 & 2033
- Figure 52: Asia Pacific Cotton Industry Volume (Kiloton), by Production Analysis 2025 & 2033
- Figure 53: Asia Pacific Cotton Industry Revenue Share (%), by Production Analysis 2025 & 2033
- Figure 54: Asia Pacific Cotton Industry Volume Share (%), by Production Analysis 2025 & 2033
- Figure 55: Asia Pacific Cotton Industry Revenue (Million), by Consumption Analysis 2025 & 2033
- Figure 56: Asia Pacific Cotton Industry Volume (Kiloton), by Consumption Analysis 2025 & 2033
- Figure 57: Asia Pacific Cotton Industry Revenue Share (%), by Consumption Analysis 2025 & 2033
- Figure 58: Asia Pacific Cotton Industry Volume Share (%), by Consumption Analysis 2025 & 2033
- Figure 59: Asia Pacific Cotton Industry Revenue (Million), by Import Market Analysis (Value & Volume) 2025 & 2033
- Figure 60: Asia Pacific Cotton Industry Volume (Kiloton), by Import Market Analysis (Value & Volume) 2025 & 2033
- Figure 61: Asia Pacific Cotton Industry Revenue Share (%), by Import Market Analysis (Value & Volume) 2025 & 2033
- Figure 62: Asia Pacific Cotton Industry Volume Share (%), by Import Market Analysis (Value & Volume) 2025 & 2033
- Figure 63: Asia Pacific Cotton Industry Revenue (Million), by Export Market Analysis (Value & Volume) 2025 & 2033
- Figure 64: Asia Pacific Cotton Industry Volume (Kiloton), by Export Market Analysis (Value & Volume) 2025 & 2033
- Figure 65: Asia Pacific Cotton Industry Revenue Share (%), by Export Market Analysis (Value & Volume) 2025 & 2033
- Figure 66: Asia Pacific Cotton Industry Volume Share (%), by Export Market Analysis (Value & Volume) 2025 & 2033
- Figure 67: Asia Pacific Cotton Industry Revenue (Million), by Price Trend Analysis 2025 & 2033
- Figure 68: Asia Pacific Cotton Industry Volume (Kiloton), by Price Trend Analysis 2025 & 2033
- Figure 69: Asia Pacific Cotton Industry Revenue Share (%), by Price Trend Analysis 2025 & 2033
- Figure 70: Asia Pacific Cotton Industry Volume Share (%), by Price Trend Analysis 2025 & 2033
- Figure 71: Asia Pacific Cotton Industry Revenue (Million), by Country 2025 & 2033
- Figure 72: Asia Pacific Cotton Industry Volume (Kiloton), by Country 2025 & 2033
- Figure 73: Asia Pacific Cotton Industry Revenue Share (%), by Country 2025 & 2033
- Figure 74: Asia Pacific Cotton Industry Volume Share (%), by Country 2025 & 2033
- Figure 75: South America Cotton Industry Revenue (Million), by Production Analysis 2025 & 2033
- Figure 76: South America Cotton Industry Volume (Kiloton), by Production Analysis 2025 & 2033
- Figure 77: South America Cotton Industry Revenue Share (%), by Production Analysis 2025 & 2033
- Figure 78: South America Cotton Industry Volume Share (%), by Production Analysis 2025 & 2033
- Figure 79: South America Cotton Industry Revenue (Million), by Consumption Analysis 2025 & 2033
- Figure 80: South America Cotton Industry Volume (Kiloton), by Consumption Analysis 2025 & 2033
- Figure 81: South America Cotton Industry Revenue Share (%), by Consumption Analysis 2025 & 2033
- Figure 82: South America Cotton Industry Volume Share (%), by Consumption Analysis 2025 & 2033
- Figure 83: South America Cotton Industry Revenue (Million), by Import Market Analysis (Value & Volume) 2025 & 2033
- Figure 84: South America Cotton Industry Volume (Kiloton), by Import Market Analysis (Value & Volume) 2025 & 2033
- Figure 85: South America Cotton Industry Revenue Share (%), by Import Market Analysis (Value & Volume) 2025 & 2033
- Figure 86: South America Cotton Industry Volume Share (%), by Import Market Analysis (Value & Volume) 2025 & 2033
- Figure 87: South America Cotton Industry Revenue (Million), by Export Market Analysis (Value & Volume) 2025 & 2033
- Figure 88: South America Cotton Industry Volume (Kiloton), by Export Market Analysis (Value & Volume) 2025 & 2033
- Figure 89: South America Cotton Industry Revenue Share (%), by Export Market Analysis (Value & Volume) 2025 & 2033
- Figure 90: South America Cotton Industry Volume Share (%), by Export Market Analysis (Value & Volume) 2025 & 2033
- Figure 91: South America Cotton Industry Revenue (Million), by Price Trend Analysis 2025 & 2033
- Figure 92: South America Cotton Industry Volume (Kiloton), by Price Trend Analysis 2025 & 2033
- Figure 93: South America Cotton Industry Revenue Share (%), by Price Trend Analysis 2025 & 2033
- Figure 94: South America Cotton Industry Volume Share (%), by Price Trend Analysis 2025 & 2033
- Figure 95: South America Cotton Industry Revenue (Million), by Country 2025 & 2033
- Figure 96: South America Cotton Industry Volume (Kiloton), by Country 2025 & 2033
- Figure 97: South America Cotton Industry Revenue Share (%), by Country 2025 & 2033
- Figure 98: South America Cotton Industry Volume Share (%), by Country 2025 & 2033
- Figure 99: Middle East Cotton Industry Revenue (Million), by Production Analysis 2025 & 2033
- Figure 100: Middle East Cotton Industry Volume (Kiloton), by Production Analysis 2025 & 2033
- Figure 101: Middle East Cotton Industry Revenue Share (%), by Production Analysis 2025 & 2033
- Figure 102: Middle East Cotton Industry Volume Share (%), by Production Analysis 2025 & 2033
- Figure 103: Middle East Cotton Industry Revenue (Million), by Consumption Analysis 2025 & 2033
- Figure 104: Middle East Cotton Industry Volume (Kiloton), by Consumption Analysis 2025 & 2033
- Figure 105: Middle East Cotton Industry Revenue Share (%), by Consumption Analysis 2025 & 2033
- Figure 106: Middle East Cotton Industry Volume Share (%), by Consumption Analysis 2025 & 2033
- Figure 107: Middle East Cotton Industry Revenue (Million), by Import Market Analysis (Value & Volume) 2025 & 2033
- Figure 108: Middle East Cotton Industry Volume (Kiloton), by Import Market Analysis (Value & Volume) 2025 & 2033
- Figure 109: Middle East Cotton Industry Revenue Share (%), by Import Market Analysis (Value & Volume) 2025 & 2033
- Figure 110: Middle East Cotton Industry Volume Share (%), by Import Market Analysis (Value & Volume) 2025 & 2033
- Figure 111: Middle East Cotton Industry Revenue (Million), by Export Market Analysis (Value & Volume) 2025 & 2033
- Figure 112: Middle East Cotton Industry Volume (Kiloton), by Export Market Analysis (Value & Volume) 2025 & 2033
- Figure 113: Middle East Cotton Industry Revenue Share (%), by Export Market Analysis (Value & Volume) 2025 & 2033
- Figure 114: Middle East Cotton Industry Volume Share (%), by Export Market Analysis (Value & Volume) 2025 & 2033
- Figure 115: Middle East Cotton Industry Revenue (Million), by Price Trend Analysis 2025 & 2033
- Figure 116: Middle East Cotton Industry Volume (Kiloton), by Price Trend Analysis 2025 & 2033
- Figure 117: Middle East Cotton Industry Revenue Share (%), by Price Trend Analysis 2025 & 2033
- Figure 118: Middle East Cotton Industry Volume Share (%), by Price Trend Analysis 2025 & 2033
- Figure 119: Middle East Cotton Industry Revenue (Million), by Country 2025 & 2033
- Figure 120: Middle East Cotton Industry Volume (Kiloton), by Country 2025 & 2033
- Figure 121: Middle East Cotton Industry Revenue Share (%), by Country 2025 & 2033
- Figure 122: Middle East Cotton Industry Volume Share (%), by Country 2025 & 2033
- Figure 123: South Africa Cotton Industry Revenue (Million), by Production Analysis 2025 & 2033
- Figure 124: South Africa Cotton Industry Volume (Kiloton), by Production Analysis 2025 & 2033
- Figure 125: South Africa Cotton Industry Revenue Share (%), by Production Analysis 2025 & 2033
- Figure 126: South Africa Cotton Industry Volume Share (%), by Production Analysis 2025 & 2033
- Figure 127: South Africa Cotton Industry Revenue (Million), by Consumption Analysis 2025 & 2033
- Figure 128: South Africa Cotton Industry Volume (Kiloton), by Consumption Analysis 2025 & 2033
- Figure 129: South Africa Cotton Industry Revenue Share (%), by Consumption Analysis 2025 & 2033
- Figure 130: South Africa Cotton Industry Volume Share (%), by Consumption Analysis 2025 & 2033
- Figure 131: South Africa Cotton Industry Revenue (Million), by Import Market Analysis (Value & Volume) 2025 & 2033
- Figure 132: South Africa Cotton Industry Volume (Kiloton), by Import Market Analysis (Value & Volume) 2025 & 2033
- Figure 133: South Africa Cotton Industry Revenue Share (%), by Import Market Analysis (Value & Volume) 2025 & 2033
- Figure 134: South Africa Cotton Industry Volume Share (%), by Import Market Analysis (Value & Volume) 2025 & 2033
- Figure 135: South Africa Cotton Industry Revenue (Million), by Export Market Analysis (Value & Volume) 2025 & 2033
- Figure 136: South Africa Cotton Industry Volume (Kiloton), by Export Market Analysis (Value & Volume) 2025 & 2033
- Figure 137: South Africa Cotton Industry Revenue Share (%), by Export Market Analysis (Value & Volume) 2025 & 2033
- Figure 138: South Africa Cotton Industry Volume Share (%), by Export Market Analysis (Value & Volume) 2025 & 2033
- Figure 139: South Africa Cotton Industry Revenue (Million), by Price Trend Analysis 2025 & 2033
- Figure 140: South Africa Cotton Industry Volume (Kiloton), by Price Trend Analysis 2025 & 2033
- Figure 141: South Africa Cotton Industry Revenue Share (%), by Price Trend Analysis 2025 & 2033
- Figure 142: South Africa Cotton Industry Volume Share (%), by Price Trend Analysis 2025 & 2033
- Figure 143: South Africa Cotton Industry Revenue (Million), by Country 2025 & 2033
- Figure 144: South Africa Cotton Industry Volume (Kiloton), by Country 2025 & 2033
- Figure 145: South Africa Cotton Industry Revenue Share (%), by Country 2025 & 2033
- Figure 146: South Africa Cotton Industry Volume Share (%), by Country 2025 & 2033
List of Tables
- Table 1: Global Cotton Industry Revenue Million Forecast, by Production Analysis 2020 & 2033
- Table 2: Global Cotton Industry Volume Kiloton Forecast, by Production Analysis 2020 & 2033
- Table 3: Global Cotton Industry Revenue Million Forecast, by Consumption Analysis 2020 & 2033
- Table 4: Global Cotton Industry Volume Kiloton Forecast, by Consumption Analysis 2020 & 2033
- Table 5: Global Cotton Industry Revenue Million Forecast, by Import Market Analysis (Value & Volume) 2020 & 2033
- Table 6: Global Cotton Industry Volume Kiloton Forecast, by Import Market Analysis (Value & Volume) 2020 & 2033
- Table 7: Global Cotton Industry Revenue Million Forecast, by Export Market Analysis (Value & Volume) 2020 & 2033
- Table 8: Global Cotton Industry Volume Kiloton Forecast, by Export Market Analysis (Value & Volume) 2020 & 2033
- Table 9: Global Cotton Industry Revenue Million Forecast, by Price Trend Analysis 2020 & 2033
- Table 10: Global Cotton Industry Volume Kiloton Forecast, by Price Trend Analysis 2020 & 2033
- Table 11: Global Cotton Industry Revenue Million Forecast, by Region 2020 & 2033
- Table 12: Global Cotton Industry Volume Kiloton Forecast, by Region 2020 & 2033
- Table 13: Global Cotton Industry Revenue Million Forecast, by Production Analysis 2020 & 2033
- Table 14: Global Cotton Industry Volume Kiloton Forecast, by Production Analysis 2020 & 2033
- Table 15: Global Cotton Industry Revenue Million Forecast, by Consumption Analysis 2020 & 2033
- Table 16: Global Cotton Industry Volume Kiloton Forecast, by Consumption Analysis 2020 & 2033
- Table 17: Global Cotton Industry Revenue Million Forecast, by Import Market Analysis (Value & Volume) 2020 & 2033
- Table 18: Global Cotton Industry Volume Kiloton Forecast, by Import Market Analysis (Value & Volume) 2020 & 2033
- Table 19: Global Cotton Industry Revenue Million Forecast, by Export Market Analysis (Value & Volume) 2020 & 2033
- Table 20: Global Cotton Industry Volume Kiloton Forecast, by Export Market Analysis (Value & Volume) 2020 & 2033
- Table 21: Global Cotton Industry Revenue Million Forecast, by Price Trend Analysis 2020 & 2033
- Table 22: Global Cotton Industry Volume Kiloton Forecast, by Price Trend Analysis 2020 & 2033
- Table 23: Global Cotton Industry Revenue Million Forecast, by Country 2020 & 2033
- Table 24: Global Cotton Industry Volume Kiloton Forecast, by Country 2020 & 2033
- Table 25: United States Cotton Industry Revenue (Million) Forecast, by Application 2020 & 2033
- Table 26: United States Cotton Industry Volume (Kiloton) Forecast, by Application 2020 & 2033
- Table 27: Canada Cotton Industry Revenue (Million) Forecast, by Application 2020 & 2033
- Table 28: Canada Cotton Industry Volume (Kiloton) Forecast, by Application 2020 & 2033
- Table 29: Mexico Cotton Industry Revenue (Million) Forecast, by Application 2020 & 2033
- Table 30: Mexico Cotton Industry Volume (Kiloton) Forecast, by Application 2020 & 2033
- Table 31: Global Cotton Industry Revenue Million Forecast, by Production Analysis 2020 & 2033
- Table 32: Global Cotton Industry Volume Kiloton Forecast, by Production Analysis 2020 & 2033
- Table 33: Global Cotton Industry Revenue Million Forecast, by Consumption Analysis 2020 & 2033
- Table 34: Global Cotton Industry Volume Kiloton Forecast, by Consumption Analysis 2020 & 2033
- Table 35: Global Cotton Industry Revenue Million Forecast, by Import Market Analysis (Value & Volume) 2020 & 2033
- Table 36: Global Cotton Industry Volume Kiloton Forecast, by Import Market Analysis (Value & Volume) 2020 & 2033
- Table 37: Global Cotton Industry Revenue Million Forecast, by Export Market Analysis (Value & Volume) 2020 & 2033
- Table 38: Global Cotton Industry Volume Kiloton Forecast, by Export Market Analysis (Value & Volume) 2020 & 2033
- Table 39: Global Cotton Industry Revenue Million Forecast, by Price Trend Analysis 2020 & 2033
- Table 40: Global Cotton Industry Volume Kiloton Forecast, by Price Trend Analysis 2020 & 2033
- Table 41: Global Cotton Industry Revenue Million Forecast, by Country 2020 & 2033
- Table 42: Global Cotton Industry Volume Kiloton Forecast, by Country 2020 & 2033
- Table 43: Germany Cotton Industry Revenue (Million) Forecast, by Application 2020 & 2033
- Table 44: Germany Cotton Industry Volume (Kiloton) Forecast, by Application 2020 & 2033
- Table 45: France Cotton Industry Revenue (Million) Forecast, by Application 2020 & 2033
- Table 46: France Cotton Industry Volume (Kiloton) Forecast, by Application 2020 & 2033
- Table 47: Russia Cotton Industry Revenue (Million) Forecast, by Application 2020 & 2033
- Table 48: Russia Cotton Industry Volume (Kiloton) Forecast, by Application 2020 & 2033
- Table 49: Greece Cotton Industry Revenue (Million) Forecast, by Application 2020 & 2033
- Table 50: Greece Cotton Industry Volume (Kiloton) Forecast, by Application 2020 & 2033
- Table 51: Italy Cotton Industry Revenue (Million) Forecast, by Application 2020 & 2033
- Table 52: Italy Cotton Industry Volume (Kiloton) Forecast, by Application 2020 & 2033
- Table 53: Global Cotton Industry Revenue Million Forecast, by Production Analysis 2020 & 2033
- Table 54: Global Cotton Industry Volume Kiloton Forecast, by Production Analysis 2020 & 2033
- Table 55: Global Cotton Industry Revenue Million Forecast, by Consumption Analysis 2020 & 2033
- Table 56: Global Cotton Industry Volume Kiloton Forecast, by Consumption Analysis 2020 & 2033
- Table 57: Global Cotton Industry Revenue Million Forecast, by Import Market Analysis (Value & Volume) 2020 & 2033
- Table 58: Global Cotton Industry Volume Kiloton Forecast, by Import Market Analysis (Value & Volume) 2020 & 2033
- Table 59: Global Cotton Industry Revenue Million Forecast, by Export Market Analysis (Value & Volume) 2020 & 2033
- Table 60: Global Cotton Industry Volume Kiloton Forecast, by Export Market Analysis (Value & Volume) 2020 & 2033
- Table 61: Global Cotton Industry Revenue Million Forecast, by Price Trend Analysis 2020 & 2033
- Table 62: Global Cotton Industry Volume Kiloton Forecast, by Price Trend Analysis 2020 & 2033
- Table 63: Global Cotton Industry Revenue Million Forecast, by Country 2020 & 2033
- Table 64: Global Cotton Industry Volume Kiloton Forecast, by Country 2020 & 2033
- Table 65: China Cotton Industry Revenue (Million) Forecast, by Application 2020 & 2033
- Table 66: China Cotton Industry Volume (Kiloton) Forecast, by Application 2020 & 2033
- Table 67: India Cotton Industry Revenue (Million) Forecast, by Application 2020 & 2033
- Table 68: India Cotton Industry Volume (Kiloton) Forecast, by Application 2020 & 2033
- Table 69: Australia Cotton Industry Revenue (Million) Forecast, by Application 2020 & 2033
- Table 70: Australia Cotton Industry Volume (Kiloton) Forecast, by Application 2020 & 2033
- Table 71: Pakistan Cotton Industry Revenue (Million) Forecast, by Application 2020 & 2033
- Table 72: Pakistan Cotton Industry Volume (Kiloton) Forecast, by Application 2020 & 2033
- Table 73: Bangladesh Cotton Industry Revenue (Million) Forecast, by Application 2020 & 2033
- Table 74: Bangladesh Cotton Industry Volume (Kiloton) Forecast, by Application 2020 & 2033
- Table 75: Global Cotton Industry Revenue Million Forecast, by Production Analysis 2020 & 2033
- Table 76: Global Cotton Industry Volume Kiloton Forecast, by Production Analysis 2020 & 2033
- Table 77: Global Cotton Industry Revenue Million Forecast, by Consumption Analysis 2020 & 2033
- Table 78: Global Cotton Industry Volume Kiloton Forecast, by Consumption Analysis 2020 & 2033
- Table 79: Global Cotton Industry Revenue Million Forecast, by Import Market Analysis (Value & Volume) 2020 & 2033
- Table 80: Global Cotton Industry Volume Kiloton Forecast, by Import Market Analysis (Value & Volume) 2020 & 2033
- Table 81: Global Cotton Industry Revenue Million Forecast, by Export Market Analysis (Value & Volume) 2020 & 2033
- Table 82: Global Cotton Industry Volume Kiloton Forecast, by Export Market Analysis (Value & Volume) 2020 & 2033
- Table 83: Global Cotton Industry Revenue Million Forecast, by Price Trend Analysis 2020 & 2033
- Table 84: Global Cotton Industry Volume Kiloton Forecast, by Price Trend Analysis 2020 & 2033
- Table 85: Global Cotton Industry Revenue Million Forecast, by Country 2020 & 2033
- Table 86: Global Cotton Industry Volume Kiloton Forecast, by Country 2020 & 2033
- Table 87: Brazil Cotton Industry Revenue (Million) Forecast, by Application 2020 & 2033
- Table 88: Brazil Cotton Industry Volume (Kiloton) Forecast, by Application 2020 & 2033
- Table 89: Argentina Cotton Industry Revenue (Million) Forecast, by Application 2020 & 2033
- Table 90: Argentina Cotton Industry Volume (Kiloton) Forecast, by Application 2020 & 2033
- Table 91: Global Cotton Industry Revenue Million Forecast, by Production Analysis 2020 & 2033
- Table 92: Global Cotton Industry Volume Kiloton Forecast, by Production Analysis 2020 & 2033
- Table 93: Global Cotton Industry Revenue Million Forecast, by Consumption Analysis 2020 & 2033
- Table 94: Global Cotton Industry Volume Kiloton Forecast, by Consumption Analysis 2020 & 2033
- Table 95: Global Cotton Industry Revenue Million Forecast, by Import Market Analysis (Value & Volume) 2020 & 2033
- Table 96: Global Cotton Industry Volume Kiloton Forecast, by Import Market Analysis (Value & Volume) 2020 & 2033
- Table 97: Global Cotton Industry Revenue Million Forecast, by Export Market Analysis (Value & Volume) 2020 & 2033
- Table 98: Global Cotton Industry Volume Kiloton Forecast, by Export Market Analysis (Value & Volume) 2020 & 2033
- Table 99: Global Cotton Industry Revenue Million Forecast, by Price Trend Analysis 2020 & 2033
- Table 100: Global Cotton Industry Volume Kiloton Forecast, by Price Trend Analysis 2020 & 2033
- Table 101: Global Cotton Industry Revenue Million Forecast, by Country 2020 & 2033
- Table 102: Global Cotton Industry Volume Kiloton Forecast, by Country 2020 & 2033
- Table 103: Global Cotton Industry Revenue Million Forecast, by Production Analysis 2020 & 2033
- Table 104: Global Cotton Industry Volume Kiloton Forecast, by Production Analysis 2020 & 2033
- Table 105: Global Cotton Industry Revenue Million Forecast, by Consumption Analysis 2020 & 2033
- Table 106: Global Cotton Industry Volume Kiloton Forecast, by Consumption Analysis 2020 & 2033
- Table 107: Global Cotton Industry Revenue Million Forecast, by Import Market Analysis (Value & Volume) 2020 & 2033
- Table 108: Global Cotton Industry Volume Kiloton Forecast, by Import Market Analysis (Value & Volume) 2020 & 2033
- Table 109: Global Cotton Industry Revenue Million Forecast, by Export Market Analysis (Value & Volume) 2020 & 2033
- Table 110: Global Cotton Industry Volume Kiloton Forecast, by Export Market Analysis (Value & Volume) 2020 & 2033
- Table 111: Global Cotton Industry Revenue Million Forecast, by Price Trend Analysis 2020 & 2033
- Table 112: Global Cotton Industry Volume Kiloton Forecast, by Price Trend Analysis 2020 & 2033
- Table 113: Global Cotton Industry Revenue Million Forecast, by Country 2020 & 2033
- Table 114: Global Cotton Industry Volume Kiloton Forecast, by Country 2020 & 2033
- Table 115: Turkey Cotton Industry Revenue (Million) Forecast, by Application 2020 & 2033
- Table 116: Turkey Cotton Industry Volume (Kiloton) Forecast, by Application 2020 & 2033
- Table 117: Egypt Cotton Industry Revenue (Million) Forecast, by Application 2020 & 2033
- Table 118: Egypt Cotton Industry Volume (Kiloton) Forecast, by Application 2020 & 2033
Frequently Asked Questions
1. What is the projected Compound Annual Growth Rate (CAGR) of the Cotton Industry?
The projected CAGR is approximately 2.70%.
2. Which companies are prominent players in the Cotton Industry?
Key companies in the market include Monsanto, National Cotton Council of America, Syngenta , The Texas Cotton Association, Cotton Incorporated , International Cotton Association , Bayer CropScience .
3. What are the main segments of the Cotton Industry?
The market segments include Production Analysis, Consumption Analysis, Import Market Analysis (Value & Volume), Export Market Analysis (Value & Volume), Price Trend Analysis.
4. Can you provide details about the market size?
The market size is estimated to be USD 43.96 Million as of 2022.
5. What are some drivers contributing to market growth?
Rising Demand for Milled and Broken Rice; Growing Preference for Speciality Rice Variety; Government Initiatives Supports Rice Production.
6. What are the notable trends driving market growth?
Increasing demand for the cotton exports.
7. Are there any restraints impacting market growth?
Lack of Supply Chain for Rice; Growing Agricultural Labor Crisis.
8. Can you provide examples of recent developments in the market?
September 2022: The two first-ever new organic cotton varieties have been made available to farmers in India. These varieties were developed through a decentralized organic participatory breeding program of FiBL Switzerland and their partners.
9. What pricing options are available for accessing the report?
Pricing options include single-user, multi-user, and enterprise licenses priced at USD 4750, USD 5250, and USD 8750 respectively.
10. Is the market size provided in terms of value or volume?
The market size is provided in terms of value, measured in Million and volume, measured in Kiloton.
11. Are there any specific market keywords associated with the report?
Yes, the market keyword associated with the report is "Cotton Industry," which aids in identifying and referencing the specific market segment covered.
12. How do I determine which pricing option suits my needs best?
The pricing options vary based on user requirements and access needs. Individual users may opt for single-user licenses, while businesses requiring broader access may choose multi-user or enterprise licenses for cost-effective access to the report.
13. Are there any additional resources or data provided in the Cotton Industry report?
While the report offers comprehensive insights, it's advisable to review the specific contents or supplementary materials provided to ascertain if additional resources or data are available.
14. How can I stay updated on further developments or reports in the Cotton Industry?
To stay informed about further developments, trends, and reports in the Cotton Industry, consider subscribing to industry newsletters, following relevant companies and organizations, or regularly checking reputable industry news sources and publications.
Methodology
Step 1 - Identification of Relevant Samples Size from Population Database


Step 2 - Approaches for Defining Global Market Size (Value, Volume* & Price*)

Note*: In applicable scenarios
Step 3 - Data Sources
Primary Research
- Web Analytics
- Survey Reports
- Research Institute
- Latest Research Reports
- Opinion Leaders
Secondary Research
- Annual Reports
- White Paper
- Latest Press Release
- Industry Association
- Paid Database
- Investor Presentations

Step 4 - Data Triangulation
Involves using different sources of information in order to increase the validity of a study
These sources are likely to be stakeholders in a program - participants, other researchers, program staff, other community members, and so on.
Then we put all data in single framework & apply various statistical tools to find out the dynamic on the market.
During the analysis stage, feedback from the stakeholder groups would be compared to determine areas of agreement as well as areas of divergence