

Key Insights
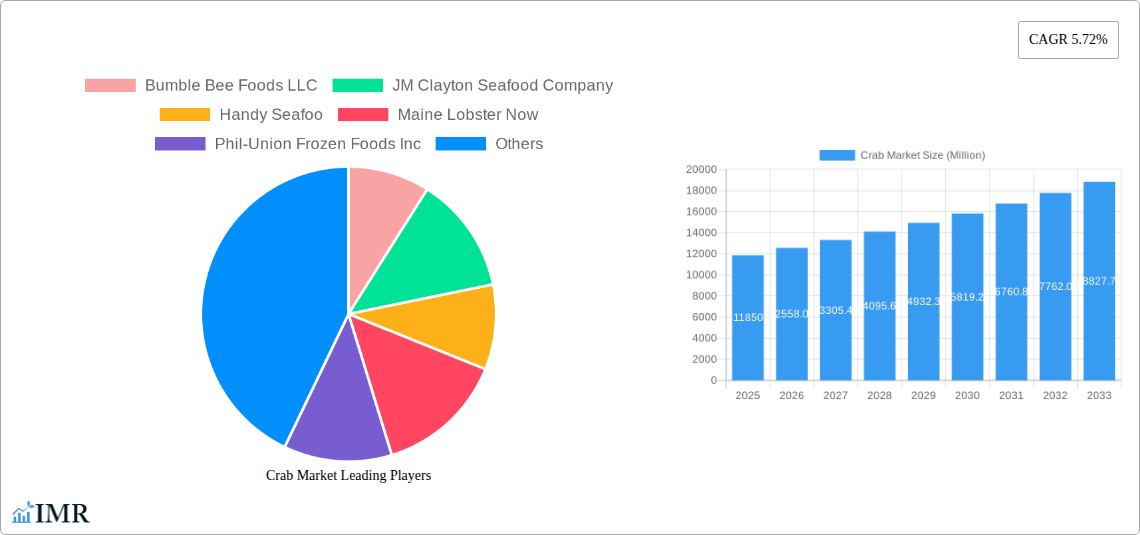
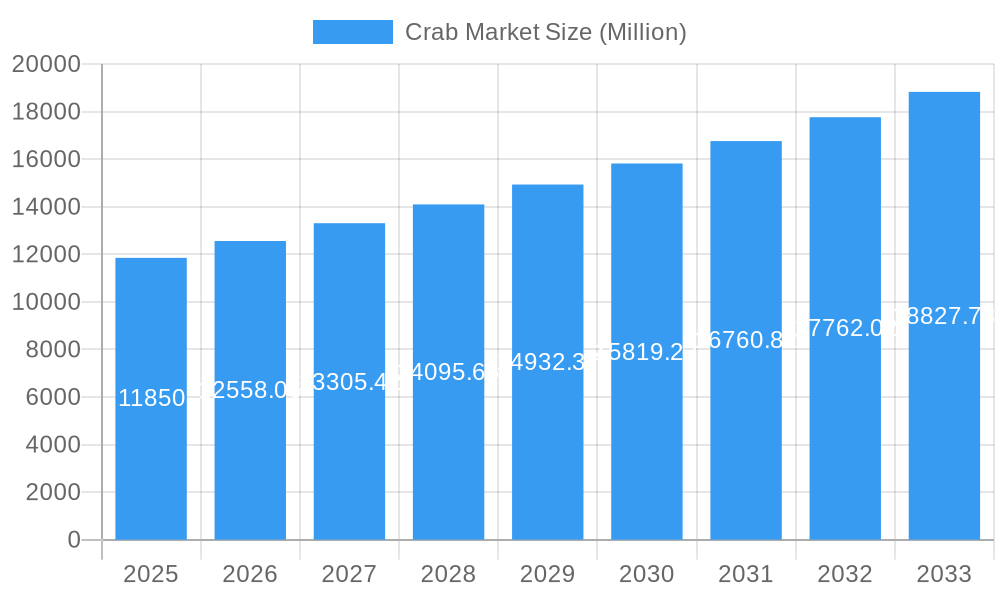
The global crab market, valued at $11.85 billion in 2025, is projected to experience robust growth, exhibiting a Compound Annual Growth Rate (CAGR) of 5.72% from 2025 to 2033. This expansion is driven by several key factors. Rising consumer demand for seafood, particularly crab, fueled by its nutritional value and culinary versatility, is a primary driver. Growing popularity of crab in diverse cuisines globally, along with increasing disposable incomes in developing economies, further contributes to market growth. The market is segmented by form (frozen, canned, other) and type (blue crab, Chinese mitten crab, gazami crab, other), with frozen crab dominating due to its extended shelf life and convenience. While the canned segment holds a significant share, the "other forms" category, encompassing pre-cooked and ready-to-eat options, is expected to see the fastest growth, driven by evolving consumer preferences for convenience and ready-to-eat meals. Furthermore, strategic partnerships between seafood processing companies and retailers are strengthening distribution channels and boosting market penetration. Geographic expansion into new markets, coupled with innovative product development and marketing strategies, will further enhance market prospects.
Crab Market Market Size (In Billion)
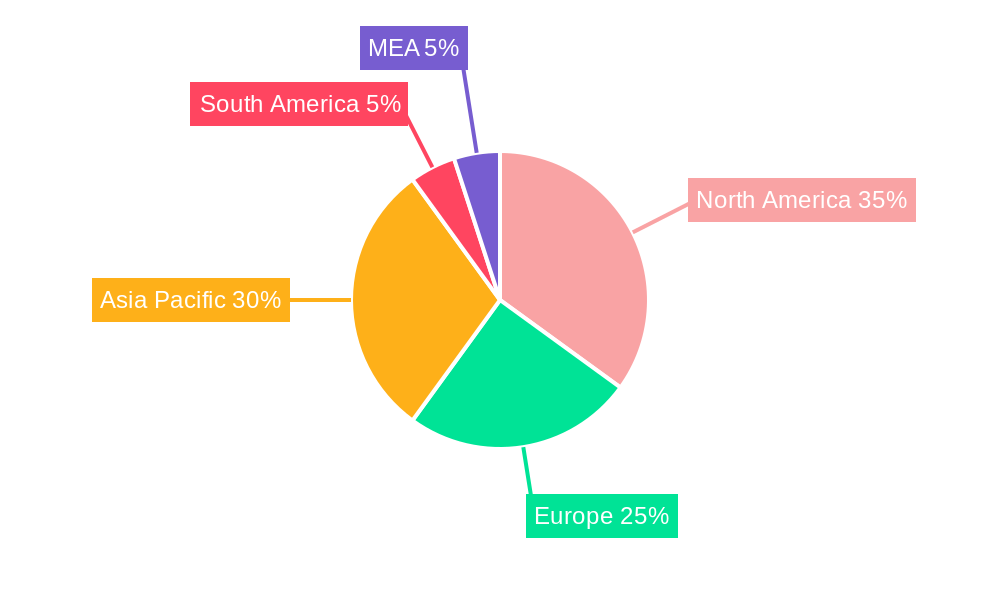
However, challenges remain. Fluctuations in crab supply due to environmental factors like overfishing and climate change pose a significant threat to market stability. Stringent regulations concerning sustainable fishing practices and rising input costs (labor, fuel, packaging) also exert pressure on profitability. Nevertheless, the industry is actively working to mitigate these challenges through sustainable fishing initiatives, technological advancements in crab farming, and efficient supply chain management. The market's future growth hinges on striking a balance between meeting the growing demand and ensuring the long-term sustainability of the crab fishery. The leading companies, including Bumble Bee Foods LLC, JM Clayton Seafood Company, and others, are strategically investing in sustainable sourcing, processing innovation, and market expansion to maintain their competitive edge in this dynamic market. Regional analysis reveals that North America and Asia-Pacific are currently the largest markets, while emerging markets in South America and the Middle East and Africa offer significant growth potential.
Crab Market Company Market Share
Crab Market: A Comprehensive Market Report (2019-2033)
This in-depth report provides a comprehensive analysis of the global crab market, encompassing market dynamics, growth trends, regional analysis, product landscape, key players, and future outlook. The study period covers 2019-2033, with 2025 as the base and estimated year. The forecast period spans 2025-2033, and the historical period covers 2019-2024. This report is essential for industry professionals, investors, and anyone seeking a detailed understanding of this dynamic market. The total market size in 2025 is estimated at XXX Million units.
Crab Market Market Dynamics & Structure
The global crab market is characterized by moderate concentration, with several key players holding significant market share. Technological innovations, particularly in processing and preservation techniques, are driving growth. Stringent regulatory frameworks concerning food safety and sustainability influence market practices. Competitive substitutes, such as other seafood options, pose a challenge, impacting market penetration. End-user demographics, including changing consumer preferences towards healthy and sustainable food options, are key drivers of market growth. M&A activity in the sector has been relatively moderate, with approximately xx deals recorded between 2019 and 2024, resulting in a xx% market share shift among the top players.
- Market Concentration: Moderately concentrated, with top 5 players holding xx% market share in 2025.
- Technological Innovation: Focus on automation, improved freezing/canning techniques, and sustainable fishing practices.
- Regulatory Framework: Stringent food safety and sustainability regulations impact operational costs and market entry.
- Competitive Substitutes: Other seafood (e.g., shrimp, lobster) pose a competitive threat.
- End-User Demographics: Growing demand for convenient and healthy seafood options among health-conscious consumers.
- M&A Trends: Moderate M&A activity, driven by consolidation and expansion strategies.
Crab Market Growth Trends & Insights
The global crab market experienced significant growth between 2019 and 2024, with a CAGR of xx%. This growth is attributed to factors such as rising disposable incomes in emerging economies, increasing demand for seafood, and the introduction of innovative crab-based products. Technological advancements in processing and preservation techniques have also contributed to improved product quality and availability, further driving market expansion. Consumer behavior is shifting toward healthier food choices, boosting the demand for crab meat, recognized for its high protein content and nutritional value. Market penetration of frozen and canned crab products remains high, but growth is projected in other forms, such as ready-to-eat crab dishes. The market is expected to continue its growth trajectory during the forecast period (2025-2033), with a projected CAGR of xx%.
Dominant Regions, Countries, or Segments in Crab Market
The Asia-Pacific region currently dominates the global crab market, accounting for xx% of the total market share in 2025. This dominance is driven by factors such as high crab consumption, established supply chains, and favorable economic conditions. Within this region, China and Japan are the leading consumers and producers of crab. In terms of product form, the frozen segment holds the largest market share (xx%), followed by canned (xx%) and other forms (xx%). Among crab types, blue crab holds the largest share (xx%), followed by Chinese mitten crab (xx%) and Gazami crab (xx%).
- Key Drivers in Asia-Pacific: High per capita consumption, well-developed aquaculture industry, strong export markets.
- Frozen Segment Dominance: Convenience, longer shelf life, and wide distribution channels contribute to high market share.
- Blue Crab Preference: High demand due to taste, texture, and wide availability.
Crab Market Product Landscape
The crab market offers a diverse range of products, including frozen crab meat, canned crab meat, and various ready-to-eat crab dishes. Recent innovations focus on improving the convenience and shelf life of crab products, such as individual-sized packs and ready-to-cook options. Technological advancements in processing have enhanced product quality and reduced waste. Unique selling propositions include superior taste and texture, sustainable sourcing, and convenient packaging. The market sees continuous improvements in processing technologies, ensuring a consistently high-quality product.
Key Drivers, Barriers & Challenges in Crab Market
Key Drivers:
- Growing consumer demand for seafood.
- Increasing disposable incomes in emerging markets.
- Technological advancements in processing and preservation.
- Health benefits associated with crab consumption.
Key Challenges and Restraints:
- Fluctuations in crab supply due to environmental factors and overfishing (xx% impact on market supply in 2024).
- Rising operational costs, including labor and raw material prices.
- Stringent regulations regarding seafood safety and sustainability.
- Competition from substitute seafood products.
Emerging Opportunities in Crab Market
- Expanding into untapped markets in Africa and South America.
- Developing innovative crab-based products targeting specific consumer segments.
- Focusing on sustainable sourcing and eco-friendly packaging to enhance brand image and appeal to environmentally conscious consumers.
- Exploring opportunities in the functional food and nutraceutical sectors.
Growth Accelerators in the Crab Market Industry
Technological breakthroughs in aquaculture and sustainable fishing practices will be pivotal in ensuring long-term growth. Strategic partnerships between producers, processors, and retailers will optimize supply chains and enhance market efficiency. Expansion into new markets and product diversification, targeting diverse consumer preferences, will further drive market expansion. Focus on value-added products and premiumization strategies will strengthen market positioning and command higher profit margins.
Key Players Shaping the Crab Market Market
- Bumble Bee Foods LLC
- JM Clayton Seafood Company
- Handy Seafoo
- Maine Lobster Now
- Phil-Union Frozen Foods Inc
- Siam Canadian Group Limited
- RGE Agridev Corporation
- Millennium Ocean Star Corporation
- Supreme Crab & Seafood Inc
Notable Milestones in Crab Market Sector
- 2021: Introduction of a new sustainable fishing initiative by a major crab producer.
- 2022 Q3: Successful launch of a ready-to-eat crab product line by a leading food company.
- 2023 Q1: Merger between two key players resulting in significant market share consolidation.
In-Depth Crab Market Market Outlook
The global crab market is poised for robust growth throughout the forecast period (2025-2033), driven by continuous innovation, increasing consumer demand, and strategic market expansion. Opportunities abound in developing innovative products, targeting untapped markets, and strengthening sustainability initiatives. Companies investing in sustainable practices and adopting technological advancements will be well-positioned to capture significant market share and drive long-term growth in this dynamic sector.
Crab Market Segmentation
- 1. Production Analysis
- 2. Consumption Analysis
- 3. Import Market Analysis (Value & Volume)
- 4. Export Market Analysis (Value & Volume)
- 5. Price Trend Analysis
Crab Market Segmentation By Geography
-
1. North America
- 1.1. United States
- 1.2. Canada
- 1.3. Mexico
-
2. South America
- 2.1. Brazil
- 2.2. Argentina
- 2.3. Rest of South America
-
3. Europe
- 3.1. United Kingdom
- 3.2. Germany
- 3.3. France
- 3.4. Italy
- 3.5. Spain
- 3.6. Russia
- 3.7. Benelux
- 3.8. Nordics
- 3.9. Rest of Europe
-
4. Middle East & Africa
- 4.1. Turkey
- 4.2. Israel
- 4.3. GCC
- 4.4. North Africa
- 4.5. South Africa
- 4.6. Rest of Middle East & Africa
-
5. Asia Pacific
- 5.1. China
- 5.2. India
- 5.3. Japan
- 5.4. South Korea
- 5.5. ASEAN
- 5.6. Oceania
- 5.7. Rest of Asia Pacific
Crab Market Regional Market Share
Geographic Coverage of Crab Market
Crab Market REPORT HIGHLIGHTS
| Aspects | Details |
|---|---|
| Study Period | 2020-2034 |
| Base Year | 2025 |
| Estimated Year | 2026 |
| Forecast Period | 2026-2034 |
| Historical Period | 2020-2025 |
| Growth Rate | CAGR of 5.72% from 2020-2034 |
| Segmentation |
|
Table of Contents
- 1. Introduction
- 1.1. Research Scope
- 1.2. Market Segmentation
- 1.3. Research Objective
- 1.4. Definitions and Assumptions
- 2. Executive Summary
- 2.1. Market Snapshot
- 3. Market Dynamics
- 3.1. Market Drivers
- 3.2. Market Restrains
- 3.3. Market Trends
- 3.4. Market Opportunities
- 4. Market Factor Analysis
- 4.1. Porters Five Forces
- 4.1.1. Bargaining Power of Suppliers
- 4.1.2. Bargaining Power of Buyers
- 4.1.3. Threat of New Entrants
- 4.1.4. Threat of Substitutes
- 4.1.5. Competitive Rivalry
- 4.2. PESTEL analysis
- 4.3. BCG Analysis
- 4.3.1. Stars (High Growth, High Market Share)
- 4.3.2. Cash Cows (Low Growth, High Market Share)
- 4.3.3. Question Mark (High Growth, Low Market Share)
- 4.3.4. Dogs (Low Growth, Low Market Share)
- 4.4. Ansoff Matrix Analysis
- 4.5. Supply Chain Analysis
- 4.6. Regulatory Landscape
- 4.7. Current Market Potential and Opportunity Assessment (TAM–SAM–SOM Framework)
- 4.8. IMR Analyst Note
- 4.1. Porters Five Forces
- 5. Market Analysis, Insights and Forecast 2021-2033
- 5.1. Market Analysis, Insights and Forecast - by Production Analysis
- 5.2. Market Analysis, Insights and Forecast - by Consumption Analysis
- 5.3. Market Analysis, Insights and Forecast - by Import Market Analysis (Value & Volume)
- 5.4. Market Analysis, Insights and Forecast - by Export Market Analysis (Value & Volume)
- 5.5. Market Analysis, Insights and Forecast - by Price Trend Analysis
- 5.6. Market Analysis, Insights and Forecast - by Region
- 5.6.1. North America
- 5.6.2. South America
- 5.6.3. Europe
- 5.6.4. Middle East & Africa
- 5.6.5. Asia Pacific
- 6. Global Crab Market Analysis, Insights and Forecast, 2021-2033
- 6.1. Market Analysis, Insights and Forecast - by Production Analysis
- 6.2. Market Analysis, Insights and Forecast - by Consumption Analysis
- 6.3. Market Analysis, Insights and Forecast - by Import Market Analysis (Value & Volume)
- 6.4. Market Analysis, Insights and Forecast - by Export Market Analysis (Value & Volume)
- 6.5. Market Analysis, Insights and Forecast - by Price Trend Analysis
- 7. North America Crab Market Analysis, Insights and Forecast, 2020-2032
- 7.1. Market Analysis, Insights and Forecast - by Production Analysis
- 7.2. Market Analysis, Insights and Forecast - by Consumption Analysis
- 7.3. Market Analysis, Insights and Forecast - by Import Market Analysis (Value & Volume)
- 7.4. Market Analysis, Insights and Forecast - by Export Market Analysis (Value & Volume)
- 7.5. Market Analysis, Insights and Forecast - by Price Trend Analysis
- 8. South America Crab Market Analysis, Insights and Forecast, 2020-2032
- 8.1. Market Analysis, Insights and Forecast - by Production Analysis
- 8.2. Market Analysis, Insights and Forecast - by Consumption Analysis
- 8.3. Market Analysis, Insights and Forecast - by Import Market Analysis (Value & Volume)
- 8.4. Market Analysis, Insights and Forecast - by Export Market Analysis (Value & Volume)
- 8.5. Market Analysis, Insights and Forecast - by Price Trend Analysis
- 9. Europe Crab Market Analysis, Insights and Forecast, 2020-2032
- 9.1. Market Analysis, Insights and Forecast - by Production Analysis
- 9.2. Market Analysis, Insights and Forecast - by Consumption Analysis
- 9.3. Market Analysis, Insights and Forecast - by Import Market Analysis (Value & Volume)
- 9.4. Market Analysis, Insights and Forecast - by Export Market Analysis (Value & Volume)
- 9.5. Market Analysis, Insights and Forecast - by Price Trend Analysis
- 10. Middle East & Africa Crab Market Analysis, Insights and Forecast, 2020-2032
- 10.1. Market Analysis, Insights and Forecast - by Production Analysis
- 10.2. Market Analysis, Insights and Forecast - by Consumption Analysis
- 10.3. Market Analysis, Insights and Forecast - by Import Market Analysis (Value & Volume)
- 10.4. Market Analysis, Insights and Forecast - by Export Market Analysis (Value & Volume)
- 10.5. Market Analysis, Insights and Forecast - by Price Trend Analysis
- 11. Asia Pacific Crab Market Analysis, Insights and Forecast, 2020-2032
- 11.1. Market Analysis, Insights and Forecast - by Production Analysis
- 11.2. Market Analysis, Insights and Forecast - by Consumption Analysis
- 11.3. Market Analysis, Insights and Forecast - by Import Market Analysis (Value & Volume)
- 11.4. Market Analysis, Insights and Forecast - by Export Market Analysis (Value & Volume)
- 11.5. Market Analysis, Insights and Forecast - by Price Trend Analysis
- 12. Competitive Analysis
- 12.1. Company Profiles
- 12.1.1 Bumble Bee Foods LLC
- 12.1.1.1. Company Overview
- 12.1.1.2. Products
- 12.1.1.3. Company Financials
- 12.1.1.4. SWOT Analysis
- 12.1.2 JM Clayton Seafood Company
- 12.1.2.1. Company Overview
- 12.1.2.2. Products
- 12.1.2.3. Company Financials
- 12.1.2.4. SWOT Analysis
- 12.1.3 Handy Seafoo
- 12.1.3.1. Company Overview
- 12.1.3.2. Products
- 12.1.3.3. Company Financials
- 12.1.3.4. SWOT Analysis
- 12.1.4 Maine Lobster Now
- 12.1.4.1. Company Overview
- 12.1.4.2. Products
- 12.1.4.3. Company Financials
- 12.1.4.4. SWOT Analysis
- 12.1.5 Phil-Union Frozen Foods Inc
- 12.1.5.1. Company Overview
- 12.1.5.2. Products
- 12.1.5.3. Company Financials
- 12.1.5.4. SWOT Analysis
- 12.1.6 Siam Canadian Group Limited
- 12.1.6.1. Company Overview
- 12.1.6.2. Products
- 12.1.6.3. Company Financials
- 12.1.6.4. SWOT Analysis
- 12.1.7 RGE Agridev Corporation
- 12.1.7.1. Company Overview
- 12.1.7.2. Products
- 12.1.7.3. Company Financials
- 12.1.7.4. SWOT Analysis
- 12.1.8 Millennium Ocean Star Corporation
- 12.1.8.1. Company Overview
- 12.1.8.2. Products
- 12.1.8.3. Company Financials
- 12.1.8.4. SWOT Analysis
- 12.1.9 Supreme Crab & Seafood Inc
- 12.1.9.1. Company Overview
- 12.1.9.2. Products
- 12.1.9.3. Company Financials
- 12.1.9.4. SWOT Analysis
- 12.1.1 Bumble Bee Foods LLC
- 12.2. Market Entropy
- 12.2.1 Company's Key Areas Served
- 12.2.2 Recent Developments
- 12.3. Company Market Share Analysis 2025
- 12.3.1 Top 5 Companies Market Share Analysis
- 12.3.2 Top 3 Companies Market Share Analysis
- 12.4. List of Potential Customers
- 13. Research Methodology
List of Figures
- Figure 1: Global Crab Market Revenue Breakdown (Million, %) by Region 2025 & 2033
- Figure 2: North America Crab Market Revenue (Million), by Production Analysis 2025 & 2033
- Figure 3: North America Crab Market Revenue Share (%), by Production Analysis 2025 & 2033
- Figure 4: North America Crab Market Revenue (Million), by Consumption Analysis 2025 & 2033
- Figure 5: North America Crab Market Revenue Share (%), by Consumption Analysis 2025 & 2033
- Figure 6: North America Crab Market Revenue (Million), by Import Market Analysis (Value & Volume) 2025 & 2033
- Figure 7: North America Crab Market Revenue Share (%), by Import Market Analysis (Value & Volume) 2025 & 2033
- Figure 8: North America Crab Market Revenue (Million), by Export Market Analysis (Value & Volume) 2025 & 2033
- Figure 9: North America Crab Market Revenue Share (%), by Export Market Analysis (Value & Volume) 2025 & 2033
- Figure 10: North America Crab Market Revenue (Million), by Price Trend Analysis 2025 & 2033
- Figure 11: North America Crab Market Revenue Share (%), by Price Trend Analysis 2025 & 2033
- Figure 12: North America Crab Market Revenue (Million), by Country 2025 & 2033
- Figure 13: North America Crab Market Revenue Share (%), by Country 2025 & 2033
- Figure 14: South America Crab Market Revenue (Million), by Production Analysis 2025 & 2033
- Figure 15: South America Crab Market Revenue Share (%), by Production Analysis 2025 & 2033
- Figure 16: South America Crab Market Revenue (Million), by Consumption Analysis 2025 & 2033
- Figure 17: South America Crab Market Revenue Share (%), by Consumption Analysis 2025 & 2033
- Figure 18: South America Crab Market Revenue (Million), by Import Market Analysis (Value & Volume) 2025 & 2033
- Figure 19: South America Crab Market Revenue Share (%), by Import Market Analysis (Value & Volume) 2025 & 2033
- Figure 20: South America Crab Market Revenue (Million), by Export Market Analysis (Value & Volume) 2025 & 2033
- Figure 21: South America Crab Market Revenue Share (%), by Export Market Analysis (Value & Volume) 2025 & 2033
- Figure 22: South America Crab Market Revenue (Million), by Price Trend Analysis 2025 & 2033
- Figure 23: South America Crab Market Revenue Share (%), by Price Trend Analysis 2025 & 2033
- Figure 24: South America Crab Market Revenue (Million), by Country 2025 & 2033
- Figure 25: South America Crab Market Revenue Share (%), by Country 2025 & 2033
- Figure 26: Europe Crab Market Revenue (Million), by Production Analysis 2025 & 2033
- Figure 27: Europe Crab Market Revenue Share (%), by Production Analysis 2025 & 2033
- Figure 28: Europe Crab Market Revenue (Million), by Consumption Analysis 2025 & 2033
- Figure 29: Europe Crab Market Revenue Share (%), by Consumption Analysis 2025 & 2033
- Figure 30: Europe Crab Market Revenue (Million), by Import Market Analysis (Value & Volume) 2025 & 2033
- Figure 31: Europe Crab Market Revenue Share (%), by Import Market Analysis (Value & Volume) 2025 & 2033
- Figure 32: Europe Crab Market Revenue (Million), by Export Market Analysis (Value & Volume) 2025 & 2033
- Figure 33: Europe Crab Market Revenue Share (%), by Export Market Analysis (Value & Volume) 2025 & 2033
- Figure 34: Europe Crab Market Revenue (Million), by Price Trend Analysis 2025 & 2033
- Figure 35: Europe Crab Market Revenue Share (%), by Price Trend Analysis 2025 & 2033
- Figure 36: Europe Crab Market Revenue (Million), by Country 2025 & 2033
- Figure 37: Europe Crab Market Revenue Share (%), by Country 2025 & 2033
- Figure 38: Middle East & Africa Crab Market Revenue (Million), by Production Analysis 2025 & 2033
- Figure 39: Middle East & Africa Crab Market Revenue Share (%), by Production Analysis 2025 & 2033
- Figure 40: Middle East & Africa Crab Market Revenue (Million), by Consumption Analysis 2025 & 2033
- Figure 41: Middle East & Africa Crab Market Revenue Share (%), by Consumption Analysis 2025 & 2033
- Figure 42: Middle East & Africa Crab Market Revenue (Million), by Import Market Analysis (Value & Volume) 2025 & 2033
- Figure 43: Middle East & Africa Crab Market Revenue Share (%), by Import Market Analysis (Value & Volume) 2025 & 2033
- Figure 44: Middle East & Africa Crab Market Revenue (Million), by Export Market Analysis (Value & Volume) 2025 & 2033
- Figure 45: Middle East & Africa Crab Market Revenue Share (%), by Export Market Analysis (Value & Volume) 2025 & 2033
- Figure 46: Middle East & Africa Crab Market Revenue (Million), by Price Trend Analysis 2025 & 2033
- Figure 47: Middle East & Africa Crab Market Revenue Share (%), by Price Trend Analysis 2025 & 2033
- Figure 48: Middle East & Africa Crab Market Revenue (Million), by Country 2025 & 2033
- Figure 49: Middle East & Africa Crab Market Revenue Share (%), by Country 2025 & 2033
- Figure 50: Asia Pacific Crab Market Revenue (Million), by Production Analysis 2025 & 2033
- Figure 51: Asia Pacific Crab Market Revenue Share (%), by Production Analysis 2025 & 2033
- Figure 52: Asia Pacific Crab Market Revenue (Million), by Consumption Analysis 2025 & 2033
- Figure 53: Asia Pacific Crab Market Revenue Share (%), by Consumption Analysis 2025 & 2033
- Figure 54: Asia Pacific Crab Market Revenue (Million), by Import Market Analysis (Value & Volume) 2025 & 2033
- Figure 55: Asia Pacific Crab Market Revenue Share (%), by Import Market Analysis (Value & Volume) 2025 & 2033
- Figure 56: Asia Pacific Crab Market Revenue (Million), by Export Market Analysis (Value & Volume) 2025 & 2033
- Figure 57: Asia Pacific Crab Market Revenue Share (%), by Export Market Analysis (Value & Volume) 2025 & 2033
- Figure 58: Asia Pacific Crab Market Revenue (Million), by Price Trend Analysis 2025 & 2033
- Figure 59: Asia Pacific Crab Market Revenue Share (%), by Price Trend Analysis 2025 & 2033
- Figure 60: Asia Pacific Crab Market Revenue (Million), by Country 2025 & 2033
- Figure 61: Asia Pacific Crab Market Revenue Share (%), by Country 2025 & 2033
List of Tables
- Table 1: Global Crab Market Revenue Million Forecast, by Production Analysis 2020 & 2033
- Table 2: Global Crab Market Revenue Million Forecast, by Consumption Analysis 2020 & 2033
- Table 3: Global Crab Market Revenue Million Forecast, by Import Market Analysis (Value & Volume) 2020 & 2033
- Table 4: Global Crab Market Revenue Million Forecast, by Export Market Analysis (Value & Volume) 2020 & 2033
- Table 5: Global Crab Market Revenue Million Forecast, by Price Trend Analysis 2020 & 2033
- Table 6: Global Crab Market Revenue Million Forecast, by Region 2020 & 2033
- Table 7: Global Crab Market Revenue Million Forecast, by Production Analysis 2020 & 2033
- Table 8: Global Crab Market Revenue Million Forecast, by Consumption Analysis 2020 & 2033
- Table 9: Global Crab Market Revenue Million Forecast, by Import Market Analysis (Value & Volume) 2020 & 2033
- Table 10: Global Crab Market Revenue Million Forecast, by Export Market Analysis (Value & Volume) 2020 & 2033
- Table 11: Global Crab Market Revenue Million Forecast, by Price Trend Analysis 2020 & 2033
- Table 12: Global Crab Market Revenue Million Forecast, by Country 2020 & 2033
- Table 13: United States Crab Market Revenue (Million) Forecast, by Application 2020 & 2033
- Table 14: Canada Crab Market Revenue (Million) Forecast, by Application 2020 & 2033
- Table 15: Mexico Crab Market Revenue (Million) Forecast, by Application 2020 & 2033
- Table 16: Global Crab Market Revenue Million Forecast, by Production Analysis 2020 & 2033
- Table 17: Global Crab Market Revenue Million Forecast, by Consumption Analysis 2020 & 2033
- Table 18: Global Crab Market Revenue Million Forecast, by Import Market Analysis (Value & Volume) 2020 & 2033
- Table 19: Global Crab Market Revenue Million Forecast, by Export Market Analysis (Value & Volume) 2020 & 2033
- Table 20: Global Crab Market Revenue Million Forecast, by Price Trend Analysis 2020 & 2033
- Table 21: Global Crab Market Revenue Million Forecast, by Country 2020 & 2033
- Table 22: Brazil Crab Market Revenue (Million) Forecast, by Application 2020 & 2033
- Table 23: Argentina Crab Market Revenue (Million) Forecast, by Application 2020 & 2033
- Table 24: Rest of South America Crab Market Revenue (Million) Forecast, by Application 2020 & 2033
- Table 25: Global Crab Market Revenue Million Forecast, by Production Analysis 2020 & 2033
- Table 26: Global Crab Market Revenue Million Forecast, by Consumption Analysis 2020 & 2033
- Table 27: Global Crab Market Revenue Million Forecast, by Import Market Analysis (Value & Volume) 2020 & 2033
- Table 28: Global Crab Market Revenue Million Forecast, by Export Market Analysis (Value & Volume) 2020 & 2033
- Table 29: Global Crab Market Revenue Million Forecast, by Price Trend Analysis 2020 & 2033
- Table 30: Global Crab Market Revenue Million Forecast, by Country 2020 & 2033
- Table 31: United Kingdom Crab Market Revenue (Million) Forecast, by Application 2020 & 2033
- Table 32: Germany Crab Market Revenue (Million) Forecast, by Application 2020 & 2033
- Table 33: France Crab Market Revenue (Million) Forecast, by Application 2020 & 2033
- Table 34: Italy Crab Market Revenue (Million) Forecast, by Application 2020 & 2033
- Table 35: Spain Crab Market Revenue (Million) Forecast, by Application 2020 & 2033
- Table 36: Russia Crab Market Revenue (Million) Forecast, by Application 2020 & 2033
- Table 37: Benelux Crab Market Revenue (Million) Forecast, by Application 2020 & 2033
- Table 38: Nordics Crab Market Revenue (Million) Forecast, by Application 2020 & 2033
- Table 39: Rest of Europe Crab Market Revenue (Million) Forecast, by Application 2020 & 2033
- Table 40: Global Crab Market Revenue Million Forecast, by Production Analysis 2020 & 2033
- Table 41: Global Crab Market Revenue Million Forecast, by Consumption Analysis 2020 & 2033
- Table 42: Global Crab Market Revenue Million Forecast, by Import Market Analysis (Value & Volume) 2020 & 2033
- Table 43: Global Crab Market Revenue Million Forecast, by Export Market Analysis (Value & Volume) 2020 & 2033
- Table 44: Global Crab Market Revenue Million Forecast, by Price Trend Analysis 2020 & 2033
- Table 45: Global Crab Market Revenue Million Forecast, by Country 2020 & 2033
- Table 46: Turkey Crab Market Revenue (Million) Forecast, by Application 2020 & 2033
- Table 47: Israel Crab Market Revenue (Million) Forecast, by Application 2020 & 2033
- Table 48: GCC Crab Market Revenue (Million) Forecast, by Application 2020 & 2033
- Table 49: North Africa Crab Market Revenue (Million) Forecast, by Application 2020 & 2033
- Table 50: South Africa Crab Market Revenue (Million) Forecast, by Application 2020 & 2033
- Table 51: Rest of Middle East & Africa Crab Market Revenue (Million) Forecast, by Application 2020 & 2033
- Table 52: Global Crab Market Revenue Million Forecast, by Production Analysis 2020 & 2033
- Table 53: Global Crab Market Revenue Million Forecast, by Consumption Analysis 2020 & 2033
- Table 54: Global Crab Market Revenue Million Forecast, by Import Market Analysis (Value & Volume) 2020 & 2033
- Table 55: Global Crab Market Revenue Million Forecast, by Export Market Analysis (Value & Volume) 2020 & 2033
- Table 56: Global Crab Market Revenue Million Forecast, by Price Trend Analysis 2020 & 2033
- Table 57: Global Crab Market Revenue Million Forecast, by Country 2020 & 2033
- Table 58: China Crab Market Revenue (Million) Forecast, by Application 2020 & 2033
- Table 59: India Crab Market Revenue (Million) Forecast, by Application 2020 & 2033
- Table 60: Japan Crab Market Revenue (Million) Forecast, by Application 2020 & 2033
- Table 61: South Korea Crab Market Revenue (Million) Forecast, by Application 2020 & 2033
- Table 62: ASEAN Crab Market Revenue (Million) Forecast, by Application 2020 & 2033
- Table 63: Oceania Crab Market Revenue (Million) Forecast, by Application 2020 & 2033
- Table 64: Rest of Asia Pacific Crab Market Revenue (Million) Forecast, by Application 2020 & 2033
Frequently Asked Questions
1. What is the projected Compound Annual Growth Rate (CAGR) of the Crab Market?
The projected CAGR is approximately 5.72%.
2. Which companies are prominent players in the Crab Market?
Key companies in the market include Bumble Bee Foods LLC, JM Clayton Seafood Company, Handy Seafoo, Maine Lobster Now, Phil-Union Frozen Foods Inc, Siam Canadian Group Limited, RGE Agridev Corporation, Millennium Ocean Star Corporation, Supreme Crab & Seafood Inc.
3. What are the main segments of the Crab Market?
The market segments include Production Analysis, Consumption Analysis, Import Market Analysis (Value & Volume), Export Market Analysis (Value & Volume), Price Trend Analysis.
4. Can you provide details about the market size?
The market size is estimated to be USD 11.85 Million as of 2022.
5. What are some drivers contributing to market growth?
Awareness of Landscaping Maintenance; Technological Advancements.
6. What are the notable trends driving market growth?
Increasing Awareness About the Health Benefits of Crabs.
7. Are there any restraints impacting market growth?
Shortage of Skilled Labor; Wastage of High Amount of Water For Irrigating Lawns.
8. Can you provide examples of recent developments in the market?
N/A
9. What pricing options are available for accessing the report?
Pricing options include single-user, multi-user, and enterprise licenses priced at USD 4750, USD 5250, and USD 8750 respectively.
10. Is the market size provided in terms of value or volume?
The market size is provided in terms of value, measured in Million.
11. Are there any specific market keywords associated with the report?
Yes, the market keyword associated with the report is "Crab Market," which aids in identifying and referencing the specific market segment covered.
12. How do I determine which pricing option suits my needs best?
The pricing options vary based on user requirements and access needs. Individual users may opt for single-user licenses, while businesses requiring broader access may choose multi-user or enterprise licenses for cost-effective access to the report.
13. Are there any additional resources or data provided in the Crab Market report?
While the report offers comprehensive insights, it's advisable to review the specific contents or supplementary materials provided to ascertain if additional resources or data are available.
14. How can I stay updated on further developments or reports in the Crab Market?
To stay informed about further developments, trends, and reports in the Crab Market, consider subscribing to industry newsletters, following relevant companies and organizations, or regularly checking reputable industry news sources and publications.
Methodology
Step 1 - Identification of Relevant Samples Size from Population Database


Step 2 - Approaches for Defining Global Market Size (Value, Volume* & Price*)

Note*: In applicable scenarios
Step 3 - Data Sources
Primary Research
- Web Analytics
- Survey Reports
- Research Institute
- Latest Research Reports
- Opinion Leaders
Secondary Research
- Annual Reports
- White Paper
- Latest Press Release
- Industry Association
- Paid Database
- Investor Presentations

Step 4 - Data Triangulation
Involves using different sources of information in order to increase the validity of a study
These sources are likely to be stakeholders in a program - participants, other researchers, program staff, other community members, and so on.
Then we put all data in single framework & apply various statistical tools to find out the dynamic on the market.
During the analysis stage, feedback from the stakeholder groups would be compared to determine areas of agreement as well as areas of divergence