

Key Insights
The global cranberry market, valued at approximately $2.9 billion in 2025, is projected for robust expansion with a compound annual growth rate (CAGR) of 4.2% from 2025 to 2033. This growth trajectory is propelled by heightened consumer awareness of cranberries' health benefits, particularly their high antioxidant levels and well-documented support for urinary tract health. The increasing demand for functional foods and beverages, alongside their integration into dietary supplements and pharmaceuticals, is a key market driver. Processed and value-added cranberry products, including juices, sauces, and dried varieties, demonstrate accelerated growth over fresh cranberries, driven by convenience and extended shelf life. North America, led by the United States and Canada, maintains market dominance due to established cultivation and strong domestic consumption. However, emerging demand from Asia-Pacific and Europe, fueled by rising health consciousness and innovative product introductions, offers significant expansion opportunities. Despite challenges such as volatile raw material prices and seasonal production limitations, the industry's outlook is positive, supported by continuous product innovation and expanding global appeal.
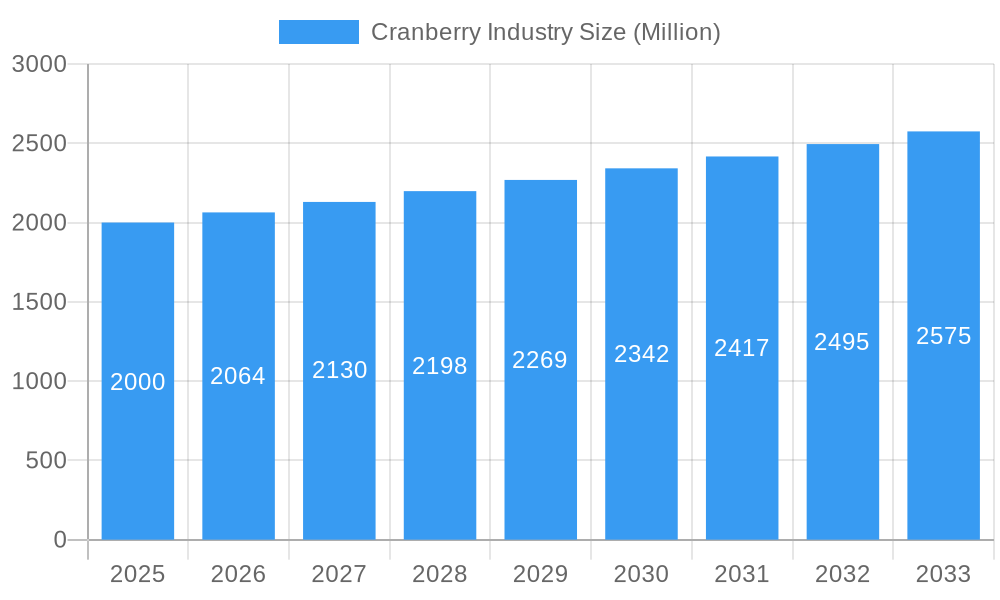
Cranberry Industry Market Size (In Billion)
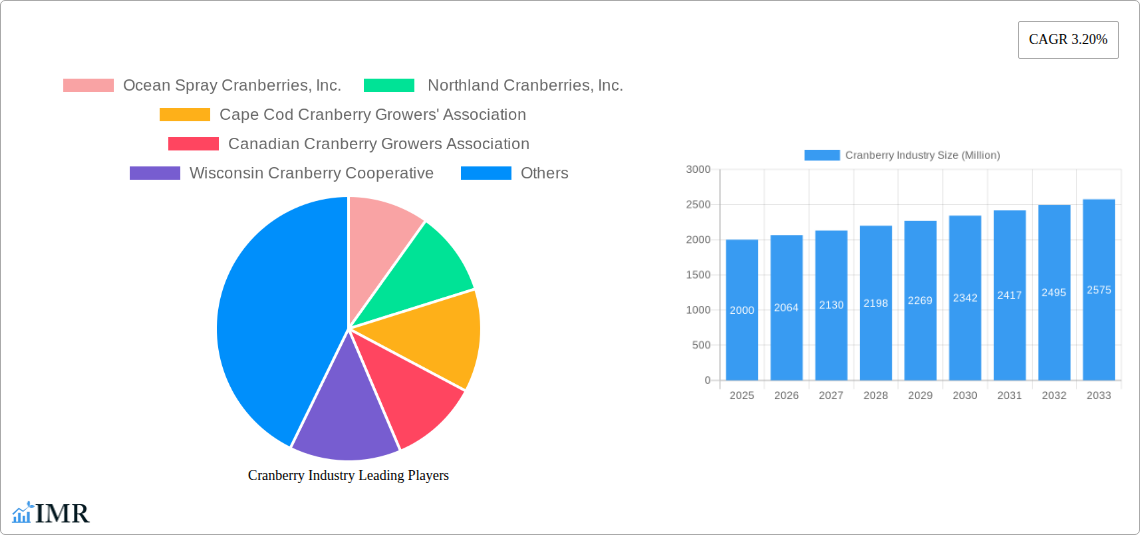
The competitive environment features established large-scale producers, including Ocean Spray Cranberries, Inc., and regional cooperatives like the Wisconsin Cranberry Cooperative. Key strategies involve product portfolio diversification, new market exploration, and technological adoption for optimized cultivation and processing. Strategic alliances and collaborations are further enhancing market access and distribution networks. Future growth will be significantly shaped by ongoing research into cranberry health benefits and effective marketing campaigns targeting health-conscious consumers worldwide, emphasizing cranberry versatility, sustainable sourcing, and supply chain resilience.
Cranberry Industry Company Market Share
Cranberry Industry Market Report: 2019-2033
This comprehensive report provides a detailed analysis of the global cranberry industry, encompassing market dynamics, growth trends, regional performance, product landscape, key players, and future outlook. The study period covers 2019-2033, with a base year of 2025 and a forecast period of 2025-2033. This report is essential for industry professionals, investors, and stakeholders seeking to understand and capitalize on opportunities within this dynamic market. Parent markets include the broader fruit and beverage industries, while child markets include dietary supplements and pharmaceutical applications. The report's value is estimated at XX Million.
Cranberry Industry Market Dynamics & Structure
This section analyzes the competitive landscape, technological advancements, regulatory environment, and market forces influencing the cranberry industry. The global cranberry market is moderately concentrated, with key players like Ocean Spray Cranberries, Inc. holding significant market share. However, the presence of numerous smaller producers, particularly regional cooperatives like the Cape Cod Cranberry Growers' Association and the Wisconsin Cranberry Cooperative, contributes to a diverse market structure.
- Market Concentration: Ocean Spray holds an estimated xx% market share, while other major players individually hold less than xx%. Regional cooperatives collectively account for approximately xx% of the market.
- Technological Innovation: Automation in harvesting and processing is driving efficiency gains, while AI-driven research is unlocking new health benefits and applications. However, high initial investment costs and the need for skilled labor represent barriers to wider adoption.
- Regulatory Frameworks: Food safety regulations and labeling requirements vary across regions, impacting production and distribution costs. Furthermore, evolving consumer demand for sustainably produced cranberries influences farming practices and necessitates compliance with environmental regulations.
- Competitive Product Substitutes: Other berries and fruit juices compete with cranberries in the food and beverage sector. However, the unique health benefits of cranberries provide a degree of differentiation.
- End-User Demographics: Health-conscious consumers, particularly in developed nations, are driving demand for cranberry-based products due to their antioxidant and urinary tract health properties.
- M&A Trends: The industry has witnessed a moderate level of M&A activity in recent years, primarily focused on consolidating production and enhancing distribution networks. The estimated number of M&A deals between 2019-2024 was xx.
Cranberry Industry Growth Trends & Insights
The global cranberry market experienced significant growth between 2019 and 2024, driven by increasing consumer awareness of cranberry's health benefits and its versatility across various food and beverage applications. The market is projected to maintain a steady growth trajectory throughout the forecast period (2025-2033), propelled by factors such as rising disposable incomes in emerging economies, expanding health and wellness sector, and ongoing product innovation. The CAGR during the forecast period is projected to be xx%. Market penetration is currently estimated at xx% in major markets and is projected to increase to xx% by 2033. Technological disruptions, such as AI-driven research into cranberry compounds, are further accelerating market expansion by unlocking novel applications and expanding the market size of value-added products. Consumer behavior shifts towards healthier and functional foods are also playing a crucial role.
Dominant Regions, Countries, or Segments in Cranberry Industry
North America, particularly the United States and Canada, historically dominates the cranberry market, due to established production capabilities and high consumption rates. However, growing demand from Asia and Europe is fostering market expansion in these regions.
By Product Type:
- Processed Cranberries: This segment holds the largest market share, driven by the versatile nature of processed cranberries in various food and beverage applications, including sauces, juices, and dried cranberries.
- Fresh Cranberries: This segment exhibits steady growth, but faces seasonal limitations and higher perishability compared to processed cranberries.
- Value-Added Products: This rapidly growing segment includes dietary supplements, functional foods, and specialized extracts, reflecting the increasing interest in cranberry's health benefits.
By Application:
- Food and Beverage: This remains the dominant application segment, with a vast array of products incorporating cranberries.
- Dietary Supplements: Growth in this segment is spurred by increasing consumer demand for natural health solutions.
- Pharmaceuticals: Cranberry extracts are finding increasing use in pharmaceutical applications, particularly for urinary tract health products. This niche segment exhibits strong growth potential.
Key Drivers:
- Strong consumer preference for healthy and functional foods.
- Increased awareness of cranberry's health benefits.
- Growing demand from the food and beverage sector and dietary supplement markets.
- Technological advancements that improve processing efficiencies and unlock new applications.
Cranberry Industry Product Landscape
The cranberry industry offers a diverse product range, including fresh cranberries, various processed forms (juice, sauce, dried cranberries), and a growing number of value-added products such as dietary supplements and functional food ingredients. Technological advancements, such as improved extraction techniques and innovative preservation methods, are creating new product variations and enhancing shelf life. Unique selling propositions include the natural antioxidants, unique flavor profile, and health-promoting properties.
Key Drivers, Barriers & Challenges in Cranberry Industry
Key Drivers:
- Growing demand for functional foods and dietary supplements.
- Rising consumer awareness of cranberry's health benefits.
- Technological innovations in processing and product development.
- Strategic partnerships fostering research and development.
Key Challenges & Restraints:
- Seasonal nature of cranberry production and associated supply chain vulnerabilities.
- Fluctuations in cranberry prices due to weather conditions and global market dynamics.
- Intense competition from other berries and fruit juices.
- Regulatory hurdles and compliance costs for food safety and labeling requirements.
- High initial investment costs associated with advanced processing technologies.
Emerging Opportunities in Cranberry Industry
- Expansion into untapped markets in Asia and Latin America.
- Development of novel cranberry-based products targeting specific health conditions.
- Growing demand for organic and sustainably produced cranberries.
- Increased incorporation of cranberries into functional foods and beverages.
Growth Accelerators in the Cranberry Industry Industry
Long-term growth in the cranberry industry will be fueled by ongoing research into its health benefits, strategic collaborations among industry players, expansion into new geographical markets, and innovations in product development and processing technologies. The development of new value-added products, especially in niche segments, holds immense potential for future growth.
Key Players Shaping the Cranberry Industry Market
- Ocean Spray Cranberries, Inc.
- Northland Cranberries, Inc.
- Cape Cod Cranberry Growers' Association
- Canadian Cranberry Growers Association
- Wisconsin Cranberry Cooperative
Notable Milestones in Cranberry Industry Sector
- November 2021: Ocean Spray partners with Brightseed to leverage AI in researching cranberry compounds and health benefits.
- March 2022: Ocean Spray collaborates with Canomiks to utilize AI for testing and certifying the biological efficacy of cranberries.
In-Depth Cranberry Industry Market Outlook
The future of the cranberry industry appears promising, driven by the increasing consumer preference for natural, healthy food options and the ongoing scientific validation of cranberries' health-promoting properties. Strategic investments in research and development, coupled with strategic partnerships and market expansion initiatives, will be pivotal in unlocking the industry's full growth potential. The market is poised for continued expansion in the coming years, with significant growth opportunities in emerging markets and through the development of innovative products and applications.
Cranberry Industry Segmentation
- 1. Production Analysis
- 2. Consumption Analysis
- 3. Import Market Analysis (Value & Volume)
- 4. Export Market Analysis (Value & Volume)
- 5. Price Trend Analysis
Cranberry Industry Segmentation By Geography
-
1. North America
- 1.1. United States
-
2. Europe
- 2.1. Germany
-
3. Asia Pacific
- 3.1. China
-
4. South America
- 4.1. Chile
-
5. Africa
- 5.1. South Africa
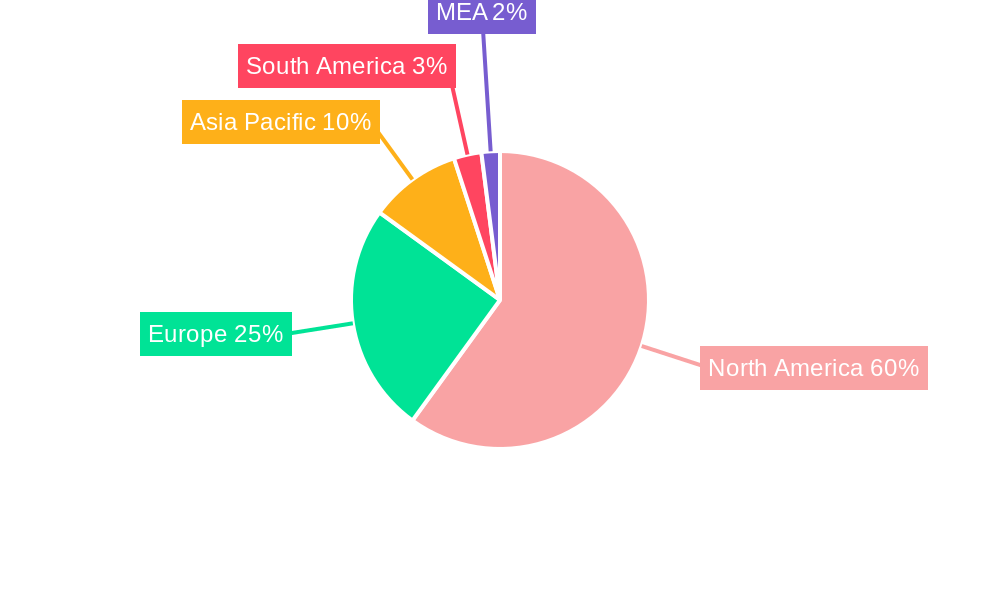
Cranberry Industry Regional Market Share
Geographic Coverage of Cranberry Industry
Cranberry Industry REPORT HIGHLIGHTS
| Aspects | Details |
|---|---|
| Study Period | 2020-2034 |
| Base Year | 2025 |
| Estimated Year | 2026 |
| Forecast Period | 2026-2034 |
| Historical Period | 2020-2025 |
| Growth Rate | CAGR of 4.2% from 2020-2034 |
| Segmentation |
|
Table of Contents
- 1. Introduction
- 1.1. Research Scope
- 1.2. Market Segmentation
- 1.3. Research Objective
- 1.4. Definitions and Assumptions
- 2. Executive Summary
- 2.1. Market Snapshot
- 3. Market Dynamics
- 3.1. Market Drivers
- 3.2. Market Restrains
- 3.3. Market Trends
- 3.4. Market Opportunities
- 4. Market Factor Analysis
- 4.1. Porters Five Forces
- 4.1.1. Bargaining Power of Suppliers
- 4.1.2. Bargaining Power of Buyers
- 4.1.3. Threat of New Entrants
- 4.1.4. Threat of Substitutes
- 4.1.5. Competitive Rivalry
- 4.2. PESTEL analysis
- 4.3. BCG Analysis
- 4.3.1. Stars (High Growth, High Market Share)
- 4.3.2. Cash Cows (Low Growth, High Market Share)
- 4.3.3. Question Mark (High Growth, Low Market Share)
- 4.3.4. Dogs (Low Growth, Low Market Share)
- 4.4. Ansoff Matrix Analysis
- 4.5. Supply Chain Analysis
- 4.6. Regulatory Landscape
- 4.7. Current Market Potential and Opportunity Assessment (TAM–SAM–SOM Framework)
- 4.8. IMR Analyst Note
- 4.1. Porters Five Forces
- 5. Market Analysis, Insights and Forecast 2021-2033
- 5.1. Market Analysis, Insights and Forecast - by Production Analysis
- 5.2. Market Analysis, Insights and Forecast - by Consumption Analysis
- 5.3. Market Analysis, Insights and Forecast - by Import Market Analysis (Value & Volume)
- 5.4. Market Analysis, Insights and Forecast - by Export Market Analysis (Value & Volume)
- 5.5. Market Analysis, Insights and Forecast - by Price Trend Analysis
- 5.6. Market Analysis, Insights and Forecast - by Region
- 5.6.1. North America
- 5.6.2. Europe
- 5.6.3. Asia Pacific
- 5.6.4. South America
- 5.6.5. Africa
- 6. Global Cranberry Industry Analysis, Insights and Forecast, 2021-2033
- 6.1. Market Analysis, Insights and Forecast - by Production Analysis
- 6.2. Market Analysis, Insights and Forecast - by Consumption Analysis
- 6.3. Market Analysis, Insights and Forecast - by Import Market Analysis (Value & Volume)
- 6.4. Market Analysis, Insights and Forecast - by Export Market Analysis (Value & Volume)
- 6.5. Market Analysis, Insights and Forecast - by Price Trend Analysis
- 7. North America Cranberry Industry Analysis, Insights and Forecast, 2020-2032
- 7.1. Market Analysis, Insights and Forecast - by Production Analysis
- 7.2. Market Analysis, Insights and Forecast - by Consumption Analysis
- 7.3. Market Analysis, Insights and Forecast - by Import Market Analysis (Value & Volume)
- 7.4. Market Analysis, Insights and Forecast - by Export Market Analysis (Value & Volume)
- 7.5. Market Analysis, Insights and Forecast - by Price Trend Analysis
- 8. Europe Cranberry Industry Analysis, Insights and Forecast, 2020-2032
- 8.1. Market Analysis, Insights and Forecast - by Production Analysis
- 8.2. Market Analysis, Insights and Forecast - by Consumption Analysis
- 8.3. Market Analysis, Insights and Forecast - by Import Market Analysis (Value & Volume)
- 8.4. Market Analysis, Insights and Forecast - by Export Market Analysis (Value & Volume)
- 8.5. Market Analysis, Insights and Forecast - by Price Trend Analysis
- 9. Asia Pacific Cranberry Industry Analysis, Insights and Forecast, 2020-2032
- 9.1. Market Analysis, Insights and Forecast - by Production Analysis
- 9.2. Market Analysis, Insights and Forecast - by Consumption Analysis
- 9.3. Market Analysis, Insights and Forecast - by Import Market Analysis (Value & Volume)
- 9.4. Market Analysis, Insights and Forecast - by Export Market Analysis (Value & Volume)
- 9.5. Market Analysis, Insights and Forecast - by Price Trend Analysis
- 10. South America Cranberry Industry Analysis, Insights and Forecast, 2020-2032
- 10.1. Market Analysis, Insights and Forecast - by Production Analysis
- 10.2. Market Analysis, Insights and Forecast - by Consumption Analysis
- 10.3. Market Analysis, Insights and Forecast - by Import Market Analysis (Value & Volume)
- 10.4. Market Analysis, Insights and Forecast - by Export Market Analysis (Value & Volume)
- 10.5. Market Analysis, Insights and Forecast - by Price Trend Analysis
- 11. Africa Cranberry Industry Analysis, Insights and Forecast, 2020-2032
- 11.1. Market Analysis, Insights and Forecast - by Production Analysis
- 11.2. Market Analysis, Insights and Forecast - by Consumption Analysis
- 11.3. Market Analysis, Insights and Forecast - by Import Market Analysis (Value & Volume)
- 11.4. Market Analysis, Insights and Forecast - by Export Market Analysis (Value & Volume)
- 11.5. Market Analysis, Insights and Forecast - by Price Trend Analysis
- 12. Competitive Analysis
- 12.1. Company Profiles
- 12.1.1 Ocean Spray Cranberries Inc.
- 12.1.1.1. Company Overview
- 12.1.1.2. Products
- 12.1.1.3. Company Financials
- 12.1.1.4. SWOT Analysis
- 12.1.2 Northland Cranberries Inc.
- 12.1.2.1. Company Overview
- 12.1.2.2. Products
- 12.1.2.3. Company Financials
- 12.1.2.4. SWOT Analysis
- 12.1.3 Cape Cod Cranberry Growers' Association
- 12.1.3.1. Company Overview
- 12.1.3.2. Products
- 12.1.3.3. Company Financials
- 12.1.3.4. SWOT Analysis
- 12.1.4 Canadian Cranberry Growers Association
- 12.1.4.1. Company Overview
- 12.1.4.2. Products
- 12.1.4.3. Company Financials
- 12.1.4.4. SWOT Analysis
- 12.1.5 Wisconsin Cranberry Cooperative
- 12.1.5.1. Company Overview
- 12.1.5.2. Products
- 12.1.5.3. Company Financials
- 12.1.5.4. SWOT Analysis
- 12.1.1 Ocean Spray Cranberries Inc.
- 12.2. Market Entropy
- 12.2.1 Company's Key Areas Served
- 12.2.2 Recent Developments
- 12.3. Company Market Share Analysis 2025
- 12.3.1 Top 5 Companies Market Share Analysis
- 12.3.2 Top 3 Companies Market Share Analysis
- 12.4. List of Potential Customers
- 13. Research Methodology
List of Figures
- Figure 1: Global Cranberry Industry Revenue Breakdown (billion, %) by Region 2025 & 2033
- Figure 2: North America Cranberry Industry Revenue (billion), by Production Analysis 2025 & 2033
- Figure 3: North America Cranberry Industry Revenue Share (%), by Production Analysis 2025 & 2033
- Figure 4: North America Cranberry Industry Revenue (billion), by Consumption Analysis 2025 & 2033
- Figure 5: North America Cranberry Industry Revenue Share (%), by Consumption Analysis 2025 & 2033
- Figure 6: North America Cranberry Industry Revenue (billion), by Import Market Analysis (Value & Volume) 2025 & 2033
- Figure 7: North America Cranberry Industry Revenue Share (%), by Import Market Analysis (Value & Volume) 2025 & 2033
- Figure 8: North America Cranberry Industry Revenue (billion), by Export Market Analysis (Value & Volume) 2025 & 2033
- Figure 9: North America Cranberry Industry Revenue Share (%), by Export Market Analysis (Value & Volume) 2025 & 2033
- Figure 10: North America Cranberry Industry Revenue (billion), by Price Trend Analysis 2025 & 2033
- Figure 11: North America Cranberry Industry Revenue Share (%), by Price Trend Analysis 2025 & 2033
- Figure 12: North America Cranberry Industry Revenue (billion), by Country 2025 & 2033
- Figure 13: North America Cranberry Industry Revenue Share (%), by Country 2025 & 2033
- Figure 14: Europe Cranberry Industry Revenue (billion), by Production Analysis 2025 & 2033
- Figure 15: Europe Cranberry Industry Revenue Share (%), by Production Analysis 2025 & 2033
- Figure 16: Europe Cranberry Industry Revenue (billion), by Consumption Analysis 2025 & 2033
- Figure 17: Europe Cranberry Industry Revenue Share (%), by Consumption Analysis 2025 & 2033
- Figure 18: Europe Cranberry Industry Revenue (billion), by Import Market Analysis (Value & Volume) 2025 & 2033
- Figure 19: Europe Cranberry Industry Revenue Share (%), by Import Market Analysis (Value & Volume) 2025 & 2033
- Figure 20: Europe Cranberry Industry Revenue (billion), by Export Market Analysis (Value & Volume) 2025 & 2033
- Figure 21: Europe Cranberry Industry Revenue Share (%), by Export Market Analysis (Value & Volume) 2025 & 2033
- Figure 22: Europe Cranberry Industry Revenue (billion), by Price Trend Analysis 2025 & 2033
- Figure 23: Europe Cranberry Industry Revenue Share (%), by Price Trend Analysis 2025 & 2033
- Figure 24: Europe Cranberry Industry Revenue (billion), by Country 2025 & 2033
- Figure 25: Europe Cranberry Industry Revenue Share (%), by Country 2025 & 2033
- Figure 26: Asia Pacific Cranberry Industry Revenue (billion), by Production Analysis 2025 & 2033
- Figure 27: Asia Pacific Cranberry Industry Revenue Share (%), by Production Analysis 2025 & 2033
- Figure 28: Asia Pacific Cranberry Industry Revenue (billion), by Consumption Analysis 2025 & 2033
- Figure 29: Asia Pacific Cranberry Industry Revenue Share (%), by Consumption Analysis 2025 & 2033
- Figure 30: Asia Pacific Cranberry Industry Revenue (billion), by Import Market Analysis (Value & Volume) 2025 & 2033
- Figure 31: Asia Pacific Cranberry Industry Revenue Share (%), by Import Market Analysis (Value & Volume) 2025 & 2033
- Figure 32: Asia Pacific Cranberry Industry Revenue (billion), by Export Market Analysis (Value & Volume) 2025 & 2033
- Figure 33: Asia Pacific Cranberry Industry Revenue Share (%), by Export Market Analysis (Value & Volume) 2025 & 2033
- Figure 34: Asia Pacific Cranberry Industry Revenue (billion), by Price Trend Analysis 2025 & 2033
- Figure 35: Asia Pacific Cranberry Industry Revenue Share (%), by Price Trend Analysis 2025 & 2033
- Figure 36: Asia Pacific Cranberry Industry Revenue (billion), by Country 2025 & 2033
- Figure 37: Asia Pacific Cranberry Industry Revenue Share (%), by Country 2025 & 2033
- Figure 38: South America Cranberry Industry Revenue (billion), by Production Analysis 2025 & 2033
- Figure 39: South America Cranberry Industry Revenue Share (%), by Production Analysis 2025 & 2033
- Figure 40: South America Cranberry Industry Revenue (billion), by Consumption Analysis 2025 & 2033
- Figure 41: South America Cranberry Industry Revenue Share (%), by Consumption Analysis 2025 & 2033
- Figure 42: South America Cranberry Industry Revenue (billion), by Import Market Analysis (Value & Volume) 2025 & 2033
- Figure 43: South America Cranberry Industry Revenue Share (%), by Import Market Analysis (Value & Volume) 2025 & 2033
- Figure 44: South America Cranberry Industry Revenue (billion), by Export Market Analysis (Value & Volume) 2025 & 2033
- Figure 45: South America Cranberry Industry Revenue Share (%), by Export Market Analysis (Value & Volume) 2025 & 2033
- Figure 46: South America Cranberry Industry Revenue (billion), by Price Trend Analysis 2025 & 2033
- Figure 47: South America Cranberry Industry Revenue Share (%), by Price Trend Analysis 2025 & 2033
- Figure 48: South America Cranberry Industry Revenue (billion), by Country 2025 & 2033
- Figure 49: South America Cranberry Industry Revenue Share (%), by Country 2025 & 2033
- Figure 50: Africa Cranberry Industry Revenue (billion), by Production Analysis 2025 & 2033
- Figure 51: Africa Cranberry Industry Revenue Share (%), by Production Analysis 2025 & 2033
- Figure 52: Africa Cranberry Industry Revenue (billion), by Consumption Analysis 2025 & 2033
- Figure 53: Africa Cranberry Industry Revenue Share (%), by Consumption Analysis 2025 & 2033
- Figure 54: Africa Cranberry Industry Revenue (billion), by Import Market Analysis (Value & Volume) 2025 & 2033
- Figure 55: Africa Cranberry Industry Revenue Share (%), by Import Market Analysis (Value & Volume) 2025 & 2033
- Figure 56: Africa Cranberry Industry Revenue (billion), by Export Market Analysis (Value & Volume) 2025 & 2033
- Figure 57: Africa Cranberry Industry Revenue Share (%), by Export Market Analysis (Value & Volume) 2025 & 2033
- Figure 58: Africa Cranberry Industry Revenue (billion), by Price Trend Analysis 2025 & 2033
- Figure 59: Africa Cranberry Industry Revenue Share (%), by Price Trend Analysis 2025 & 2033
- Figure 60: Africa Cranberry Industry Revenue (billion), by Country 2025 & 2033
- Figure 61: Africa Cranberry Industry Revenue Share (%), by Country 2025 & 2033
List of Tables
- Table 1: Global Cranberry Industry Revenue billion Forecast, by Production Analysis 2020 & 2033
- Table 2: Global Cranberry Industry Revenue billion Forecast, by Consumption Analysis 2020 & 2033
- Table 3: Global Cranberry Industry Revenue billion Forecast, by Import Market Analysis (Value & Volume) 2020 & 2033
- Table 4: Global Cranberry Industry Revenue billion Forecast, by Export Market Analysis (Value & Volume) 2020 & 2033
- Table 5: Global Cranberry Industry Revenue billion Forecast, by Price Trend Analysis 2020 & 2033
- Table 6: Global Cranberry Industry Revenue billion Forecast, by Region 2020 & 2033
- Table 7: Global Cranberry Industry Revenue billion Forecast, by Production Analysis 2020 & 2033
- Table 8: Global Cranberry Industry Revenue billion Forecast, by Consumption Analysis 2020 & 2033
- Table 9: Global Cranberry Industry Revenue billion Forecast, by Import Market Analysis (Value & Volume) 2020 & 2033
- Table 10: Global Cranberry Industry Revenue billion Forecast, by Export Market Analysis (Value & Volume) 2020 & 2033
- Table 11: Global Cranberry Industry Revenue billion Forecast, by Price Trend Analysis 2020 & 2033
- Table 12: Global Cranberry Industry Revenue billion Forecast, by Country 2020 & 2033
- Table 13: United States Cranberry Industry Revenue (billion) Forecast, by Application 2020 & 2033
- Table 14: Global Cranberry Industry Revenue billion Forecast, by Production Analysis 2020 & 2033
- Table 15: Global Cranberry Industry Revenue billion Forecast, by Consumption Analysis 2020 & 2033
- Table 16: Global Cranberry Industry Revenue billion Forecast, by Import Market Analysis (Value & Volume) 2020 & 2033
- Table 17: Global Cranberry Industry Revenue billion Forecast, by Export Market Analysis (Value & Volume) 2020 & 2033
- Table 18: Global Cranberry Industry Revenue billion Forecast, by Price Trend Analysis 2020 & 2033
- Table 19: Global Cranberry Industry Revenue billion Forecast, by Country 2020 & 2033
- Table 20: Germany Cranberry Industry Revenue (billion) Forecast, by Application 2020 & 2033
- Table 21: Global Cranberry Industry Revenue billion Forecast, by Production Analysis 2020 & 2033
- Table 22: Global Cranberry Industry Revenue billion Forecast, by Consumption Analysis 2020 & 2033
- Table 23: Global Cranberry Industry Revenue billion Forecast, by Import Market Analysis (Value & Volume) 2020 & 2033
- Table 24: Global Cranberry Industry Revenue billion Forecast, by Export Market Analysis (Value & Volume) 2020 & 2033
- Table 25: Global Cranberry Industry Revenue billion Forecast, by Price Trend Analysis 2020 & 2033
- Table 26: Global Cranberry Industry Revenue billion Forecast, by Country 2020 & 2033
- Table 27: China Cranberry Industry Revenue (billion) Forecast, by Application 2020 & 2033
- Table 28: Global Cranberry Industry Revenue billion Forecast, by Production Analysis 2020 & 2033
- Table 29: Global Cranberry Industry Revenue billion Forecast, by Consumption Analysis 2020 & 2033
- Table 30: Global Cranberry Industry Revenue billion Forecast, by Import Market Analysis (Value & Volume) 2020 & 2033
- Table 31: Global Cranberry Industry Revenue billion Forecast, by Export Market Analysis (Value & Volume) 2020 & 2033
- Table 32: Global Cranberry Industry Revenue billion Forecast, by Price Trend Analysis 2020 & 2033
- Table 33: Global Cranberry Industry Revenue billion Forecast, by Country 2020 & 2033
- Table 34: Chile Cranberry Industry Revenue (billion) Forecast, by Application 2020 & 2033
- Table 35: Global Cranberry Industry Revenue billion Forecast, by Production Analysis 2020 & 2033
- Table 36: Global Cranberry Industry Revenue billion Forecast, by Consumption Analysis 2020 & 2033
- Table 37: Global Cranberry Industry Revenue billion Forecast, by Import Market Analysis (Value & Volume) 2020 & 2033
- Table 38: Global Cranberry Industry Revenue billion Forecast, by Export Market Analysis (Value & Volume) 2020 & 2033
- Table 39: Global Cranberry Industry Revenue billion Forecast, by Price Trend Analysis 2020 & 2033
- Table 40: Global Cranberry Industry Revenue billion Forecast, by Country 2020 & 2033
- Table 41: South Africa Cranberry Industry Revenue (billion) Forecast, by Application 2020 & 2033
Frequently Asked Questions
1. What is the projected Compound Annual Growth Rate (CAGR) of the Cranberry Industry?
The projected CAGR is approximately 4.2%.
2. Which companies are prominent players in the Cranberry Industry?
Key companies in the market include Ocean Spray Cranberries, Inc. , Northland Cranberries, Inc. , Cape Cod Cranberry Growers' Association , Canadian Cranberry Growers Association, Wisconsin Cranberry Cooperative .
3. What are the main segments of the Cranberry Industry?
The market segments include Production Analysis, Consumption Analysis, Import Market Analysis (Value & Volume), Export Market Analysis (Value & Volume), Price Trend Analysis.
4. Can you provide details about the market size?
The market size is estimated to be USD 2.9 billion as of 2022.
5. What are some drivers contributing to market growth?
Rise in Percentage of Area Harvested Under Almond Cultivation; Demand for Healthy Snacking Options.
6. What are the notable trends driving market growth?
Increasing Demand from Processing Industry.
7. Are there any restraints impacting market growth?
Water Scarcity in Almond Producing Regions; Drop in the Prices of Almonds.
8. Can you provide examples of recent developments in the market?
March 2022: Ocean Spray Cranberries, Inc., the agricultural cooperative owned by more than 700 farmer families, and Canomiks, a startup technology company transforming the functional food and beverage industry, announced research leveraging Canomiks' A.I. based technology platform to test and certify the biological efficacy of the cranberry. The relationship with Canomiks, through Ocean Spray's existing partnership with the incubator Plug and Play, enables the company further to validate the superfruit nature of cranberry's biological efficacy.
9. What pricing options are available for accessing the report?
Pricing options include single-user, multi-user, and enterprise licenses priced at USD 4750, USD 5250, and USD 8750 respectively.
10. Is the market size provided in terms of value or volume?
The market size is provided in terms of value, measured in billion.
11. Are there any specific market keywords associated with the report?
Yes, the market keyword associated with the report is "Cranberry Industry," which aids in identifying and referencing the specific market segment covered.
12. How do I determine which pricing option suits my needs best?
The pricing options vary based on user requirements and access needs. Individual users may opt for single-user licenses, while businesses requiring broader access may choose multi-user or enterprise licenses for cost-effective access to the report.
13. Are there any additional resources or data provided in the Cranberry Industry report?
While the report offers comprehensive insights, it's advisable to review the specific contents or supplementary materials provided to ascertain if additional resources or data are available.
14. How can I stay updated on further developments or reports in the Cranberry Industry?
To stay informed about further developments, trends, and reports in the Cranberry Industry, consider subscribing to industry newsletters, following relevant companies and organizations, or regularly checking reputable industry news sources and publications.
Methodology
Step 1 - Identification of Relevant Samples Size from Population Database


Step 2 - Approaches for Defining Global Market Size (Value, Volume* & Price*)

Note*: In applicable scenarios
Step 3 - Data Sources
Primary Research
- Web Analytics
- Survey Reports
- Research Institute
- Latest Research Reports
- Opinion Leaders
Secondary Research
- Annual Reports
- White Paper
- Latest Press Release
- Industry Association
- Paid Database
- Investor Presentations

Step 4 - Data Triangulation
Involves using different sources of information in order to increase the validity of a study
These sources are likely to be stakeholders in a program - participants, other researchers, program staff, other community members, and so on.
Then we put all data in single framework & apply various statistical tools to find out the dynamic on the market.
During the analysis stage, feedback from the stakeholder groups would be compared to determine areas of agreement as well as areas of divergence