

Key Insights
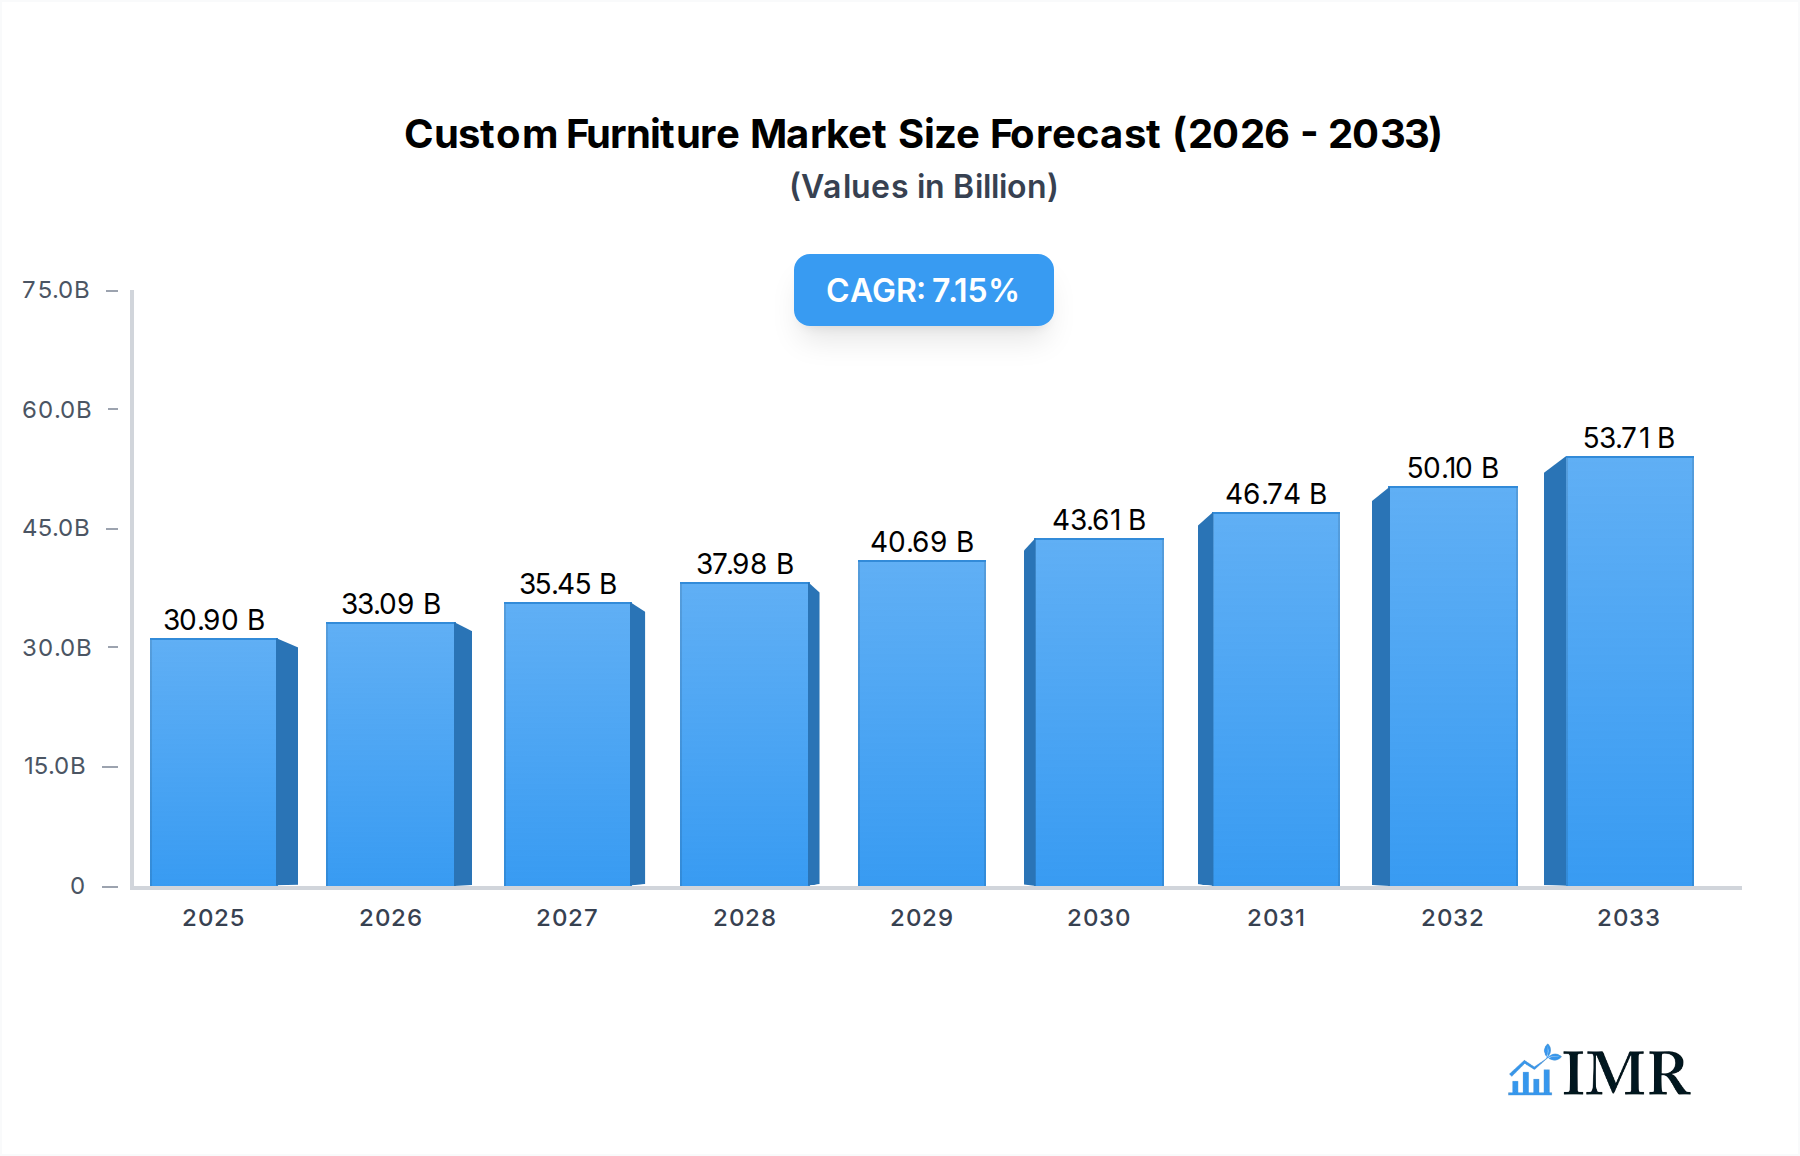
The global custom furniture market is poised for substantial growth, projected to reach an estimated $30.9 billion in 2025, expanding at a robust CAGR of 6.8% through 2033. This upward trajectory is fueled by a confluence of evolving consumer preferences and increasing disposable incomes, particularly in emerging economies. The "do-it-yourself" culture, coupled with a growing desire for personalized living spaces that reflect individual aesthetics and functional needs, is a primary driver. Consumers are moving away from mass-produced, one-size-fits-all solutions and are actively seeking bespoke furniture that optimizes space utilization, especially in urban environments with smaller living quarters. This trend is further amplified by the rising popularity of interior design services and the influence of social media platforms showcasing unique and customized home environments. The increasing adoption of e-commerce channels for furniture purchases also contributes significantly, offering consumers greater accessibility and a wider selection of customization options.

Custom Furniture Market Size (In Billion)
The market's expansion is further bolstered by the thriving construction and real estate sectors, which create a continuous demand for interior fittings and furnishings. As new homes are built and existing ones renovated, the demand for custom-designed cabinets, wardrobes, and other furniture pieces remains consistently high. Technological advancements in manufacturing, such as 3D printing and advanced CNC machining, are also playing a crucial role by enabling greater design complexity, faster production cycles, and more cost-effective customization. The market is segmented across various applications, with online sales and chain stores emerging as dominant channels, alongside family decorating companies and other niche segments. Key product types include cabinets, wardrobes, unit bathrooms, doors, and windows, all of which benefit from the customization trend. Leading companies like Oppein Home Group Inc., GoldenHome Living Co.,Ltd., and Suofeiya Home Collection Co. Ltd. are at the forefront, innovating and catering to this burgeoning demand.
Custom Furniture Company Market Share
This in-depth report provides a panoramic view of the global custom furniture market, meticulously analyzing its structure, growth trajectories, and future potential. Covering the historical period from 2019-2024, base year 2025, and a comprehensive forecast period from 2025-2033, this report is an indispensable resource for industry stakeholders, investors, and strategic planners. We delve into critical market dynamics, pinpoint key growth drivers, and identify emerging opportunities within the rapidly evolving custom furniture landscape. This analysis incorporates high-traffic keywords relevant to custom furniture, home decor, interior design, cabinetry, wardrobes, and related segments, ensuring maximum search engine visibility and engagement with industry professionals. The report also segments the market by application (Online Sales, Chain Store, Family Decorating Company, Others) and product type (Cabinet, Wardrobe, Unit Bathroom, Door, Window, Others), offering granular insights into niche market performance.
Custom Furniture Market Dynamics & Structure
The global custom furniture market exhibits a dynamic structure characterized by moderate concentration and significant technological innovation. While established players like Oppein Home Group Inc., GoldenHome Living Co.,Ltd., Suofeiya Home Collection Co. Ltd., Guangzhou Holike Creative Home Co.,Ltd, Guangzhou Shangpin Home Collection Co.,Ltd, Zbom Home Collection Co.,Ltd, Nanjing OLO Home Furnishing Co.,Ltd., Guangdong Piano Customized Furniture Co.,Ltd., and Yihua Lifestyle Technology Co.,Ltd. hold substantial market share, the landscape is continuously shaped by new entrants and evolving consumer demands. Technological advancements, particularly in design software, 3D printing, and material science, are key drivers, enabling greater personalization and efficiency. Regulatory frameworks, while generally supportive of home improvement industries, can vary by region, impacting manufacturing and distribution. Competitive product substitutes, such as modular furniture and mass-produced items, pose a constant challenge, necessitating a focus on unique value propositions. End-user demographics are shifting towards younger, digitally-savvy consumers who prioritize personalization and sustainability. Mergers and acquisitions (M&A) are an ongoing trend, with strategic consolidation aimed at expanding product portfolios and market reach. For instance, the historical period saw an estimated volume of 5-10 M&A deals annually within the custom furniture sector.
- Market Concentration: Moderate, with a mix of large enterprises and numerous small to medium-sized businesses.
- Technological Innovation Drivers: Advanced CAD/CAM software, AI-driven design recommendations, sustainable material development, and smart furniture integration.
- Regulatory Frameworks: Primarily focused on safety standards, environmental compliance, and consumer protection.
- Competitive Product Substitutes: Mass-produced furniture, flat-pack furniture, and DIY furniture solutions.
- End-User Demographics: Growing demand from millennials and Gen Z for personalized, aesthetically pleasing, and eco-friendly products.
- M&A Trends: Strategic acquisitions to gain market share, acquire new technologies, and expand geographical presence. The estimated deal volume for M&A activities in custom furniture within the historical period of 2019-2024 was between 5 to 10 billion units per year.
Custom Furniture Growth Trends & Insights
The custom furniture market is poised for robust growth, with an estimated Compound Annual Growth Rate (CAGR) of approximately 7.5% projected over the forecast period of 2025-2033. The market size, valued at an estimated $120 billion in the base year 2025, is expected to witness substantial expansion. Adoption rates for custom solutions are increasing across all segments, driven by a heightened consumer desire for unique living spaces that reflect individual style and functional needs. Technological disruptions, including the widespread adoption of augmented reality (AR) and virtual reality (VR) for design visualization and online customization platforms, are revolutionizing the customer experience. Consumer behavior shifts towards prioritizing quality, longevity, and ethical sourcing of materials are further fueling demand for bespoke furniture. The increasing disposable income in developing economies and the growing trend of home renovation and remodeling projects are significant contributors to this upward trajectory. Furthermore, the surge in online sales channels for custom furniture is democratizing access and broadening the market reach, making personalized home solutions more accessible than ever before. This evolution signifies a move away from generic furnishings towards investments in pieces that offer both aesthetic appeal and enduring utility, directly impacting the market's trajectory and value.
- Market Size Evolution: Projected to grow from an estimated $120 billion in 2025 to over $200 billion by 2033.
- CAGR: Estimated at 7.5% for the forecast period 2025-2033.
- Adoption Rates: Steadily increasing across residential and commercial sectors due to demand for personalization.
- Technological Disruptions: Augmented Reality (AR) and Virtual Reality (VR) integration for design visualization, AI-powered design assistants, and advanced online configurators.
- Consumer Behavior Shifts: Emphasis on sustainability, ethical sourcing, unique aesthetics, and furniture longevity.
- Market Penetration: Expanding beyond urban centers into suburban and rural areas, facilitated by e-commerce.
Dominant Regions, Countries, or Segments in Custom Furniture
The North America region, particularly the United States, is a dominant force in the global custom furniture market, driven by high disposable incomes, a strong culture of home personalization, and a robust interior design industry. The Online Sales segment is emerging as a significant growth accelerator, with an estimated market share of 35% in 2025, expected to expand further due to increasing internet penetration and the convenience offered by digital platforms. Within product types, Wardrobe and Cabinet segments are leading the market, collectively accounting for an estimated 50% of the market share in 2025, fueled by kitchen and bedroom renovation trends.
- Dominant Region: North America, with the United States leading due to high consumer spending and a well-established home decor industry.
- Key Segment (Application): Online Sales:
- Market Share (2025): Estimated at 35 billion units.
- Growth Potential: High, driven by e-commerce advancements and consumer preference for convenience.
- Drivers: Accessible customization tools, direct-to-consumer models, and efficient logistics.
- Dominant Segments (Types): Wardrobe and Cabinet:
- Combined Market Share (2025): Estimated at 50 billion units.
- Drivers: Growing demand for organized living spaces, kitchen and bathroom renovations, and integrated storage solutions.
- Sub-segments: Custom kitchens, walk-in closets, built-in wardrobes, and modular cabinets.
- Other Contributing Factors:
- Economic Policies: Favorable housing market conditions and government incentives for home improvement.
- Infrastructure: Developed logistics and supply chain networks facilitating nationwide delivery of custom orders.
- Consumer Preferences: Strong inclination towards personalized aesthetics and functional living spaces.
- Family Decorating Company segment: Plays a crucial role in driving demand through professional interior design services and project management. Estimated market share of 20 billion units in 2025.
- Others segment: Encompasses specialized custom furniture for commercial spaces and unique architectural integrations. Estimated market share of 15 billion units in 2025.
Custom Furniture Product Landscape
The custom furniture product landscape is characterized by an escalating emphasis on material innovation, design flexibility, and smart integration. Manufacturers are increasingly offering sustainable materials such as bamboo, recycled wood, and low-VOC finishes, appealing to eco-conscious consumers. The advent of advanced design software allows for unparalleled personalization, from intricate detailing to bespoke dimensions, catering to unique spatial requirements. Performance metrics are now centered on durability, ease of maintenance, and ergonomic design. Technological advancements include the integration of smart features, such as embedded charging ports, adjustable lighting, and voice-controlled functionalities, enhancing user experience and offering unique selling propositions. For instance, custom wardrobes now often feature integrated LED lighting and automated drawer systems, while custom cabinets can be equipped with soft-close mechanisms and anti-fingerprint coatings, demonstrating a commitment to both aesthetics and practicality in the evolving market.
Key Drivers, Barriers & Challenges in Custom Furniture
The custom furniture market is propelled by several key drivers, including the escalating consumer demand for personalized living spaces, technological advancements in design and manufacturing, and the growing influence of interior design trends disseminated through social media. Economic growth, rising disposable incomes, and a strong housing market also significantly contribute to market expansion.
- Key Drivers:
- Personalization Demand: Growing consumer desire for unique, space-specific furniture.
- Technological Advancements: Improved design software, 3D printing, and efficient manufacturing processes.
- Interior Design Influence: Social media and design professionals driving aesthetic trends.
- Economic Growth: Increased disposable income and a robust housing market.
Conversely, the market faces several barriers and challenges. High production costs associated with bespoke manufacturing and longer lead times compared to mass-produced furniture can deter some consumers. Supply chain disruptions, particularly for specialized materials, and the increasing cost of raw materials present significant operational hurdles. Fierce competition from online retailers offering more accessible options and the need for skilled labor in design and craftsmanship also pose challenges.
- Barriers & Challenges:
- High Production Costs: Customization often leads to higher price points.
- Longer Lead Times: Manufacturing bespoke items requires more time.
- Supply Chain Vulnerabilities: Dependence on specialized materials and global logistics.
- Raw Material Cost Volatility: Fluctuations in lumber, metal, and fabric prices.
- Intense Competition: From mass-market brands and online marketplaces.
- Skilled Labor Shortage: Demand for experienced designers and craftspeople.
Emerging Opportunities in Custom Furniture
Emerging opportunities in the custom furniture sector lie in the increasing demand for sustainable and eco-friendly products, smart furniture integration, and the expansion into niche markets. The growing awareness of environmental impact is driving innovation in recycled and upcycled materials, creating a strong value proposition for environmentally conscious consumers. The integration of smart home technology, such as voice-activated controls and IoT capabilities, within custom furniture offers a pathway to higher-value products and unique selling propositions. Furthermore, tapping into underserved markets, such as custom furniture for small living spaces, accessible furniture for individuals with disabilities, and bespoke pieces for the hospitality and contract sectors, presents significant growth potential. The rise of direct-to-consumer (DTC) models, supported by robust online platforms and virtual consultations, also opens avenues for broader market reach and customer engagement, particularly in emerging economies.
Growth Accelerators in the Custom Furniture Industry
Several catalysts are accelerating long-term growth in the custom furniture industry. Technological breakthroughs in additive manufacturing (3D printing) are enabling the creation of highly complex and customized designs more efficiently and cost-effectively. Strategic partnerships between furniture manufacturers, interior designers, and technology providers are fostering innovation and expanding product offerings. For example, collaborations on integrated smart home solutions or sustainable material sourcing are becoming more prevalent. Market expansion strategies, including entering new geographical regions and diversifying product lines to cater to evolving consumer preferences, are also critical. The growing emphasis on experiential retail, where customers can interact with customized products and design processes, is another significant growth accelerator, enhancing brand loyalty and driving sales.
Key Players Shaping the Custom Furniture Market
- Oppein Home Group Inc.
- GoldenHome Living Co.,Ltd.
- Suofeiya Home Collection Co. Ltd.
- Guangzhou Holike Creative Home Co.,Ltd
- Guangzhou Shangpin Home Collection Co.,Ltd
- Zbom Home Collection Co.,Ltd
- Nanjing OLO Home Furnishing Co.,Ltd.
- Guangdong Piano Customized Furniture Co.,Ltd.
- Yihua Lifestyle Technology Co.,Ltd.
Notable Milestones in Custom Furniture Sector
- 2019: Increased adoption of AR/VR in online furniture visualization platforms.
- 2020: Surge in demand for home office furniture and personalized living spaces due to remote work trends.
- 2021: Growing emphasis on sustainable materials and eco-friendly manufacturing practices.
- 2022: Expansion of direct-to-consumer (DTC) e-commerce models for custom furniture.
- 2023: Advancements in AI-powered design tools for enhanced customer personalization.
- 2024: Increased investment in smart furniture technology and integrated home solutions.
In-Depth Custom Furniture Market Outlook
The future outlook for the custom furniture market is exceptionally promising, driven by an interplay of sustained consumer demand for personalization and continuous technological innovation. Growth accelerators such as advancements in 3D printing for intricate designs and the integration of smart home features will further solidify the market's upward trajectory. Strategic collaborations and market expansion into emerging economies will unlock new revenue streams. The industry's ability to adapt to evolving consumer preferences for sustainability and unique aesthetic expressions will be paramount. This dynamic market is well-positioned for significant expansion, offering substantial opportunities for stakeholders willing to embrace innovation and customer-centric approaches.
Custom Furniture Segmentation
-
1. Application
- 1.1. Online Sales
- 1.2. Chain Store
- 1.3. Family Decorating Company
- 1.4. Others
-
2. Types
- 2.1. Cabinet
- 2.2. Wardrobe
- 2.3. Unit Bathroom
- 2.4. Door
- 2.5. Window
- 2.6. Others
Custom Furniture Segmentation By Geography
-
1. North America
- 1.1. United States
- 1.2. Canada
- 1.3. Mexico
-
2. South America
- 2.1. Brazil
- 2.2. Argentina
- 2.3. Rest of South America
-
3. Europe
- 3.1. United Kingdom
- 3.2. Germany
- 3.3. France
- 3.4. Italy
- 3.5. Spain
- 3.6. Russia
- 3.7. Benelux
- 3.8. Nordics
- 3.9. Rest of Europe
-
4. Middle East & Africa
- 4.1. Turkey
- 4.2. Israel
- 4.3. GCC
- 4.4. North Africa
- 4.5. South Africa
- 4.6. Rest of Middle East & Africa
-
5. Asia Pacific
- 5.1. China
- 5.2. India
- 5.3. Japan
- 5.4. South Korea
- 5.5. ASEAN
- 5.6. Oceania
- 5.7. Rest of Asia Pacific
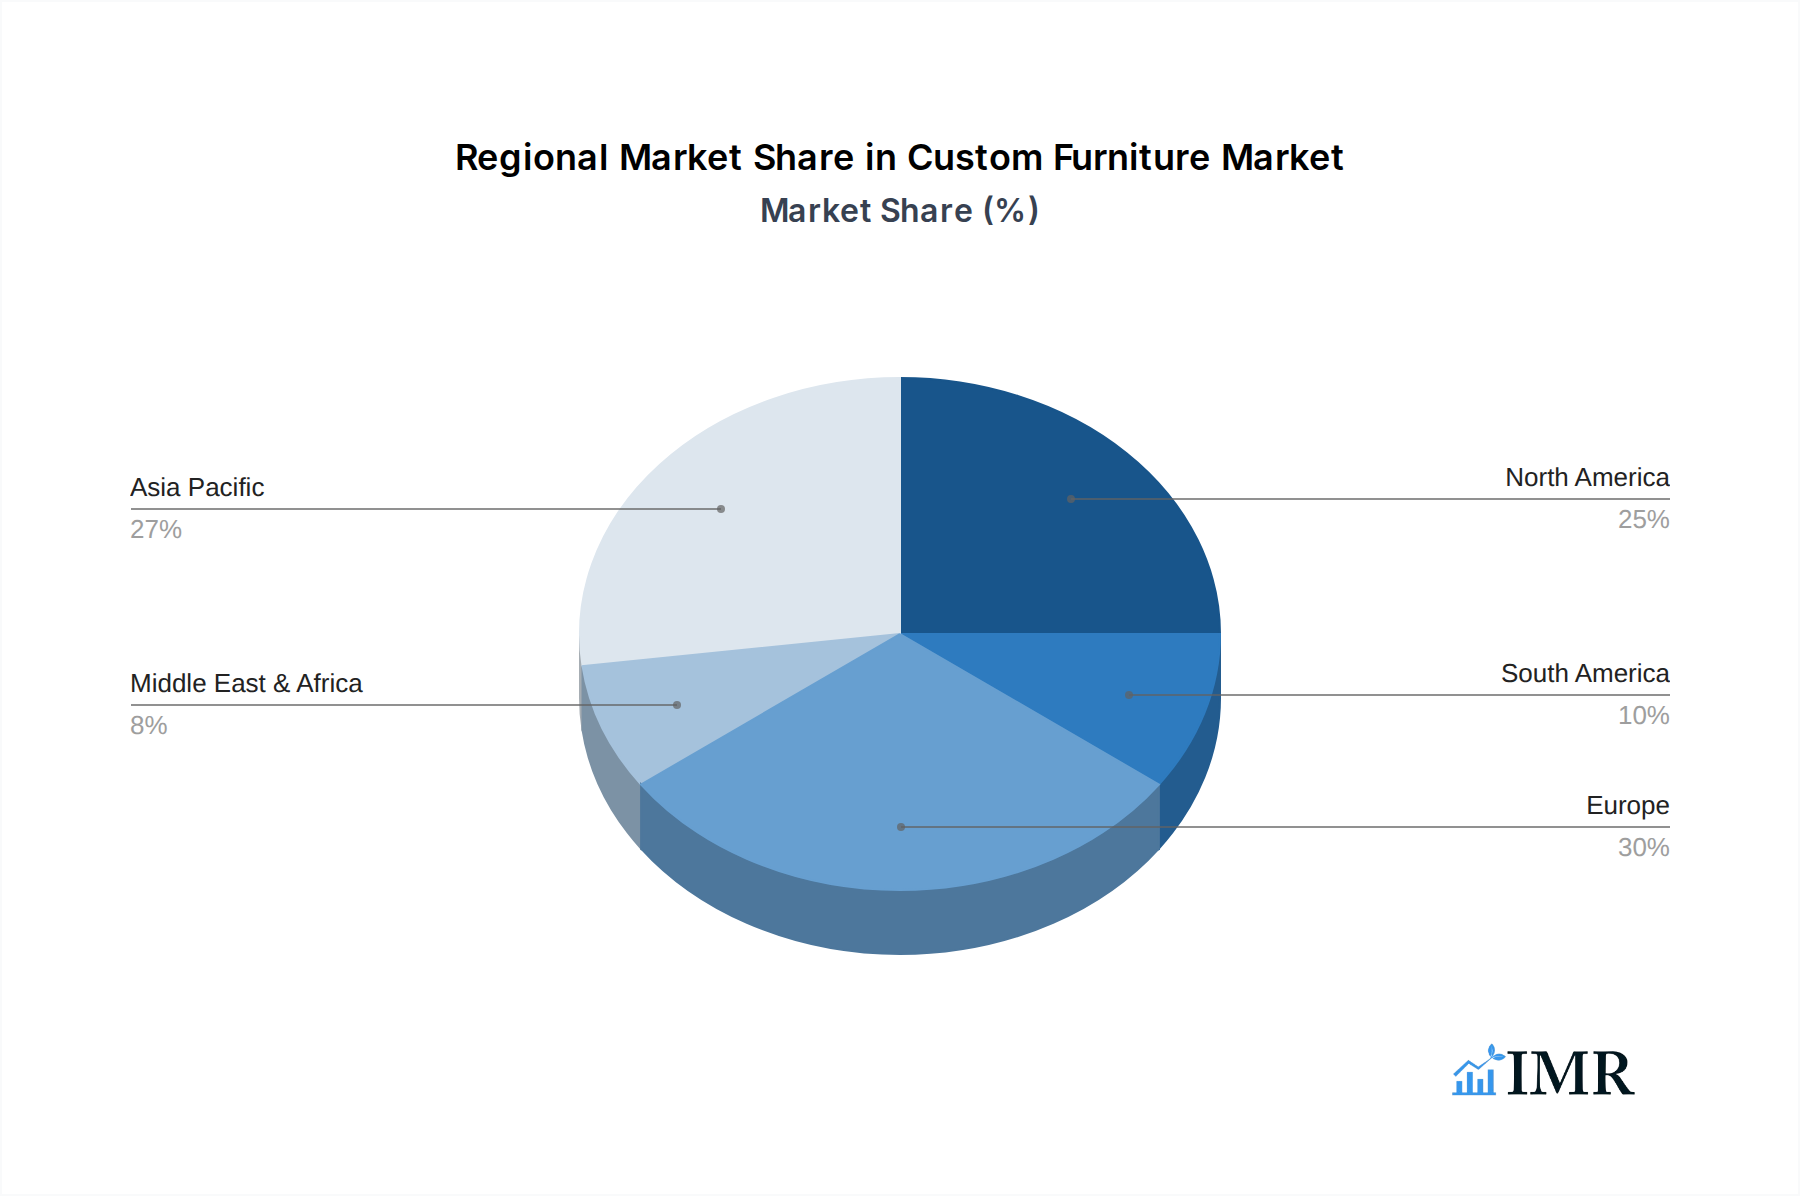
Custom Furniture Regional Market Share
Geographic Coverage of Custom Furniture
Custom Furniture REPORT HIGHLIGHTS
| Aspects | Details |
|---|---|
| Study Period | 2020-2034 |
| Base Year | 2025 |
| Estimated Year | 2026 |
| Forecast Period | 2026-2034 |
| Historical Period | 2020-2025 |
| Growth Rate | CAGR of 6.8% from 2020-2034 |
| Segmentation |
|
Table of Contents
- 1. Introduction
- 1.1. Research Scope
- 1.2. Market Segmentation
- 1.3. Research Methodology
- 1.4. Definitions and Assumptions
- 2. Executive Summary
- 2.1. Introduction
- 3. Market Dynamics
- 3.1. Introduction
- 3.2. Market Drivers
- 3.3. Market Restrains
- 3.4. Market Trends
- 4. Market Factor Analysis
- 4.1. Porters Five Forces
- 4.2. Supply/Value Chain
- 4.3. PESTEL analysis
- 4.4. Market Entropy
- 4.5. Patent/Trademark Analysis
- 5. Global Custom Furniture Analysis, Insights and Forecast, 2020-2032
- 5.1. Market Analysis, Insights and Forecast - by Application
- 5.1.1. Online Sales
- 5.1.2. Chain Store
- 5.1.3. Family Decorating Company
- 5.1.4. Others
- 5.2. Market Analysis, Insights and Forecast - by Types
- 5.2.1. Cabinet
- 5.2.2. Wardrobe
- 5.2.3. Unit Bathroom
- 5.2.4. Door
- 5.2.5. Window
- 5.2.6. Others
- 5.3. Market Analysis, Insights and Forecast - by Region
- 5.3.1. North America
- 5.3.2. South America
- 5.3.3. Europe
- 5.3.4. Middle East & Africa
- 5.3.5. Asia Pacific
- 5.1. Market Analysis, Insights and Forecast - by Application
- 6. North America Custom Furniture Analysis, Insights and Forecast, 2020-2032
- 6.1. Market Analysis, Insights and Forecast - by Application
- 6.1.1. Online Sales
- 6.1.2. Chain Store
- 6.1.3. Family Decorating Company
- 6.1.4. Others
- 6.2. Market Analysis, Insights and Forecast - by Types
- 6.2.1. Cabinet
- 6.2.2. Wardrobe
- 6.2.3. Unit Bathroom
- 6.2.4. Door
- 6.2.5. Window
- 6.2.6. Others
- 6.1. Market Analysis, Insights and Forecast - by Application
- 7. South America Custom Furniture Analysis, Insights and Forecast, 2020-2032
- 7.1. Market Analysis, Insights and Forecast - by Application
- 7.1.1. Online Sales
- 7.1.2. Chain Store
- 7.1.3. Family Decorating Company
- 7.1.4. Others
- 7.2. Market Analysis, Insights and Forecast - by Types
- 7.2.1. Cabinet
- 7.2.2. Wardrobe
- 7.2.3. Unit Bathroom
- 7.2.4. Door
- 7.2.5. Window
- 7.2.6. Others
- 7.1. Market Analysis, Insights and Forecast - by Application
- 8. Europe Custom Furniture Analysis, Insights and Forecast, 2020-2032
- 8.1. Market Analysis, Insights and Forecast - by Application
- 8.1.1. Online Sales
- 8.1.2. Chain Store
- 8.1.3. Family Decorating Company
- 8.1.4. Others
- 8.2. Market Analysis, Insights and Forecast - by Types
- 8.2.1. Cabinet
- 8.2.2. Wardrobe
- 8.2.3. Unit Bathroom
- 8.2.4. Door
- 8.2.5. Window
- 8.2.6. Others
- 8.1. Market Analysis, Insights and Forecast - by Application
- 9. Middle East & Africa Custom Furniture Analysis, Insights and Forecast, 2020-2032
- 9.1. Market Analysis, Insights and Forecast - by Application
- 9.1.1. Online Sales
- 9.1.2. Chain Store
- 9.1.3. Family Decorating Company
- 9.1.4. Others
- 9.2. Market Analysis, Insights and Forecast - by Types
- 9.2.1. Cabinet
- 9.2.2. Wardrobe
- 9.2.3. Unit Bathroom
- 9.2.4. Door
- 9.2.5. Window
- 9.2.6. Others
- 9.1. Market Analysis, Insights and Forecast - by Application
- 10. Asia Pacific Custom Furniture Analysis, Insights and Forecast, 2020-2032
- 10.1. Market Analysis, Insights and Forecast - by Application
- 10.1.1. Online Sales
- 10.1.2. Chain Store
- 10.1.3. Family Decorating Company
- 10.1.4. Others
- 10.2. Market Analysis, Insights and Forecast - by Types
- 10.2.1. Cabinet
- 10.2.2. Wardrobe
- 10.2.3. Unit Bathroom
- 10.2.4. Door
- 10.2.5. Window
- 10.2.6. Others
- 10.1. Market Analysis, Insights and Forecast - by Application
- 11. Competitive Analysis
- 11.1. Global Market Share Analysis 2025
- 11.2. Company Profiles
- 11.2.1 Oppein Home Group Inc.
- 11.2.1.1. Overview
- 11.2.1.2. Products
- 11.2.1.3. SWOT Analysis
- 11.2.1.4. Recent Developments
- 11.2.1.5. Financials (Based on Availability)
- 11.2.2 GoldenHome Living Co.
- 11.2.2.1. Overview
- 11.2.2.2. Products
- 11.2.2.3. SWOT Analysis
- 11.2.2.4. Recent Developments
- 11.2.2.5. Financials (Based on Availability)
- 11.2.3 Ltd.
- 11.2.3.1. Overview
- 11.2.3.2. Products
- 11.2.3.3. SWOT Analysis
- 11.2.3.4. Recent Developments
- 11.2.3.5. Financials (Based on Availability)
- 11.2.4 Suofeiya Home Collection Co. Ltd.
- 11.2.4.1. Overview
- 11.2.4.2. Products
- 11.2.4.3. SWOT Analysis
- 11.2.4.4. Recent Developments
- 11.2.4.5. Financials (Based on Availability)
- 11.2.5 Guangzhou Holike Creative Home Co.
- 11.2.5.1. Overview
- 11.2.5.2. Products
- 11.2.5.3. SWOT Analysis
- 11.2.5.4. Recent Developments
- 11.2.5.5. Financials (Based on Availability)
- 11.2.6 Ltd
- 11.2.6.1. Overview
- 11.2.6.2. Products
- 11.2.6.3. SWOT Analysis
- 11.2.6.4. Recent Developments
- 11.2.6.5. Financials (Based on Availability)
- 11.2.7 Guangzhou Shangpin Home Collection Co.
- 11.2.7.1. Overview
- 11.2.7.2. Products
- 11.2.7.3. SWOT Analysis
- 11.2.7.4. Recent Developments
- 11.2.7.5. Financials (Based on Availability)
- 11.2.8 Ltd
- 11.2.8.1. Overview
- 11.2.8.2. Products
- 11.2.8.3. SWOT Analysis
- 11.2.8.4. Recent Developments
- 11.2.8.5. Financials (Based on Availability)
- 11.2.9 Zbom Home Collection Co.
- 11.2.9.1. Overview
- 11.2.9.2. Products
- 11.2.9.3. SWOT Analysis
- 11.2.9.4. Recent Developments
- 11.2.9.5. Financials (Based on Availability)
- 11.2.10 Ltd
- 11.2.10.1. Overview
- 11.2.10.2. Products
- 11.2.10.3. SWOT Analysis
- 11.2.10.4. Recent Developments
- 11.2.10.5. Financials (Based on Availability)
- 11.2.11 Nanjing OLO Home Furnishing Co.
- 11.2.11.1. Overview
- 11.2.11.2. Products
- 11.2.11.3. SWOT Analysis
- 11.2.11.4. Recent Developments
- 11.2.11.5. Financials (Based on Availability)
- 11.2.12 Ltd.
- 11.2.12.1. Overview
- 11.2.12.2. Products
- 11.2.12.3. SWOT Analysis
- 11.2.12.4. Recent Developments
- 11.2.12.5. Financials (Based on Availability)
- 11.2.13 Guangdong Piano Customized Furniture Co.
- 11.2.13.1. Overview
- 11.2.13.2. Products
- 11.2.13.3. SWOT Analysis
- 11.2.13.4. Recent Developments
- 11.2.13.5. Financials (Based on Availability)
- 11.2.14 Ltd.
- 11.2.14.1. Overview
- 11.2.14.2. Products
- 11.2.14.3. SWOT Analysis
- 11.2.14.4. Recent Developments
- 11.2.14.5. Financials (Based on Availability)
- 11.2.15 Yihua Lifestyle Technology Co.
- 11.2.15.1. Overview
- 11.2.15.2. Products
- 11.2.15.3. SWOT Analysis
- 11.2.15.4. Recent Developments
- 11.2.15.5. Financials (Based on Availability)
- 11.2.16 Ltd.
- 11.2.16.1. Overview
- 11.2.16.2. Products
- 11.2.16.3. SWOT Analysis
- 11.2.16.4. Recent Developments
- 11.2.16.5. Financials (Based on Availability)
- 11.2.1 Oppein Home Group Inc.
List of Figures
- Figure 1: Global Custom Furniture Revenue Breakdown (undefined, %) by Region 2025 & 2033
- Figure 2: Global Custom Furniture Volume Breakdown (K, %) by Region 2025 & 2033
- Figure 3: North America Custom Furniture Revenue (undefined), by Application 2025 & 2033
- Figure 4: North America Custom Furniture Volume (K), by Application 2025 & 2033
- Figure 5: North America Custom Furniture Revenue Share (%), by Application 2025 & 2033
- Figure 6: North America Custom Furniture Volume Share (%), by Application 2025 & 2033
- Figure 7: North America Custom Furniture Revenue (undefined), by Types 2025 & 2033
- Figure 8: North America Custom Furniture Volume (K), by Types 2025 & 2033
- Figure 9: North America Custom Furniture Revenue Share (%), by Types 2025 & 2033
- Figure 10: North America Custom Furniture Volume Share (%), by Types 2025 & 2033
- Figure 11: North America Custom Furniture Revenue (undefined), by Country 2025 & 2033
- Figure 12: North America Custom Furniture Volume (K), by Country 2025 & 2033
- Figure 13: North America Custom Furniture Revenue Share (%), by Country 2025 & 2033
- Figure 14: North America Custom Furniture Volume Share (%), by Country 2025 & 2033
- Figure 15: South America Custom Furniture Revenue (undefined), by Application 2025 & 2033
- Figure 16: South America Custom Furniture Volume (K), by Application 2025 & 2033
- Figure 17: South America Custom Furniture Revenue Share (%), by Application 2025 & 2033
- Figure 18: South America Custom Furniture Volume Share (%), by Application 2025 & 2033
- Figure 19: South America Custom Furniture Revenue (undefined), by Types 2025 & 2033
- Figure 20: South America Custom Furniture Volume (K), by Types 2025 & 2033
- Figure 21: South America Custom Furniture Revenue Share (%), by Types 2025 & 2033
- Figure 22: South America Custom Furniture Volume Share (%), by Types 2025 & 2033
- Figure 23: South America Custom Furniture Revenue (undefined), by Country 2025 & 2033
- Figure 24: South America Custom Furniture Volume (K), by Country 2025 & 2033
- Figure 25: South America Custom Furniture Revenue Share (%), by Country 2025 & 2033
- Figure 26: South America Custom Furniture Volume Share (%), by Country 2025 & 2033
- Figure 27: Europe Custom Furniture Revenue (undefined), by Application 2025 & 2033
- Figure 28: Europe Custom Furniture Volume (K), by Application 2025 & 2033
- Figure 29: Europe Custom Furniture Revenue Share (%), by Application 2025 & 2033
- Figure 30: Europe Custom Furniture Volume Share (%), by Application 2025 & 2033
- Figure 31: Europe Custom Furniture Revenue (undefined), by Types 2025 & 2033
- Figure 32: Europe Custom Furniture Volume (K), by Types 2025 & 2033
- Figure 33: Europe Custom Furniture Revenue Share (%), by Types 2025 & 2033
- Figure 34: Europe Custom Furniture Volume Share (%), by Types 2025 & 2033
- Figure 35: Europe Custom Furniture Revenue (undefined), by Country 2025 & 2033
- Figure 36: Europe Custom Furniture Volume (K), by Country 2025 & 2033
- Figure 37: Europe Custom Furniture Revenue Share (%), by Country 2025 & 2033
- Figure 38: Europe Custom Furniture Volume Share (%), by Country 2025 & 2033
- Figure 39: Middle East & Africa Custom Furniture Revenue (undefined), by Application 2025 & 2033
- Figure 40: Middle East & Africa Custom Furniture Volume (K), by Application 2025 & 2033
- Figure 41: Middle East & Africa Custom Furniture Revenue Share (%), by Application 2025 & 2033
- Figure 42: Middle East & Africa Custom Furniture Volume Share (%), by Application 2025 & 2033
- Figure 43: Middle East & Africa Custom Furniture Revenue (undefined), by Types 2025 & 2033
- Figure 44: Middle East & Africa Custom Furniture Volume (K), by Types 2025 & 2033
- Figure 45: Middle East & Africa Custom Furniture Revenue Share (%), by Types 2025 & 2033
- Figure 46: Middle East & Africa Custom Furniture Volume Share (%), by Types 2025 & 2033
- Figure 47: Middle East & Africa Custom Furniture Revenue (undefined), by Country 2025 & 2033
- Figure 48: Middle East & Africa Custom Furniture Volume (K), by Country 2025 & 2033
- Figure 49: Middle East & Africa Custom Furniture Revenue Share (%), by Country 2025 & 2033
- Figure 50: Middle East & Africa Custom Furniture Volume Share (%), by Country 2025 & 2033
- Figure 51: Asia Pacific Custom Furniture Revenue (undefined), by Application 2025 & 2033
- Figure 52: Asia Pacific Custom Furniture Volume (K), by Application 2025 & 2033
- Figure 53: Asia Pacific Custom Furniture Revenue Share (%), by Application 2025 & 2033
- Figure 54: Asia Pacific Custom Furniture Volume Share (%), by Application 2025 & 2033
- Figure 55: Asia Pacific Custom Furniture Revenue (undefined), by Types 2025 & 2033
- Figure 56: Asia Pacific Custom Furniture Volume (K), by Types 2025 & 2033
- Figure 57: Asia Pacific Custom Furniture Revenue Share (%), by Types 2025 & 2033
- Figure 58: Asia Pacific Custom Furniture Volume Share (%), by Types 2025 & 2033
- Figure 59: Asia Pacific Custom Furniture Revenue (undefined), by Country 2025 & 2033
- Figure 60: Asia Pacific Custom Furniture Volume (K), by Country 2025 & 2033
- Figure 61: Asia Pacific Custom Furniture Revenue Share (%), by Country 2025 & 2033
- Figure 62: Asia Pacific Custom Furniture Volume Share (%), by Country 2025 & 2033
List of Tables
- Table 1: Global Custom Furniture Revenue undefined Forecast, by Application 2020 & 2033
- Table 2: Global Custom Furniture Volume K Forecast, by Application 2020 & 2033
- Table 3: Global Custom Furniture Revenue undefined Forecast, by Types 2020 & 2033
- Table 4: Global Custom Furniture Volume K Forecast, by Types 2020 & 2033
- Table 5: Global Custom Furniture Revenue undefined Forecast, by Region 2020 & 2033
- Table 6: Global Custom Furniture Volume K Forecast, by Region 2020 & 2033
- Table 7: Global Custom Furniture Revenue undefined Forecast, by Application 2020 & 2033
- Table 8: Global Custom Furniture Volume K Forecast, by Application 2020 & 2033
- Table 9: Global Custom Furniture Revenue undefined Forecast, by Types 2020 & 2033
- Table 10: Global Custom Furniture Volume K Forecast, by Types 2020 & 2033
- Table 11: Global Custom Furniture Revenue undefined Forecast, by Country 2020 & 2033
- Table 12: Global Custom Furniture Volume K Forecast, by Country 2020 & 2033
- Table 13: United States Custom Furniture Revenue (undefined) Forecast, by Application 2020 & 2033
- Table 14: United States Custom Furniture Volume (K) Forecast, by Application 2020 & 2033
- Table 15: Canada Custom Furniture Revenue (undefined) Forecast, by Application 2020 & 2033
- Table 16: Canada Custom Furniture Volume (K) Forecast, by Application 2020 & 2033
- Table 17: Mexico Custom Furniture Revenue (undefined) Forecast, by Application 2020 & 2033
- Table 18: Mexico Custom Furniture Volume (K) Forecast, by Application 2020 & 2033
- Table 19: Global Custom Furniture Revenue undefined Forecast, by Application 2020 & 2033
- Table 20: Global Custom Furniture Volume K Forecast, by Application 2020 & 2033
- Table 21: Global Custom Furniture Revenue undefined Forecast, by Types 2020 & 2033
- Table 22: Global Custom Furniture Volume K Forecast, by Types 2020 & 2033
- Table 23: Global Custom Furniture Revenue undefined Forecast, by Country 2020 & 2033
- Table 24: Global Custom Furniture Volume K Forecast, by Country 2020 & 2033
- Table 25: Brazil Custom Furniture Revenue (undefined) Forecast, by Application 2020 & 2033
- Table 26: Brazil Custom Furniture Volume (K) Forecast, by Application 2020 & 2033
- Table 27: Argentina Custom Furniture Revenue (undefined) Forecast, by Application 2020 & 2033
- Table 28: Argentina Custom Furniture Volume (K) Forecast, by Application 2020 & 2033
- Table 29: Rest of South America Custom Furniture Revenue (undefined) Forecast, by Application 2020 & 2033
- Table 30: Rest of South America Custom Furniture Volume (K) Forecast, by Application 2020 & 2033
- Table 31: Global Custom Furniture Revenue undefined Forecast, by Application 2020 & 2033
- Table 32: Global Custom Furniture Volume K Forecast, by Application 2020 & 2033
- Table 33: Global Custom Furniture Revenue undefined Forecast, by Types 2020 & 2033
- Table 34: Global Custom Furniture Volume K Forecast, by Types 2020 & 2033
- Table 35: Global Custom Furniture Revenue undefined Forecast, by Country 2020 & 2033
- Table 36: Global Custom Furniture Volume K Forecast, by Country 2020 & 2033
- Table 37: United Kingdom Custom Furniture Revenue (undefined) Forecast, by Application 2020 & 2033
- Table 38: United Kingdom Custom Furniture Volume (K) Forecast, by Application 2020 & 2033
- Table 39: Germany Custom Furniture Revenue (undefined) Forecast, by Application 2020 & 2033
- Table 40: Germany Custom Furniture Volume (K) Forecast, by Application 2020 & 2033
- Table 41: France Custom Furniture Revenue (undefined) Forecast, by Application 2020 & 2033
- Table 42: France Custom Furniture Volume (K) Forecast, by Application 2020 & 2033
- Table 43: Italy Custom Furniture Revenue (undefined) Forecast, by Application 2020 & 2033
- Table 44: Italy Custom Furniture Volume (K) Forecast, by Application 2020 & 2033
- Table 45: Spain Custom Furniture Revenue (undefined) Forecast, by Application 2020 & 2033
- Table 46: Spain Custom Furniture Volume (K) Forecast, by Application 2020 & 2033
- Table 47: Russia Custom Furniture Revenue (undefined) Forecast, by Application 2020 & 2033
- Table 48: Russia Custom Furniture Volume (K) Forecast, by Application 2020 & 2033
- Table 49: Benelux Custom Furniture Revenue (undefined) Forecast, by Application 2020 & 2033
- Table 50: Benelux Custom Furniture Volume (K) Forecast, by Application 2020 & 2033
- Table 51: Nordics Custom Furniture Revenue (undefined) Forecast, by Application 2020 & 2033
- Table 52: Nordics Custom Furniture Volume (K) Forecast, by Application 2020 & 2033
- Table 53: Rest of Europe Custom Furniture Revenue (undefined) Forecast, by Application 2020 & 2033
- Table 54: Rest of Europe Custom Furniture Volume (K) Forecast, by Application 2020 & 2033
- Table 55: Global Custom Furniture Revenue undefined Forecast, by Application 2020 & 2033
- Table 56: Global Custom Furniture Volume K Forecast, by Application 2020 & 2033
- Table 57: Global Custom Furniture Revenue undefined Forecast, by Types 2020 & 2033
- Table 58: Global Custom Furniture Volume K Forecast, by Types 2020 & 2033
- Table 59: Global Custom Furniture Revenue undefined Forecast, by Country 2020 & 2033
- Table 60: Global Custom Furniture Volume K Forecast, by Country 2020 & 2033
- Table 61: Turkey Custom Furniture Revenue (undefined) Forecast, by Application 2020 & 2033
- Table 62: Turkey Custom Furniture Volume (K) Forecast, by Application 2020 & 2033
- Table 63: Israel Custom Furniture Revenue (undefined) Forecast, by Application 2020 & 2033
- Table 64: Israel Custom Furniture Volume (K) Forecast, by Application 2020 & 2033
- Table 65: GCC Custom Furniture Revenue (undefined) Forecast, by Application 2020 & 2033
- Table 66: GCC Custom Furniture Volume (K) Forecast, by Application 2020 & 2033
- Table 67: North Africa Custom Furniture Revenue (undefined) Forecast, by Application 2020 & 2033
- Table 68: North Africa Custom Furniture Volume (K) Forecast, by Application 2020 & 2033
- Table 69: South Africa Custom Furniture Revenue (undefined) Forecast, by Application 2020 & 2033
- Table 70: South Africa Custom Furniture Volume (K) Forecast, by Application 2020 & 2033
- Table 71: Rest of Middle East & Africa Custom Furniture Revenue (undefined) Forecast, by Application 2020 & 2033
- Table 72: Rest of Middle East & Africa Custom Furniture Volume (K) Forecast, by Application 2020 & 2033
- Table 73: Global Custom Furniture Revenue undefined Forecast, by Application 2020 & 2033
- Table 74: Global Custom Furniture Volume K Forecast, by Application 2020 & 2033
- Table 75: Global Custom Furniture Revenue undefined Forecast, by Types 2020 & 2033
- Table 76: Global Custom Furniture Volume K Forecast, by Types 2020 & 2033
- Table 77: Global Custom Furniture Revenue undefined Forecast, by Country 2020 & 2033
- Table 78: Global Custom Furniture Volume K Forecast, by Country 2020 & 2033
- Table 79: China Custom Furniture Revenue (undefined) Forecast, by Application 2020 & 2033
- Table 80: China Custom Furniture Volume (K) Forecast, by Application 2020 & 2033
- Table 81: India Custom Furniture Revenue (undefined) Forecast, by Application 2020 & 2033
- Table 82: India Custom Furniture Volume (K) Forecast, by Application 2020 & 2033
- Table 83: Japan Custom Furniture Revenue (undefined) Forecast, by Application 2020 & 2033
- Table 84: Japan Custom Furniture Volume (K) Forecast, by Application 2020 & 2033
- Table 85: South Korea Custom Furniture Revenue (undefined) Forecast, by Application 2020 & 2033
- Table 86: South Korea Custom Furniture Volume (K) Forecast, by Application 2020 & 2033
- Table 87: ASEAN Custom Furniture Revenue (undefined) Forecast, by Application 2020 & 2033
- Table 88: ASEAN Custom Furniture Volume (K) Forecast, by Application 2020 & 2033
- Table 89: Oceania Custom Furniture Revenue (undefined) Forecast, by Application 2020 & 2033
- Table 90: Oceania Custom Furniture Volume (K) Forecast, by Application 2020 & 2033
- Table 91: Rest of Asia Pacific Custom Furniture Revenue (undefined) Forecast, by Application 2020 & 2033
- Table 92: Rest of Asia Pacific Custom Furniture Volume (K) Forecast, by Application 2020 & 2033
Frequently Asked Questions
1. What is the projected Compound Annual Growth Rate (CAGR) of the Custom Furniture?
The projected CAGR is approximately 6.8%.
2. Which companies are prominent players in the Custom Furniture?
Key companies in the market include Oppein Home Group Inc., GoldenHome Living Co., Ltd., Suofeiya Home Collection Co. Ltd., Guangzhou Holike Creative Home Co., Ltd, Guangzhou Shangpin Home Collection Co., Ltd, Zbom Home Collection Co., Ltd, Nanjing OLO Home Furnishing Co., Ltd., Guangdong Piano Customized Furniture Co., Ltd., Yihua Lifestyle Technology Co., Ltd..
3. What are the main segments of the Custom Furniture?
The market segments include Application, Types.
4. Can you provide details about the market size?
The market size is estimated to be USD XXX N/A as of 2022.
5. What are some drivers contributing to market growth?
N/A
6. What are the notable trends driving market growth?
N/A
7. Are there any restraints impacting market growth?
N/A
8. Can you provide examples of recent developments in the market?
N/A
9. What pricing options are available for accessing the report?
Pricing options include single-user, multi-user, and enterprise licenses priced at USD 3950.00, USD 5925.00, and USD 7900.00 respectively.
10. Is the market size provided in terms of value or volume?
The market size is provided in terms of value, measured in N/A and volume, measured in K.
11. Are there any specific market keywords associated with the report?
Yes, the market keyword associated with the report is "Custom Furniture," which aids in identifying and referencing the specific market segment covered.
12. How do I determine which pricing option suits my needs best?
The pricing options vary based on user requirements and access needs. Individual users may opt for single-user licenses, while businesses requiring broader access may choose multi-user or enterprise licenses for cost-effective access to the report.
13. Are there any additional resources or data provided in the Custom Furniture report?
While the report offers comprehensive insights, it's advisable to review the specific contents or supplementary materials provided to ascertain if additional resources or data are available.
14. How can I stay updated on further developments or reports in the Custom Furniture?
To stay informed about further developments, trends, and reports in the Custom Furniture, consider subscribing to industry newsletters, following relevant companies and organizations, or regularly checking reputable industry news sources and publications.
Methodology
Step 1 - Identification of Relevant Samples Size from Population Database


Step 2 - Approaches for Defining Global Market Size (Value, Volume* & Price*)

Note*: In applicable scenarios
Step 3 - Data Sources
Primary Research
- Web Analytics
- Survey Reports
- Research Institute
- Latest Research Reports
- Opinion Leaders
Secondary Research
- Annual Reports
- White Paper
- Latest Press Release
- Industry Association
- Paid Database
- Investor Presentations

Step 4 - Data Triangulation
Involves using different sources of information in order to increase the validity of a study
These sources are likely to be stakeholders in a program - participants, other researchers, program staff, other community members, and so on.
Then we put all data in single framework & apply various statistical tools to find out the dynamic on the market.
During the analysis stage, feedback from the stakeholder groups would be compared to determine areas of agreement as well as areas of divergence