

Key Insights
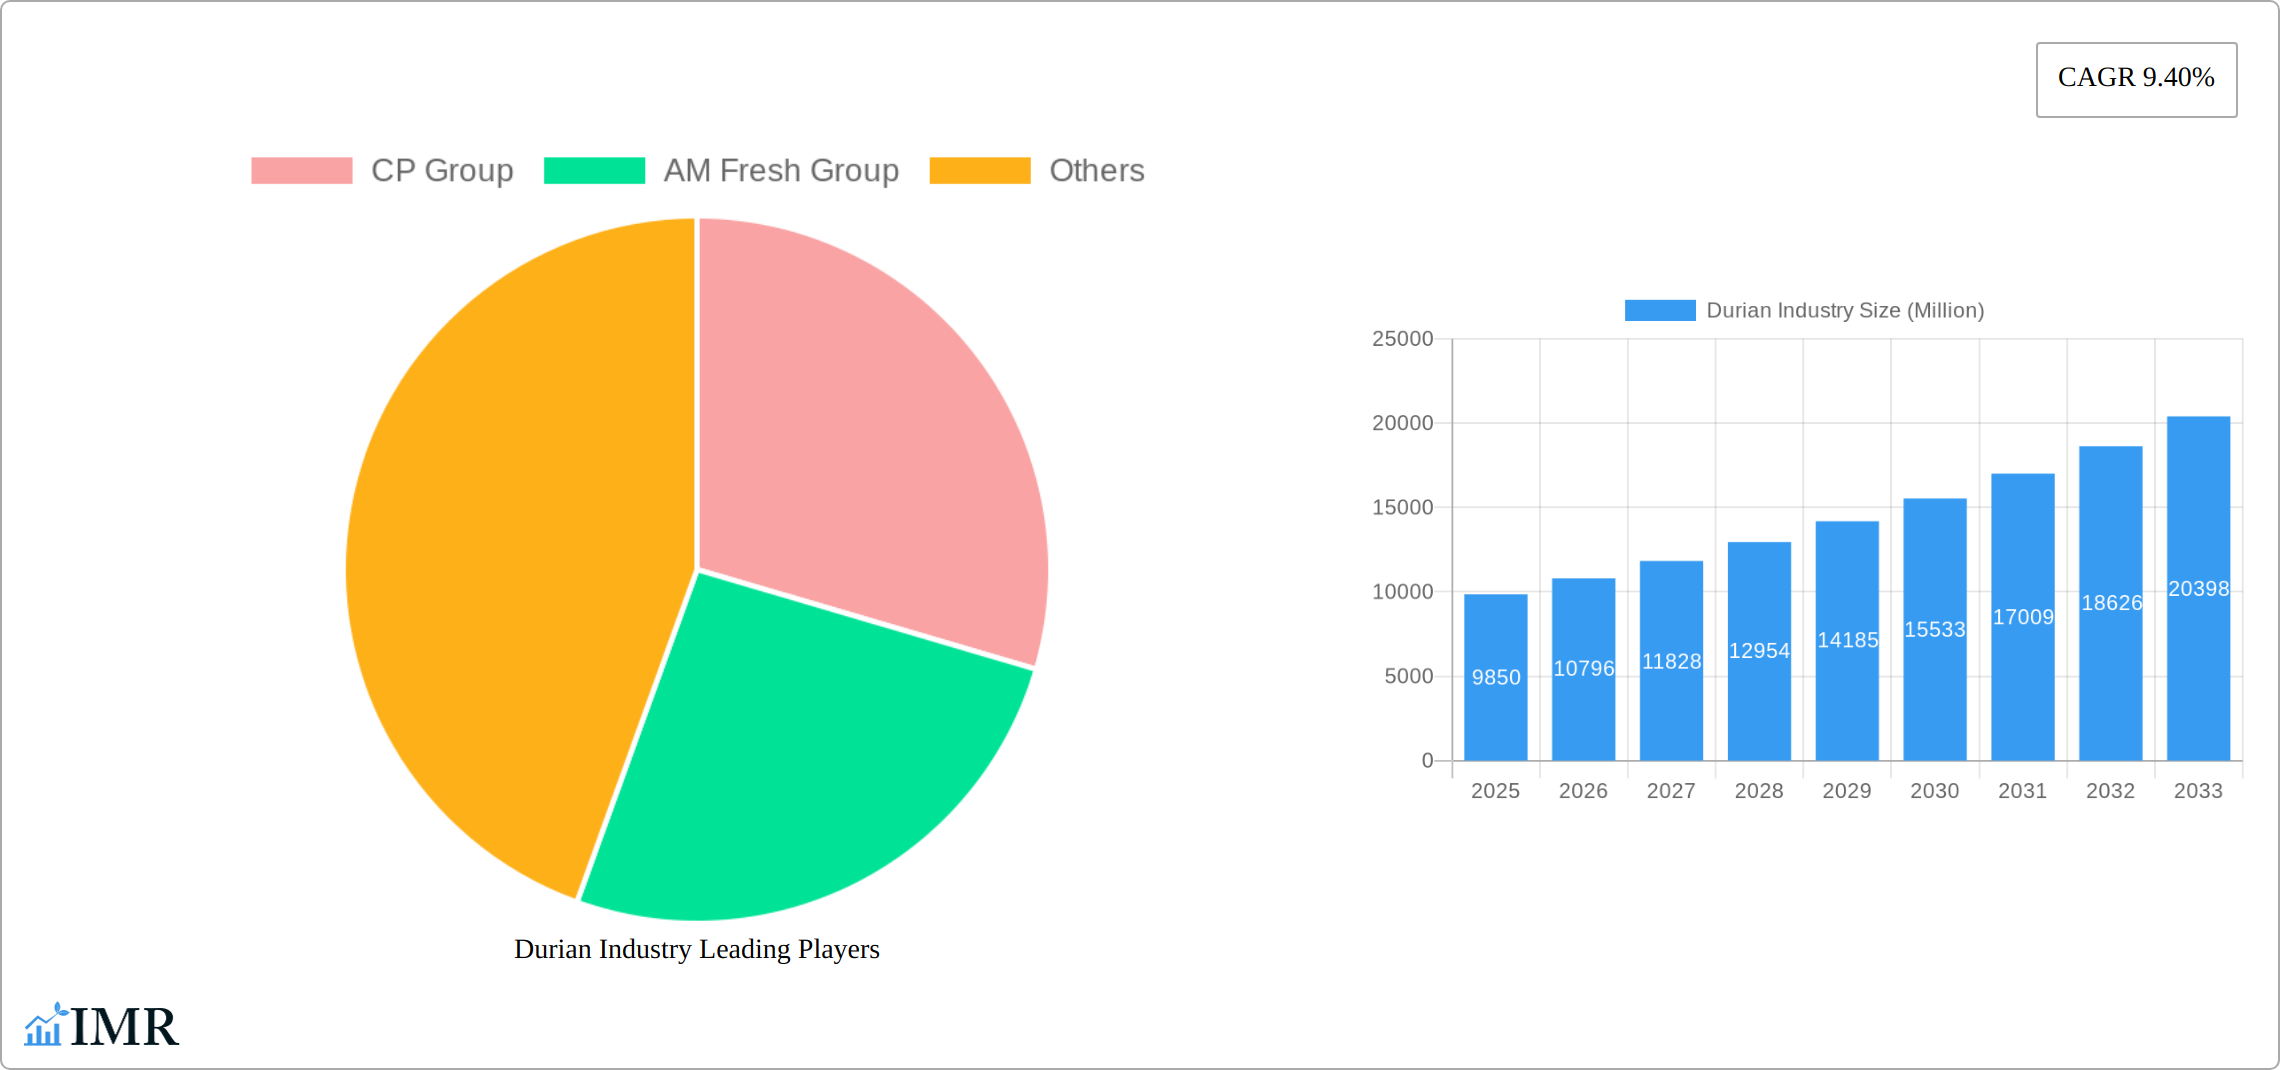
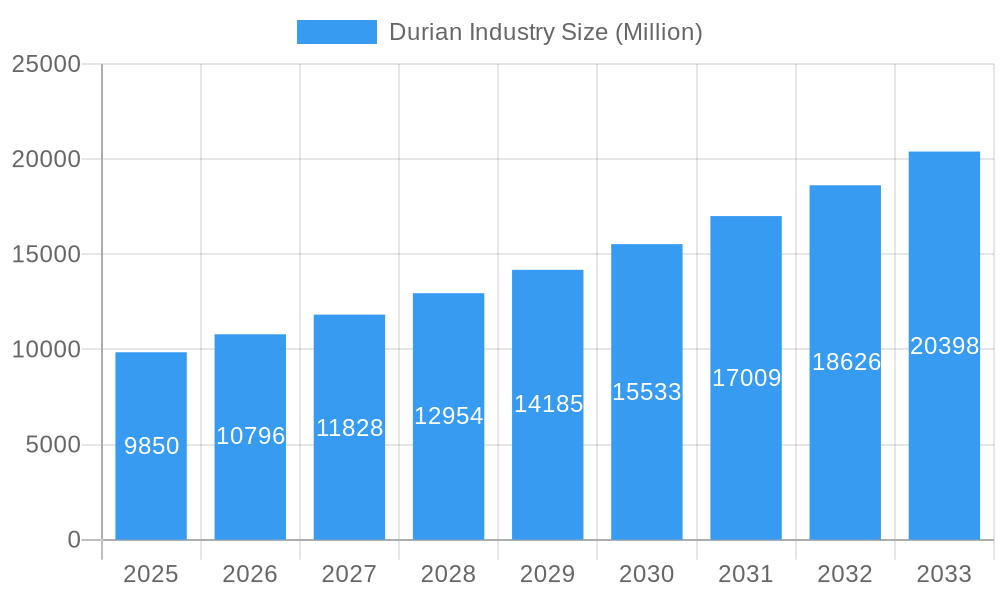
The global durian industry, valued at $9.85 billion in 2025, is experiencing robust growth, projected to expand at a compound annual growth rate (CAGR) of 9.40% from 2025 to 2033. This expansion is fueled by several key factors. Rising consumer demand for exotic fruits, particularly in developed markets, is a significant driver. The increasing popularity of durian in processed forms, such as ice cream, desserts, and even spreads, is broadening its appeal beyond its traditional consumer base. Furthermore, advancements in hybrid seed technology are improving durian yield and quality, contributing to increased supply. The growing food processing industry is also a significant factor, with manufacturers incorporating durian into a wider range of products. While challenges such as seasonality and the fruit's pungent odor remain, innovative preservation and packaging techniques are mitigating these constraints. The Asia-Pacific region, particularly Southeast Asia, remains the dominant market, driven by high domestic consumption and established production infrastructure. However, increasing global distribution networks and rising interest in international cuisine are fueling growth in North America and Europe.
Durian Industry Market Size (In Billion)
The industry segmentation reveals significant opportunities. The hybrid seed segment is experiencing strong growth, driven by increased productivity and consistent quality. Processed durian products are showing the fastest growth rate, benefiting from innovation in food processing and the expanding market for convenient and ready-to-eat foods. Household consumption remains the largest end-user segment, but the food service sector (restaurants and food processors) is demonstrating substantial growth potential. Key players like CP Group and AM Fresh Group are leveraging their expertise and supply chain networks to capture market share, while new entrants are focusing on niche markets and innovative product development. The forecast period (2025-2033) will likely witness consolidation among industry players, increased investment in research and development, and a greater focus on sustainable cultivation practices to ensure long-term growth.
Durian Industry Company Market Share
Durian Industry Market Report: 2019-2033
This comprehensive report provides a detailed analysis of the global durian industry, encompassing market dynamics, growth trends, regional dominance, product landscape, and future opportunities. With a focus on key players like CP Group and AM Fresh Group, and segments including hybrid seeds, fresh durian, and processed durian, this report is an invaluable resource for industry professionals, investors, and anyone seeking to understand this rapidly expanding market. The study period covers 2019-2033, with a base year of 2025 and a forecast period of 2025-2033.
Durian Industry Market Dynamics & Structure
The durian industry exhibits a moderately concentrated market structure, with several key players commanding substantial market share. Growth is significantly propelled by technological advancements, particularly in post-harvest technologies and processing innovations. Stringent regulatory frameworks, encompassing food safety standards and export regulations, heavily influence market operations and trade. While no perfect substitutes replicate durian's distinctive flavor profile, alternative fruits present indirect competition within the broader fruit market. The end-user base is broadening, fueled by increased demand from both households and the food service industry (restaurants, food processors, etc.). Mergers and acquisitions (M&A) activity within the industry shows moderate levels, with [Number] deals recorded between 2019 and 2024, predominantly focused on expanding production capabilities and market penetration. The competitive landscape is further shaped by factors such as pricing strategies, brand recognition, and supply chain efficiency.
- Market Concentration: Moderately concentrated, with the top 5 players holding approximately [Percentage]% of the market share (2024). This concentration is expected to [Increase/Decrease/Remain relatively stable] in the coming years.
- Technological Innovation: Focus areas include improved cold chain logistics, AI-driven quality control systems, efficient processing techniques (e.g., freeze-drying, pasteurization), and innovative packaging solutions to extend shelf life.
- Regulatory Frameworks: Stringent food safety regulations and export standards, including traceability and residue limits, significantly impact production practices and international trade. Compliance with these regulations is crucial for market access.
- Competitive Substitutes: While lacking direct substitutes, the industry faces indirect competition from other high-value fruits offering similar textural or aromatic profiles depending on the consumer segment.
- End-User Demographics: A growing middle class in key Asian markets and increased disposable income are driving household consumption. Simultaneously, the food service sector's demand for durian-based ingredients and ready-to-eat products is expanding rapidly.
- M&A Trends: Moderate activity (with [Number] deals from 2019-2024) suggests consolidation and expansion strategies, driven by the desire for enhanced market access, economies of scale, and diversification of product offerings.
Durian Industry Growth Trends & Insights
The global durian market displayed strong growth between 2019 and 2024, fueled by increasing consumer demand, especially in Asian countries. Market size expanded from [Number] million units in 2019 to [Number] million units in 2024, exhibiting a Compound Annual Growth Rate (CAGR) of [Percentage]%. Technological improvements in cultivation, processing, and preservation have enhanced both product quality and supply chain efficiency, leading to greater market penetration. Consumer preferences are shifting towards premium, convenient, and value-added durian products. The projected period (2025-2033) anticipates continued market expansion, though at a slightly reduced pace, as global demand increases and product diversification strategies are implemented. The market is expected to reach [Number] million units by 2033, with a projected CAGR of [Percentage]%. This growth is driven by increasing awareness of durian's nutritional benefits and the introduction of innovative durian-based food and beverage items.
Dominant Regions, Countries, or Segments in Durian Industry
Southeast Asia, specifically Thailand, Malaysia, and Vietnam, maintains its dominance in the durian industry, accounting for approximately [Percentage]% of global production in 2024. Thailand retains the largest market share due to advantageous climatic conditions and well-established cultivation techniques. Within the market segments, fresh durian continues to hold the largest share, followed by processed durian products (e.g., durian puree, paste, ice cream) and durian seedlings/hybrid seeds. The robust growth in processed durian underscores the rising consumer demand for convenient and longer-shelf-life options. The household sector remains the primary end-user group, followed by food processors and the restaurant/food service segment.
Key Drivers:
- Favorable Climate: Southeast Asia's tropical climate offers optimal conditions for durian cultivation.
- Established Infrastructure: Existing supply chains and processing facilities contribute to efficient market operations and export capabilities.
- Government Support: Government initiatives in key durian-producing countries play a vital role in supporting the industry's growth through export promotion, research funding, and infrastructure development.
- High Consumer Demand: Growing popularity of durian as a premium fruit, coupled with expanding consumer awareness of its nutritional benefits, is a significant driver of market growth.
Thailand's Dominance: Thailand's leading position is reinforced by its robust agricultural sector, advanced export infrastructure, and supportive government policies.
Vietnam's Growth Potential: Vietnam's investments in developing durian cultivation areas and improving packaging and processing facilities indicate significant future growth potential.
Durian Industry Product Landscape
The durian industry is witnessing product innovation across various segments. New product developments focus on extending shelf life through advanced processing techniques, creating convenient forms like frozen durian pulp and ready-to-eat products, and developing value-added products like durian-flavored snacks and desserts. The focus is on enhancing convenience, improving sensory appeal, and broadening product applications. Technological advancements, including improved cold storage and AI-powered quality assessment, further enhance product quality and consistency.
Key Drivers, Barriers & Challenges in Durian Industry
Key Drivers: Rising consumer demand in both domestic and export markets, favorable climate conditions in key growing regions, technological advancements improving cultivation, processing and preservation techniques, and government support promoting the industry are key drivers. The expanding middle class in Asia is fueling increased consumption.
Key Challenges: Maintaining consistent durian quality, managing seasonal supply fluctuations, addressing perishable nature, and navigating stringent regulatory requirements for food safety and export are major challenges. Supply chain inefficiencies, including post-harvest losses and limited cold storage infrastructure, pose significant barriers. The strong odor of durian presents both a barrier to wider adoption and an opportunity for product innovation.
Emerging Opportunities in Durian Industry
Untapped markets in Europe, North America, and parts of Asia present significant growth opportunities. Developing value-added durian products targeting specific consumer preferences, such as health-conscious consumers or those seeking novel culinary experiences, represent a fertile ground for innovation. Exploring new applications of durian in food and beverage products beyond traditional consumption patterns can drive market expansion.
Growth Accelerators in the Durian Industry Industry
Strategic partnerships between producers, processors, and retailers are streamlining supply chains and increasing market access. Technological advancements in cultivation, particularly in hybrid seed development and precision agriculture, are boosting productivity and efficiency. Government initiatives promoting durian exports and investment in research and development are crucial catalysts for long-term growth.
Key Players Shaping the Durian Industry Market
- CP Group
- AM Fresh Group
- [Add other key players]
Notable Milestones in Durian Industry Sector
- April 2024: Thailand aims for an 8% increase in durian exports, addressing cold storage shortages and promoting best cultivation practices.
- January 2023: CP Group utilizes AI-powered quality inspection systems to enhance durian quality.
- November 2022: Vietnam invests in establishing durian growing areas and packaging facilities for export to China.
- September 2022: Launch of "snow-skinned" durian mooncakes in China, signifying market expansion efforts.
In-Depth Durian Industry Market Outlook
The durian industry is projected to experience sustained growth, propelled by rising consumer demand, technological innovations enhancing both quality and efficiency, and increasing access to global markets. Strategic investments in research and development, focusing on sustainable cultivation practices and improved post-harvest handling, are crucial for long-term market sustainability. Key opportunities lie in developing high-value-added products, expanding into new consumer markets (both geographically and demographically), and optimizing supply chain efficiency to reduce waste and enhance product quality and freshness. The industry's future success hinges on adapting to evolving consumer preferences, navigating regulatory landscapes, and embracing sustainable agricultural practices.
Durian Industry Segmentation
- 1. Production Analysis
- 2. Consumption Analysis
- 3. Import Market Analysis (Value & Volume)
- 4. Export Market Analysis (Value & Volume)
- 5. Price Trend Analysis
Durian Industry Segmentation By Geography
-
1. North America
- 1.1. United States
- 1.2. Canada
-
2. Europe
- 2.1. Netherlands
- 2.2. France
- 2.3. United Kingdom
- 2.4. Italy
- 2.5. Germany
-
3. Asia Pacific
- 3.1. China
- 3.2. Thailand
- 3.3. Malaysia
- 3.4. Philippines
- 3.5. Japan
-
4. Middle East and Africa
- 4.1. United Arab Emirates
- 4.2. Saudi Arabia
- 4.3. South Africa
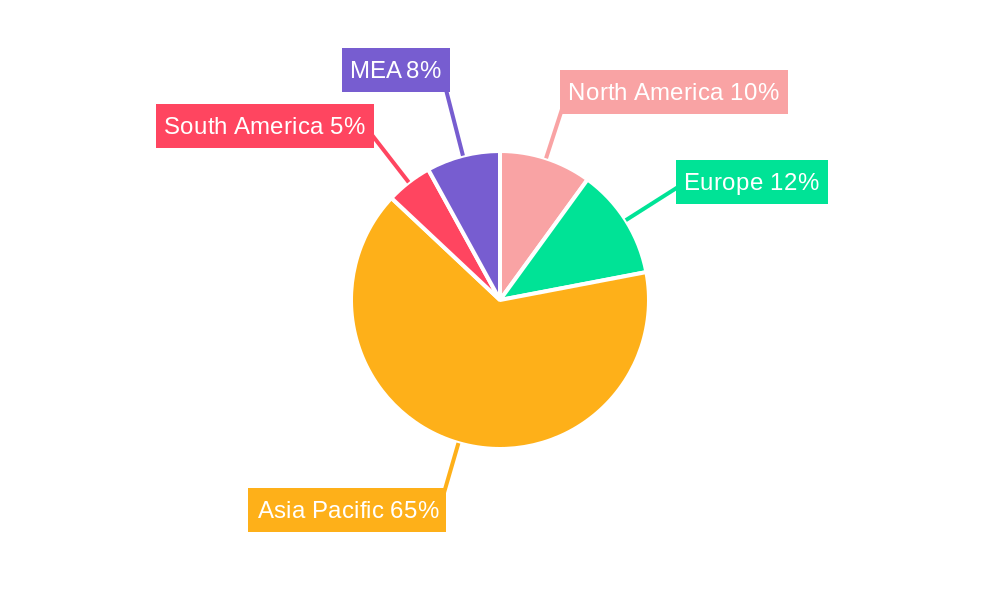
Durian Industry Regional Market Share
Geographic Coverage of Durian Industry
Durian Industry REPORT HIGHLIGHTS
| Aspects | Details |
|---|---|
| Study Period | 2020-2034 |
| Base Year | 2025 |
| Estimated Year | 2026 |
| Forecast Period | 2026-2034 |
| Historical Period | 2020-2025 |
| Growth Rate | CAGR of 9.40% from 2020-2034 |
| Segmentation |
|
Table of Contents
- 1. Introduction
- 1.1. Research Scope
- 1.2. Market Segmentation
- 1.3. Research Objective
- 1.4. Definitions and Assumptions
- 2. Executive Summary
- 2.1. Market Snapshot
- 3. Market Dynamics
- 3.1. Market Drivers
- 3.2. Market Restrains
- 3.3. Market Trends
- 3.4. Market Opportunities
- 4. Market Factor Analysis
- 4.1. Porters Five Forces
- 4.1.1. Bargaining Power of Suppliers
- 4.1.2. Bargaining Power of Buyers
- 4.1.3. Threat of New Entrants
- 4.1.4. Threat of Substitutes
- 4.1.5. Competitive Rivalry
- 4.2. PESTEL analysis
- 4.3. BCG Analysis
- 4.3.1. Stars (High Growth, High Market Share)
- 4.3.2. Cash Cows (Low Growth, High Market Share)
- 4.3.3. Question Mark (High Growth, Low Market Share)
- 4.3.4. Dogs (Low Growth, Low Market Share)
- 4.4. Ansoff Matrix Analysis
- 4.5. Supply Chain Analysis
- 4.6. Regulatory Landscape
- 4.7. Current Market Potential and Opportunity Assessment (TAM–SAM–SOM Framework)
- 4.8. IMR Analyst Note
- 4.1. Porters Five Forces
- 5. Market Analysis, Insights and Forecast 2021-2033
- 5.1. Market Analysis, Insights and Forecast - by Production Analysis
- 5.2. Market Analysis, Insights and Forecast - by Consumption Analysis
- 5.3. Market Analysis, Insights and Forecast - by Import Market Analysis (Value & Volume)
- 5.4. Market Analysis, Insights and Forecast - by Export Market Analysis (Value & Volume)
- 5.5. Market Analysis, Insights and Forecast - by Price Trend Analysis
- 5.6. Market Analysis, Insights and Forecast - by Region
- 5.6.1. North America
- 5.6.2. Europe
- 5.6.3. Asia Pacific
- 5.6.4. Middle East and Africa
- 6. Global Durian Industry Analysis, Insights and Forecast, 2021-2033
- 6.1. Market Analysis, Insights and Forecast - by Production Analysis
- 6.2. Market Analysis, Insights and Forecast - by Consumption Analysis
- 6.3. Market Analysis, Insights and Forecast - by Import Market Analysis (Value & Volume)
- 6.4. Market Analysis, Insights and Forecast - by Export Market Analysis (Value & Volume)
- 6.5. Market Analysis, Insights and Forecast - by Price Trend Analysis
- 7. North America Durian Industry Analysis, Insights and Forecast, 2020-2032
- 7.1. Market Analysis, Insights and Forecast - by Production Analysis
- 7.2. Market Analysis, Insights and Forecast - by Consumption Analysis
- 7.3. Market Analysis, Insights and Forecast - by Import Market Analysis (Value & Volume)
- 7.4. Market Analysis, Insights and Forecast - by Export Market Analysis (Value & Volume)
- 7.5. Market Analysis, Insights and Forecast - by Price Trend Analysis
- 8. Europe Durian Industry Analysis, Insights and Forecast, 2020-2032
- 8.1. Market Analysis, Insights and Forecast - by Production Analysis
- 8.2. Market Analysis, Insights and Forecast - by Consumption Analysis
- 8.3. Market Analysis, Insights and Forecast - by Import Market Analysis (Value & Volume)
- 8.4. Market Analysis, Insights and Forecast - by Export Market Analysis (Value & Volume)
- 8.5. Market Analysis, Insights and Forecast - by Price Trend Analysis
- 9. Asia Pacific Durian Industry Analysis, Insights and Forecast, 2020-2032
- 9.1. Market Analysis, Insights and Forecast - by Production Analysis
- 9.2. Market Analysis, Insights and Forecast - by Consumption Analysis
- 9.3. Market Analysis, Insights and Forecast - by Import Market Analysis (Value & Volume)
- 9.4. Market Analysis, Insights and Forecast - by Export Market Analysis (Value & Volume)
- 9.5. Market Analysis, Insights and Forecast - by Price Trend Analysis
- 10. Middle East and Africa Durian Industry Analysis, Insights and Forecast, 2020-2032
- 10.1. Market Analysis, Insights and Forecast - by Production Analysis
- 10.2. Market Analysis, Insights and Forecast - by Consumption Analysis
- 10.3. Market Analysis, Insights and Forecast - by Import Market Analysis (Value & Volume)
- 10.4. Market Analysis, Insights and Forecast - by Export Market Analysis (Value & Volume)
- 10.5. Market Analysis, Insights and Forecast - by Price Trend Analysis
- 11. Competitive Analysis
- 11.1. Company Profiles
- 11.1.1 CP Group
- 11.1.1.1. Company Overview
- 11.1.1.2. Products
- 11.1.1.3. Company Financials
- 11.1.1.4. SWOT Analysis
- 11.1.2 AM Fresh Group
- 11.1.2.1. Company Overview
- 11.1.2.2. Products
- 11.1.2.3. Company Financials
- 11.1.2.4. SWOT Analysis
- 11.1.1 CP Group
- 11.2. Market Entropy
- 11.2.1 Company's Key Areas Served
- 11.2.2 Recent Developments
- 11.3. Company Market Share Analysis 2025
- 11.3.1 Top 5 Companies Market Share Analysis
- 11.3.2 Top 3 Companies Market Share Analysis
- 11.4. List of Potential Customers
- 12. Research Methodology
List of Figures
- Figure 1: Global Durian Industry Revenue Breakdown (Million, %) by Region 2025 & 2033
- Figure 2: North America Durian Industry Revenue (Million), by Production Analysis 2025 & 2033
- Figure 3: North America Durian Industry Revenue Share (%), by Production Analysis 2025 & 2033
- Figure 4: North America Durian Industry Revenue (Million), by Consumption Analysis 2025 & 2033
- Figure 5: North America Durian Industry Revenue Share (%), by Consumption Analysis 2025 & 2033
- Figure 6: North America Durian Industry Revenue (Million), by Import Market Analysis (Value & Volume) 2025 & 2033
- Figure 7: North America Durian Industry Revenue Share (%), by Import Market Analysis (Value & Volume) 2025 & 2033
- Figure 8: North America Durian Industry Revenue (Million), by Export Market Analysis (Value & Volume) 2025 & 2033
- Figure 9: North America Durian Industry Revenue Share (%), by Export Market Analysis (Value & Volume) 2025 & 2033
- Figure 10: North America Durian Industry Revenue (Million), by Price Trend Analysis 2025 & 2033
- Figure 11: North America Durian Industry Revenue Share (%), by Price Trend Analysis 2025 & 2033
- Figure 12: North America Durian Industry Revenue (Million), by Country 2025 & 2033
- Figure 13: North America Durian Industry Revenue Share (%), by Country 2025 & 2033
- Figure 14: Europe Durian Industry Revenue (Million), by Production Analysis 2025 & 2033
- Figure 15: Europe Durian Industry Revenue Share (%), by Production Analysis 2025 & 2033
- Figure 16: Europe Durian Industry Revenue (Million), by Consumption Analysis 2025 & 2033
- Figure 17: Europe Durian Industry Revenue Share (%), by Consumption Analysis 2025 & 2033
- Figure 18: Europe Durian Industry Revenue (Million), by Import Market Analysis (Value & Volume) 2025 & 2033
- Figure 19: Europe Durian Industry Revenue Share (%), by Import Market Analysis (Value & Volume) 2025 & 2033
- Figure 20: Europe Durian Industry Revenue (Million), by Export Market Analysis (Value & Volume) 2025 & 2033
- Figure 21: Europe Durian Industry Revenue Share (%), by Export Market Analysis (Value & Volume) 2025 & 2033
- Figure 22: Europe Durian Industry Revenue (Million), by Price Trend Analysis 2025 & 2033
- Figure 23: Europe Durian Industry Revenue Share (%), by Price Trend Analysis 2025 & 2033
- Figure 24: Europe Durian Industry Revenue (Million), by Country 2025 & 2033
- Figure 25: Europe Durian Industry Revenue Share (%), by Country 2025 & 2033
- Figure 26: Asia Pacific Durian Industry Revenue (Million), by Production Analysis 2025 & 2033
- Figure 27: Asia Pacific Durian Industry Revenue Share (%), by Production Analysis 2025 & 2033
- Figure 28: Asia Pacific Durian Industry Revenue (Million), by Consumption Analysis 2025 & 2033
- Figure 29: Asia Pacific Durian Industry Revenue Share (%), by Consumption Analysis 2025 & 2033
- Figure 30: Asia Pacific Durian Industry Revenue (Million), by Import Market Analysis (Value & Volume) 2025 & 2033
- Figure 31: Asia Pacific Durian Industry Revenue Share (%), by Import Market Analysis (Value & Volume) 2025 & 2033
- Figure 32: Asia Pacific Durian Industry Revenue (Million), by Export Market Analysis (Value & Volume) 2025 & 2033
- Figure 33: Asia Pacific Durian Industry Revenue Share (%), by Export Market Analysis (Value & Volume) 2025 & 2033
- Figure 34: Asia Pacific Durian Industry Revenue (Million), by Price Trend Analysis 2025 & 2033
- Figure 35: Asia Pacific Durian Industry Revenue Share (%), by Price Trend Analysis 2025 & 2033
- Figure 36: Asia Pacific Durian Industry Revenue (Million), by Country 2025 & 2033
- Figure 37: Asia Pacific Durian Industry Revenue Share (%), by Country 2025 & 2033
- Figure 38: Middle East and Africa Durian Industry Revenue (Million), by Production Analysis 2025 & 2033
- Figure 39: Middle East and Africa Durian Industry Revenue Share (%), by Production Analysis 2025 & 2033
- Figure 40: Middle East and Africa Durian Industry Revenue (Million), by Consumption Analysis 2025 & 2033
- Figure 41: Middle East and Africa Durian Industry Revenue Share (%), by Consumption Analysis 2025 & 2033
- Figure 42: Middle East and Africa Durian Industry Revenue (Million), by Import Market Analysis (Value & Volume) 2025 & 2033
- Figure 43: Middle East and Africa Durian Industry Revenue Share (%), by Import Market Analysis (Value & Volume) 2025 & 2033
- Figure 44: Middle East and Africa Durian Industry Revenue (Million), by Export Market Analysis (Value & Volume) 2025 & 2033
- Figure 45: Middle East and Africa Durian Industry Revenue Share (%), by Export Market Analysis (Value & Volume) 2025 & 2033
- Figure 46: Middle East and Africa Durian Industry Revenue (Million), by Price Trend Analysis 2025 & 2033
- Figure 47: Middle East and Africa Durian Industry Revenue Share (%), by Price Trend Analysis 2025 & 2033
- Figure 48: Middle East and Africa Durian Industry Revenue (Million), by Country 2025 & 2033
- Figure 49: Middle East and Africa Durian Industry Revenue Share (%), by Country 2025 & 2033
List of Tables
- Table 1: Global Durian Industry Revenue Million Forecast, by Production Analysis 2020 & 2033
- Table 2: Global Durian Industry Revenue Million Forecast, by Consumption Analysis 2020 & 2033
- Table 3: Global Durian Industry Revenue Million Forecast, by Import Market Analysis (Value & Volume) 2020 & 2033
- Table 4: Global Durian Industry Revenue Million Forecast, by Export Market Analysis (Value & Volume) 2020 & 2033
- Table 5: Global Durian Industry Revenue Million Forecast, by Price Trend Analysis 2020 & 2033
- Table 6: Global Durian Industry Revenue Million Forecast, by Region 2020 & 2033
- Table 7: Global Durian Industry Revenue Million Forecast, by Production Analysis 2020 & 2033
- Table 8: Global Durian Industry Revenue Million Forecast, by Consumption Analysis 2020 & 2033
- Table 9: Global Durian Industry Revenue Million Forecast, by Import Market Analysis (Value & Volume) 2020 & 2033
- Table 10: Global Durian Industry Revenue Million Forecast, by Export Market Analysis (Value & Volume) 2020 & 2033
- Table 11: Global Durian Industry Revenue Million Forecast, by Price Trend Analysis 2020 & 2033
- Table 12: Global Durian Industry Revenue Million Forecast, by Country 2020 & 2033
- Table 13: United States Durian Industry Revenue (Million) Forecast, by Application 2020 & 2033
- Table 14: Canada Durian Industry Revenue (Million) Forecast, by Application 2020 & 2033
- Table 15: Global Durian Industry Revenue Million Forecast, by Production Analysis 2020 & 2033
- Table 16: Global Durian Industry Revenue Million Forecast, by Consumption Analysis 2020 & 2033
- Table 17: Global Durian Industry Revenue Million Forecast, by Import Market Analysis (Value & Volume) 2020 & 2033
- Table 18: Global Durian Industry Revenue Million Forecast, by Export Market Analysis (Value & Volume) 2020 & 2033
- Table 19: Global Durian Industry Revenue Million Forecast, by Price Trend Analysis 2020 & 2033
- Table 20: Global Durian Industry Revenue Million Forecast, by Country 2020 & 2033
- Table 21: Netherlands Durian Industry Revenue (Million) Forecast, by Application 2020 & 2033
- Table 22: France Durian Industry Revenue (Million) Forecast, by Application 2020 & 2033
- Table 23: United Kingdom Durian Industry Revenue (Million) Forecast, by Application 2020 & 2033
- Table 24: Italy Durian Industry Revenue (Million) Forecast, by Application 2020 & 2033
- Table 25: Germany Durian Industry Revenue (Million) Forecast, by Application 2020 & 2033
- Table 26: Global Durian Industry Revenue Million Forecast, by Production Analysis 2020 & 2033
- Table 27: Global Durian Industry Revenue Million Forecast, by Consumption Analysis 2020 & 2033
- Table 28: Global Durian Industry Revenue Million Forecast, by Import Market Analysis (Value & Volume) 2020 & 2033
- Table 29: Global Durian Industry Revenue Million Forecast, by Export Market Analysis (Value & Volume) 2020 & 2033
- Table 30: Global Durian Industry Revenue Million Forecast, by Price Trend Analysis 2020 & 2033
- Table 31: Global Durian Industry Revenue Million Forecast, by Country 2020 & 2033
- Table 32: China Durian Industry Revenue (Million) Forecast, by Application 2020 & 2033
- Table 33: Thailand Durian Industry Revenue (Million) Forecast, by Application 2020 & 2033
- Table 34: Malaysia Durian Industry Revenue (Million) Forecast, by Application 2020 & 2033
- Table 35: Philippines Durian Industry Revenue (Million) Forecast, by Application 2020 & 2033
- Table 36: Japan Durian Industry Revenue (Million) Forecast, by Application 2020 & 2033
- Table 37: Global Durian Industry Revenue Million Forecast, by Production Analysis 2020 & 2033
- Table 38: Global Durian Industry Revenue Million Forecast, by Consumption Analysis 2020 & 2033
- Table 39: Global Durian Industry Revenue Million Forecast, by Import Market Analysis (Value & Volume) 2020 & 2033
- Table 40: Global Durian Industry Revenue Million Forecast, by Export Market Analysis (Value & Volume) 2020 & 2033
- Table 41: Global Durian Industry Revenue Million Forecast, by Price Trend Analysis 2020 & 2033
- Table 42: Global Durian Industry Revenue Million Forecast, by Country 2020 & 2033
- Table 43: United Arab Emirates Durian Industry Revenue (Million) Forecast, by Application 2020 & 2033
- Table 44: Saudi Arabia Durian Industry Revenue (Million) Forecast, by Application 2020 & 2033
- Table 45: South Africa Durian Industry Revenue (Million) Forecast, by Application 2020 & 2033
Frequently Asked Questions
1. What is the projected Compound Annual Growth Rate (CAGR) of the Durian Industry?
The projected CAGR is approximately 9.40%.
2. Which companies are prominent players in the Durian Industry?
Key companies in the market include CP Group, AM Fresh Group.
3. What are the main segments of the Durian Industry?
The market segments include Production Analysis, Consumption Analysis, Import Market Analysis (Value & Volume), Export Market Analysis (Value & Volume), Price Trend Analysis.
4. Can you provide details about the market size?
The market size is estimated to be USD 9.85 Million as of 2022.
5. What are some drivers contributing to market growth?
Increasing Demand for Garlic Due to Various Uses in Industries; Rising Demad of Organic Garlic; Increasing Government Initiatives.
6. What are the notable trends driving market growth?
Expanding Trade Market for Durians.
7. Are there any restraints impacting market growth?
Lack of Technical Knowledge of Farmers; Price Fluctuations.
8. Can you provide examples of recent developments in the market?
April 2024: The Prime Minister of Thailand stated that they are taking necessary actions, such as focusing on shortages in cold storage, and also requested officials to ensure proper cultural practices are followed in durian cultivation by targeting an 8% increase in exports for the year.
9. What pricing options are available for accessing the report?
Pricing options include single-user, multi-user, and enterprise licenses priced at USD 4750, USD 5250, and USD 8750 respectively.
10. Is the market size provided in terms of value or volume?
The market size is provided in terms of value, measured in Million.
11. Are there any specific market keywords associated with the report?
Yes, the market keyword associated with the report is "Durian Industry," which aids in identifying and referencing the specific market segment covered.
12. How do I determine which pricing option suits my needs best?
The pricing options vary based on user requirements and access needs. Individual users may opt for single-user licenses, while businesses requiring broader access may choose multi-user or enterprise licenses for cost-effective access to the report.
13. Are there any additional resources or data provided in the Durian Industry report?
While the report offers comprehensive insights, it's advisable to review the specific contents or supplementary materials provided to ascertain if additional resources or data are available.
14. How can I stay updated on further developments or reports in the Durian Industry?
To stay informed about further developments, trends, and reports in the Durian Industry, consider subscribing to industry newsletters, following relevant companies and organizations, or regularly checking reputable industry news sources and publications.
Methodology
Step 1 - Identification of Relevant Samples Size from Population Database


Step 2 - Approaches for Defining Global Market Size (Value, Volume* & Price*)

Note*: In applicable scenarios
Step 3 - Data Sources
Primary Research
- Web Analytics
- Survey Reports
- Research Institute
- Latest Research Reports
- Opinion Leaders
Secondary Research
- Annual Reports
- White Paper
- Latest Press Release
- Industry Association
- Paid Database
- Investor Presentations

Step 4 - Data Triangulation
Involves using different sources of information in order to increase the validity of a study
These sources are likely to be stakeholders in a program - participants, other researchers, program staff, other community members, and so on.
Then we put all data in single framework & apply various statistical tools to find out the dynamic on the market.
During the analysis stage, feedback from the stakeholder groups would be compared to determine areas of agreement as well as areas of divergence