

Key Insights
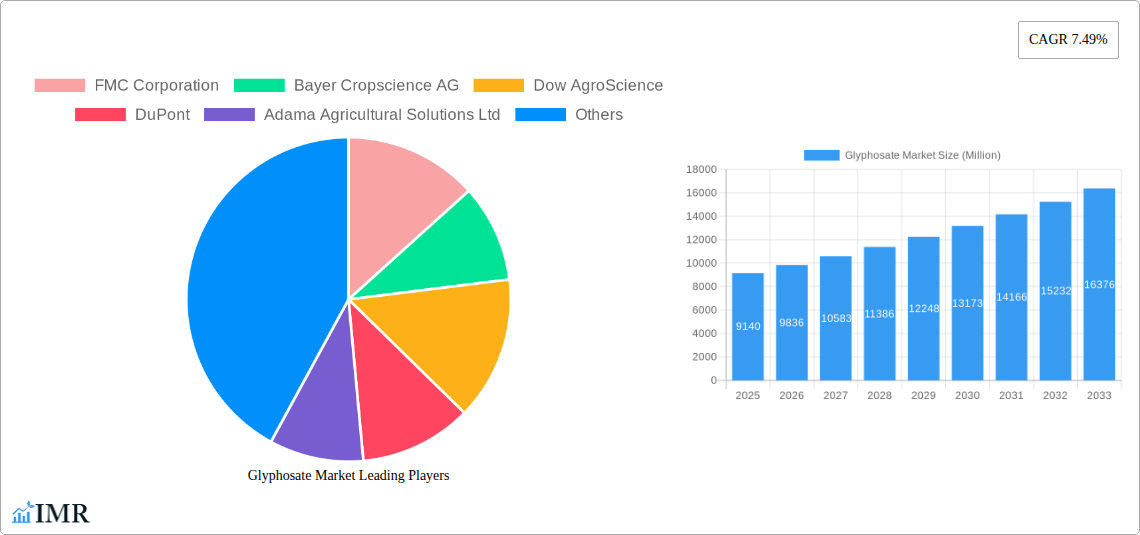
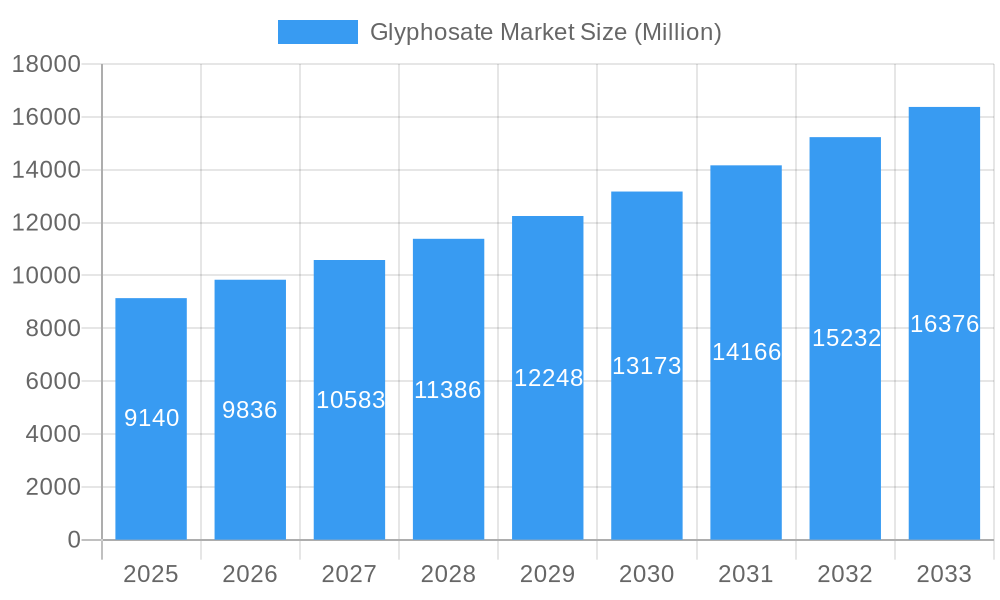
The global glyphosate market, valued at $9.14 billion in 2025, is projected to experience robust growth, driven by the increasing demand for high-yield crops and the persistent need for effective weed control in agriculture. The market's Compound Annual Growth Rate (CAGR) of 7.49% from 2025 to 2033 reflects a steady increase in herbicide usage across various crops, including grains and cereals, pulses and oilseeds, and fruits and vegetables. Key drivers include rising global food demand, expanding agricultural land under cultivation, and the growing adoption of genetically modified (GM) crops engineered for glyphosate tolerance. However, stringent regulations concerning glyphosate usage and environmental concerns regarding its impact on biodiversity and human health pose significant restraints. The market is segmented by crop type (GM and non-GM) and application, with grains and cereals currently dominating the application segment due to their widespread cultivation and vulnerability to weed infestation. Leading companies like Bayer Cropscience AG, FMC Corporation, and Syngenta International are major players, competing through technological advancements, strategic partnerships, and expanding their geographic reach. Regional growth is expected to be diverse, with Asia Pacific and North America exhibiting substantial growth due to intensive agricultural practices and expanding arable land.
Glyphosate Market Market Size (In Billion)
The forecast period from 2025 to 2033 indicates continued growth, albeit with some moderation as stricter regulations are implemented and alternative weed management techniques gain traction. Despite these constraints, the fundamental need for effective and cost-efficient weed control solutions will likely sustain the market’s expansion. The shift towards sustainable agricultural practices and the development of less environmentally impactful herbicides will influence market dynamics in the coming years. Furthermore, innovation in formulation technologies and the development of glyphosate-resistant weed management strategies will shape the competitive landscape and overall market trajectory. Continued monitoring of regulatory landscapes and consumer preferences will be crucial for market participants to maintain a strong position in this dynamic sector.
Glyphosate Market Company Market Share
Glyphosate Market: A Comprehensive Report (2019-2033)
This in-depth report provides a comprehensive analysis of the Glyphosate market, encompassing market dynamics, growth trends, regional segmentation, product landscape, key players, and future outlook. The study period covers 2019-2033, with a base year of 2025 and a forecast period of 2025-2033. The report is essential for industry professionals, investors, and researchers seeking to understand and capitalize on opportunities within this dynamic market. The parent market is the herbicide market, while the child market is the glyphosate-based herbicide segment. Total market value in 2025 is estimated at xx Million.
Glyphosate Market Dynamics & Structure
This section analyzes the Glyphosate market's structure, including concentration, technological innovation, regulatory landscapes, competitive substitutes, end-user demographics, and M&A activity. The market is moderately concentrated, with several major players controlling significant market share. Technological innovation focuses on enhancing glyphosate efficacy and developing resistance management strategies. Regulatory frameworks vary across regions, impacting market access and product development. Competitive substitutes include other herbicides, impacting glyphosate's market share, estimated at xx% in 2025. End-users primarily include farmers across various crop types.
- Market Concentration: Moderately concentrated, with top 5 players holding xx% of market share in 2025.
- Technological Innovation: Focus on improving efficacy, reducing environmental impact, and developing herbicide-resistant crop varieties.
- Regulatory Landscape: Stringent regulations in certain regions, leading to variations in product availability and usage.
- Competitive Substitutes: Other herbicides pose a significant competitive threat, impacting overall glyphosate demand.
- M&A Activity: xx M&A deals recorded between 2019 and 2024, indicating a consolidating market. Deal value totaled approximately xx Million.
Glyphosate Market Growth Trends & Insights
The Glyphosate market exhibits consistent growth, driven by increasing global food demand and the widespread adoption of glyphosate in various agricultural applications. The market size experienced a CAGR of xx% during the historical period (2019-2024), reaching xx Million in 2024. This growth is projected to continue, with a forecasted CAGR of xx% from 2025 to 2033, reaching an estimated xx Million by 2033. Market penetration is currently at xx%, with significant potential for further expansion in developing regions. Technological advancements, such as the development of glyphosate-tolerant crops and improved formulation technologies, are key growth drivers. Consumer preferences towards higher crop yields and efficient weed management contribute to the increased adoption rate.
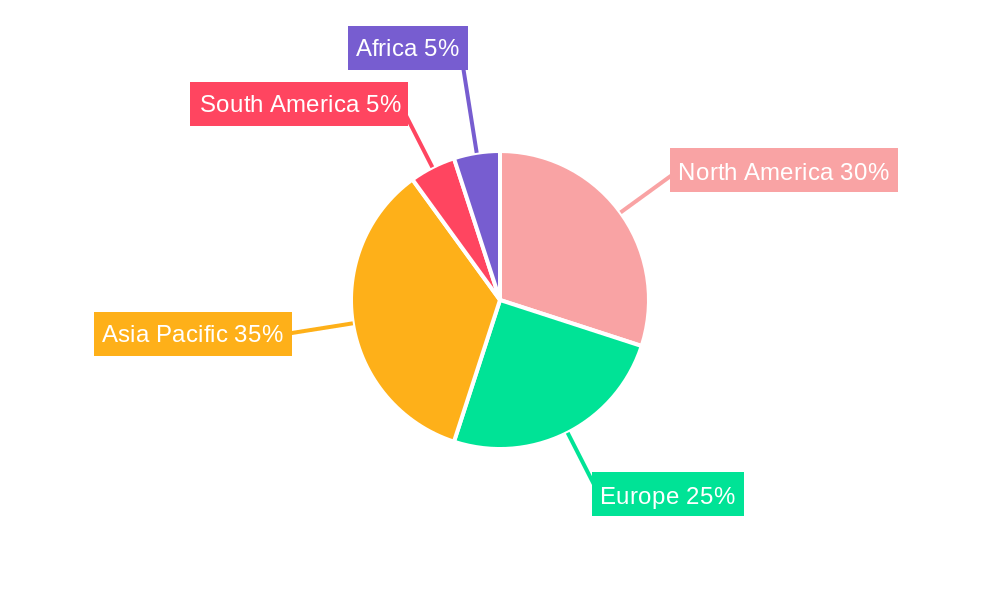
Dominant Regions, Countries, or Segments in Glyphosate Market
The North American and South American regions dominate the Glyphosate market, fueled by large-scale agricultural activities and the extensive adoption of GM crops. Within these regions, the United States and Brazil are the leading countries, characterized by high crop acreage and favorable regulatory environments. In terms of segments, the Grains and Cereals application holds the largest market share, followed by Pulses and Oilseeds.
- Dominant Region: North America, driven by high GM crop adoption and extensive agricultural practices.
- Leading Countries: United States and Brazil, owing to vast agricultural land and extensive glyphosate usage.
- Largest Segment (Application): Grains and Cereals, due to widespread glyphosate application in wheat, corn, and other cereal crops.
- Fastest Growing Segment (Type): Non-GM Crops, driven by increasing demand in developing nations.
Glyphosate Market Product Landscape
Glyphosate products are available in various formulations, including liquid concentrates, water-soluble granules, and dry flowables. Recent innovations focus on improving spray application, reducing drift, and enhancing weed control efficacy. Key features include enhanced formulation stability, improved weed control spectrum, and reduced environmental impact. The unique selling propositions include cost-effectiveness, broad-spectrum weed control, and ease of application. Technological advancements concentrate on improving the formulation's resistance to low temperatures and increasing efficacy.
Key Drivers, Barriers & Challenges in Glyphosate Market
Key Drivers:
- Rising global food demand and increased agricultural production.
- Widespread adoption of glyphosate-tolerant crops.
- Cost-effectiveness compared to other herbicides.
- Ease of application and broad-spectrum weed control.
Challenges & Restraints:
- Growing concerns regarding glyphosate's environmental impact and potential health risks.
- Increasing regulatory scrutiny and restrictions on glyphosate use in several regions.
- Development of glyphosate-resistant weeds, requiring alternative weed management strategies.
- Fluctuations in raw material prices impacting overall cost and profitability.
Emerging Opportunities in Glyphosate Market
- Expansion into untapped markets in developing countries.
- Development of new formulations to address weed resistance and environmental concerns.
- Growth of the bio-based glyphosate market, promoting sustainable agriculture.
- Increased demand for precision application technologies to optimize glyphosate usage and reduce environmental impact.
Growth Accelerators in the Glyphosate Market Industry
Technological advancements in formulation and application technologies are major growth catalysts. Strategic partnerships and collaborations between leading chemical companies are fostering innovation and market expansion. The development of glyphosate-tolerant crops continues to fuel demand. Growth is further accelerated by the expansion into new geographic markets and the development of effective weed resistance management strategies.
Key Players Shaping the Glyphosate Market Market
- FMC Corporation
- Bayer Cropscience AG
- Dow AgroScience
- DuPont
- Adama Agricultural Solutions Ltd
- Nufarm Limited
- Zhejiang Xinan Chemical Industrial Group Company Ltd
- UPL Limited
- Syngenta International
- BASF SE
Notable Milestones in Glyphosate Market Sector
- January 2021: Syngenta launched Kesuda, a glyphosate product with improved low-temperature stability and weed control efficacy in the Chinese market.
- August 2022: BASF and Corteva Agriscience collaborated to develop new soybean weed control solutions, including glyphosate-tolerant traits.
In-Depth Glyphosate Market Market Outlook
The Glyphosate market is poised for continued growth, driven by technological advancements, strategic partnerships, and increasing global food demand. Opportunities lie in developing sustainable and environmentally friendly formulations, expanding into new geographic markets, and addressing weed resistance challenges. Strategic investments in R&D and effective regulatory compliance will be critical for long-term success in this competitive market.
Glyphosate Market Segmentation
-
1. Type
- 1.1. GM Crops
- 1.2. Non-GM Crops
-
2. Application
- 2.1. Grains and Cereals
- 2.2. Pulses and Oilseeds
- 2.3. Fruits and Vegetables
- 2.4. Commercial Crops
- 2.5. Other Crop Types
-
3. Type
- 3.1. GM Crops
- 3.2. Non-GM Crops
-
4. Application
- 4.1. Grains and Cereals
- 4.2. Pulses and Oilseeds
- 4.3. Fruits and Vegetables
- 4.4. Commercial Crops
- 4.5. Other Crop Types
Glyphosate Market Segmentation By Geography
-
1. North America
- 1.1. United States
- 1.2. Canada
- 1.3. Mexico
- 1.4. Rest of North America
-
2. Europe
- 2.1. Spain
- 2.2. Italy
- 2.3. France
- 2.4. Germany
- 2.5. Russia
- 2.6. United Kingdom
- 2.7. Rest of Europe
-
3. Asia Pacific
- 3.1. India
- 3.2. China
- 3.3. Japan
- 3.4. Australia
- 3.5. Rest of Asia Pacific
-
4. South America
- 4.1. Brazil
- 4.2. Argentina
- 4.3. Rest of South America
-
5. Africa
- 5.1. South Africa
- 5.2. Rest of Africa
Glyphosate Market Regional Market Share
Geographic Coverage of Glyphosate Market
Glyphosate Market REPORT HIGHLIGHTS
| Aspects | Details |
|---|---|
| Study Period | 2020-2034 |
| Base Year | 2025 |
| Estimated Year | 2026 |
| Forecast Period | 2026-2034 |
| Historical Period | 2020-2025 |
| Growth Rate | CAGR of 7.49% from 2020-2034 |
| Segmentation |
|
Table of Contents
- 1. Introduction
- 1.1. Research Scope
- 1.2. Market Segmentation
- 1.3. Research Objective
- 1.4. Definitions and Assumptions
- 2. Executive Summary
- 2.1. Market Snapshot
- 3. Market Dynamics
- 3.1. Market Drivers
- 3.2. Market Restrains
- 3.3. Market Trends
- 3.4. Market Opportunities
- 4. Market Factor Analysis
- 4.1. Porters Five Forces
- 4.1.1. Bargaining Power of Suppliers
- 4.1.2. Bargaining Power of Buyers
- 4.1.3. Threat of New Entrants
- 4.1.4. Threat of Substitutes
- 4.1.5. Competitive Rivalry
- 4.2. PESTEL analysis
- 4.3. BCG Analysis
- 4.3.1. Stars (High Growth, High Market Share)
- 4.3.2. Cash Cows (Low Growth, High Market Share)
- 4.3.3. Question Mark (High Growth, Low Market Share)
- 4.3.4. Dogs (Low Growth, Low Market Share)
- 4.4. Ansoff Matrix Analysis
- 4.5. Supply Chain Analysis
- 4.6. Regulatory Landscape
- 4.7. Current Market Potential and Opportunity Assessment (TAM–SAM–SOM Framework)
- 4.8. IMR Analyst Note
- 4.1. Porters Five Forces
- 5. Market Analysis, Insights and Forecast 2021-2033
- 5.1. Market Analysis, Insights and Forecast - by Type
- 5.1.1. GM Crops
- 5.1.2. Non-GM Crops
- 5.2. Market Analysis, Insights and Forecast - by Application
- 5.2.1. Grains and Cereals
- 5.2.2. Pulses and Oilseeds
- 5.2.3. Fruits and Vegetables
- 5.2.4. Commercial Crops
- 5.2.5. Other Crop Types
- 5.3. Market Analysis, Insights and Forecast - by Type
- 5.3.1. GM Crops
- 5.3.2. Non-GM Crops
- 5.4. Market Analysis, Insights and Forecast - by Application
- 5.4.1. Grains and Cereals
- 5.4.2. Pulses and Oilseeds
- 5.4.3. Fruits and Vegetables
- 5.4.4. Commercial Crops
- 5.4.5. Other Crop Types
- 5.5. Market Analysis, Insights and Forecast - by Region
- 5.5.1. North America
- 5.5.2. Europe
- 5.5.3. Asia Pacific
- 5.5.4. South America
- 5.5.5. Africa
- 5.1. Market Analysis, Insights and Forecast - by Type
- 6. Global Glyphosate Market Analysis, Insights and Forecast, 2021-2033
- 6.1. Market Analysis, Insights and Forecast - by Type
- 6.1.1. GM Crops
- 6.1.2. Non-GM Crops
- 6.2. Market Analysis, Insights and Forecast - by Application
- 6.2.1. Grains and Cereals
- 6.2.2. Pulses and Oilseeds
- 6.2.3. Fruits and Vegetables
- 6.2.4. Commercial Crops
- 6.2.5. Other Crop Types
- 6.3. Market Analysis, Insights and Forecast - by Type
- 6.3.1. GM Crops
- 6.3.2. Non-GM Crops
- 6.4. Market Analysis, Insights and Forecast - by Application
- 6.4.1. Grains and Cereals
- 6.4.2. Pulses and Oilseeds
- 6.4.3. Fruits and Vegetables
- 6.4.4. Commercial Crops
- 6.4.5. Other Crop Types
- 6.1. Market Analysis, Insights and Forecast - by Type
- 7. North America Glyphosate Market Analysis, Insights and Forecast, 2020-2032
- 7.1. Market Analysis, Insights and Forecast - by Type
- 7.1.1. GM Crops
- 7.1.2. Non-GM Crops
- 7.2. Market Analysis, Insights and Forecast - by Application
- 7.2.1. Grains and Cereals
- 7.2.2. Pulses and Oilseeds
- 7.2.3. Fruits and Vegetables
- 7.2.4. Commercial Crops
- 7.2.5. Other Crop Types
- 7.3. Market Analysis, Insights and Forecast - by Type
- 7.3.1. GM Crops
- 7.3.2. Non-GM Crops
- 7.4. Market Analysis, Insights and Forecast - by Application
- 7.4.1. Grains and Cereals
- 7.4.2. Pulses and Oilseeds
- 7.4.3. Fruits and Vegetables
- 7.4.4. Commercial Crops
- 7.4.5. Other Crop Types
- 7.1. Market Analysis, Insights and Forecast - by Type
- 8. Europe Glyphosate Market Analysis, Insights and Forecast, 2020-2032
- 8.1. Market Analysis, Insights and Forecast - by Type
- 8.1.1. GM Crops
- 8.1.2. Non-GM Crops
- 8.2. Market Analysis, Insights and Forecast - by Application
- 8.2.1. Grains and Cereals
- 8.2.2. Pulses and Oilseeds
- 8.2.3. Fruits and Vegetables
- 8.2.4. Commercial Crops
- 8.2.5. Other Crop Types
- 8.3. Market Analysis, Insights and Forecast - by Type
- 8.3.1. GM Crops
- 8.3.2. Non-GM Crops
- 8.4. Market Analysis, Insights and Forecast - by Application
- 8.4.1. Grains and Cereals
- 8.4.2. Pulses and Oilseeds
- 8.4.3. Fruits and Vegetables
- 8.4.4. Commercial Crops
- 8.4.5. Other Crop Types
- 8.1. Market Analysis, Insights and Forecast - by Type
- 9. Asia Pacific Glyphosate Market Analysis, Insights and Forecast, 2020-2032
- 9.1. Market Analysis, Insights and Forecast - by Type
- 9.1.1. GM Crops
- 9.1.2. Non-GM Crops
- 9.2. Market Analysis, Insights and Forecast - by Application
- 9.2.1. Grains and Cereals
- 9.2.2. Pulses and Oilseeds
- 9.2.3. Fruits and Vegetables
- 9.2.4. Commercial Crops
- 9.2.5. Other Crop Types
- 9.3. Market Analysis, Insights and Forecast - by Type
- 9.3.1. GM Crops
- 9.3.2. Non-GM Crops
- 9.4. Market Analysis, Insights and Forecast - by Application
- 9.4.1. Grains and Cereals
- 9.4.2. Pulses and Oilseeds
- 9.4.3. Fruits and Vegetables
- 9.4.4. Commercial Crops
- 9.4.5. Other Crop Types
- 9.1. Market Analysis, Insights and Forecast - by Type
- 10. South America Glyphosate Market Analysis, Insights and Forecast, 2020-2032
- 10.1. Market Analysis, Insights and Forecast - by Type
- 10.1.1. GM Crops
- 10.1.2. Non-GM Crops
- 10.2. Market Analysis, Insights and Forecast - by Application
- 10.2.1. Grains and Cereals
- 10.2.2. Pulses and Oilseeds
- 10.2.3. Fruits and Vegetables
- 10.2.4. Commercial Crops
- 10.2.5. Other Crop Types
- 10.3. Market Analysis, Insights and Forecast - by Type
- 10.3.1. GM Crops
- 10.3.2. Non-GM Crops
- 10.4. Market Analysis, Insights and Forecast - by Application
- 10.4.1. Grains and Cereals
- 10.4.2. Pulses and Oilseeds
- 10.4.3. Fruits and Vegetables
- 10.4.4. Commercial Crops
- 10.4.5. Other Crop Types
- 10.1. Market Analysis, Insights and Forecast - by Type
- 11. Africa Glyphosate Market Analysis, Insights and Forecast, 2020-2032
- 11.1. Market Analysis, Insights and Forecast - by Type
- 11.1.1. GM Crops
- 11.1.2. Non-GM Crops
- 11.2. Market Analysis, Insights and Forecast - by Application
- 11.2.1. Grains and Cereals
- 11.2.2. Pulses and Oilseeds
- 11.2.3. Fruits and Vegetables
- 11.2.4. Commercial Crops
- 11.2.5. Other Crop Types
- 11.3. Market Analysis, Insights and Forecast - by Type
- 11.3.1. GM Crops
- 11.3.2. Non-GM Crops
- 11.4. Market Analysis, Insights and Forecast - by Application
- 11.4.1. Grains and Cereals
- 11.4.2. Pulses and Oilseeds
- 11.4.3. Fruits and Vegetables
- 11.4.4. Commercial Crops
- 11.4.5. Other Crop Types
- 11.1. Market Analysis, Insights and Forecast - by Type
- 12. Competitive Analysis
- 12.1. Company Profiles
- 12.1.1 FMC Corporation
- 12.1.1.1. Company Overview
- 12.1.1.2. Products
- 12.1.1.3. Company Financials
- 12.1.1.4. SWOT Analysis
- 12.1.2 Bayer Cropscience AG
- 12.1.2.1. Company Overview
- 12.1.2.2. Products
- 12.1.2.3. Company Financials
- 12.1.2.4. SWOT Analysis
- 12.1.3 Dow AgroScience
- 12.1.3.1. Company Overview
- 12.1.3.2. Products
- 12.1.3.3. Company Financials
- 12.1.3.4. SWOT Analysis
- 12.1.4 DuPont
- 12.1.4.1. Company Overview
- 12.1.4.2. Products
- 12.1.4.3. Company Financials
- 12.1.4.4. SWOT Analysis
- 12.1.5 Adama Agricultural Solutions Ltd
- 12.1.5.1. Company Overview
- 12.1.5.2. Products
- 12.1.5.3. Company Financials
- 12.1.5.4. SWOT Analysis
- 12.1.6 Nufarm Limited
- 12.1.6.1. Company Overview
- 12.1.6.2. Products
- 12.1.6.3. Company Financials
- 12.1.6.4. SWOT Analysis
- 12.1.7 Zhejiang Xinan Chemical Industrial Group Company Ltd
- 12.1.7.1. Company Overview
- 12.1.7.2. Products
- 12.1.7.3. Company Financials
- 12.1.7.4. SWOT Analysis
- 12.1.8 UPL Limited
- 12.1.8.1. Company Overview
- 12.1.8.2. Products
- 12.1.8.3. Company Financials
- 12.1.8.4. SWOT Analysis
- 12.1.9 Syngenta International
- 12.1.9.1. Company Overview
- 12.1.9.2. Products
- 12.1.9.3. Company Financials
- 12.1.9.4. SWOT Analysis
- 12.1.10 BASF SE
- 12.1.10.1. Company Overview
- 12.1.10.2. Products
- 12.1.10.3. Company Financials
- 12.1.10.4. SWOT Analysis
- 12.1.1 FMC Corporation
- 12.2. Market Entropy
- 12.2.1 Company's Key Areas Served
- 12.2.2 Recent Developments
- 12.3. Company Market Share Analysis 2025
- 12.3.1 Top 5 Companies Market Share Analysis
- 12.3.2 Top 3 Companies Market Share Analysis
- 12.4. List of Potential Customers
- 13. Research Methodology
List of Figures
- Figure 1: Global Glyphosate Market Revenue Breakdown (Million, %) by Region 2025 & 2033
- Figure 2: Global Glyphosate Market Volume Breakdown (Kiloton, %) by Region 2025 & 2033
- Figure 3: North America Glyphosate Market Revenue (Million), by Type 2025 & 2033
- Figure 4: North America Glyphosate Market Volume (Kiloton), by Type 2025 & 2033
- Figure 5: North America Glyphosate Market Revenue Share (%), by Type 2025 & 2033
- Figure 6: North America Glyphosate Market Volume Share (%), by Type 2025 & 2033
- Figure 7: North America Glyphosate Market Revenue (Million), by Application 2025 & 2033
- Figure 8: North America Glyphosate Market Volume (Kiloton), by Application 2025 & 2033
- Figure 9: North America Glyphosate Market Revenue Share (%), by Application 2025 & 2033
- Figure 10: North America Glyphosate Market Volume Share (%), by Application 2025 & 2033
- Figure 11: North America Glyphosate Market Revenue (Million), by Type 2025 & 2033
- Figure 12: North America Glyphosate Market Volume (Kiloton), by Type 2025 & 2033
- Figure 13: North America Glyphosate Market Revenue Share (%), by Type 2025 & 2033
- Figure 14: North America Glyphosate Market Volume Share (%), by Type 2025 & 2033
- Figure 15: North America Glyphosate Market Revenue (Million), by Application 2025 & 2033
- Figure 16: North America Glyphosate Market Volume (Kiloton), by Application 2025 & 2033
- Figure 17: North America Glyphosate Market Revenue Share (%), by Application 2025 & 2033
- Figure 18: North America Glyphosate Market Volume Share (%), by Application 2025 & 2033
- Figure 19: North America Glyphosate Market Revenue (Million), by Country 2025 & 2033
- Figure 20: North America Glyphosate Market Volume (Kiloton), by Country 2025 & 2033
- Figure 21: North America Glyphosate Market Revenue Share (%), by Country 2025 & 2033
- Figure 22: North America Glyphosate Market Volume Share (%), by Country 2025 & 2033
- Figure 23: Europe Glyphosate Market Revenue (Million), by Type 2025 & 2033
- Figure 24: Europe Glyphosate Market Volume (Kiloton), by Type 2025 & 2033
- Figure 25: Europe Glyphosate Market Revenue Share (%), by Type 2025 & 2033
- Figure 26: Europe Glyphosate Market Volume Share (%), by Type 2025 & 2033
- Figure 27: Europe Glyphosate Market Revenue (Million), by Application 2025 & 2033
- Figure 28: Europe Glyphosate Market Volume (Kiloton), by Application 2025 & 2033
- Figure 29: Europe Glyphosate Market Revenue Share (%), by Application 2025 & 2033
- Figure 30: Europe Glyphosate Market Volume Share (%), by Application 2025 & 2033
- Figure 31: Europe Glyphosate Market Revenue (Million), by Type 2025 & 2033
- Figure 32: Europe Glyphosate Market Volume (Kiloton), by Type 2025 & 2033
- Figure 33: Europe Glyphosate Market Revenue Share (%), by Type 2025 & 2033
- Figure 34: Europe Glyphosate Market Volume Share (%), by Type 2025 & 2033
- Figure 35: Europe Glyphosate Market Revenue (Million), by Application 2025 & 2033
- Figure 36: Europe Glyphosate Market Volume (Kiloton), by Application 2025 & 2033
- Figure 37: Europe Glyphosate Market Revenue Share (%), by Application 2025 & 2033
- Figure 38: Europe Glyphosate Market Volume Share (%), by Application 2025 & 2033
- Figure 39: Europe Glyphosate Market Revenue (Million), by Country 2025 & 2033
- Figure 40: Europe Glyphosate Market Volume (Kiloton), by Country 2025 & 2033
- Figure 41: Europe Glyphosate Market Revenue Share (%), by Country 2025 & 2033
- Figure 42: Europe Glyphosate Market Volume Share (%), by Country 2025 & 2033
- Figure 43: Asia Pacific Glyphosate Market Revenue (Million), by Type 2025 & 2033
- Figure 44: Asia Pacific Glyphosate Market Volume (Kiloton), by Type 2025 & 2033
- Figure 45: Asia Pacific Glyphosate Market Revenue Share (%), by Type 2025 & 2033
- Figure 46: Asia Pacific Glyphosate Market Volume Share (%), by Type 2025 & 2033
- Figure 47: Asia Pacific Glyphosate Market Revenue (Million), by Application 2025 & 2033
- Figure 48: Asia Pacific Glyphosate Market Volume (Kiloton), by Application 2025 & 2033
- Figure 49: Asia Pacific Glyphosate Market Revenue Share (%), by Application 2025 & 2033
- Figure 50: Asia Pacific Glyphosate Market Volume Share (%), by Application 2025 & 2033
- Figure 51: Asia Pacific Glyphosate Market Revenue (Million), by Type 2025 & 2033
- Figure 52: Asia Pacific Glyphosate Market Volume (Kiloton), by Type 2025 & 2033
- Figure 53: Asia Pacific Glyphosate Market Revenue Share (%), by Type 2025 & 2033
- Figure 54: Asia Pacific Glyphosate Market Volume Share (%), by Type 2025 & 2033
- Figure 55: Asia Pacific Glyphosate Market Revenue (Million), by Application 2025 & 2033
- Figure 56: Asia Pacific Glyphosate Market Volume (Kiloton), by Application 2025 & 2033
- Figure 57: Asia Pacific Glyphosate Market Revenue Share (%), by Application 2025 & 2033
- Figure 58: Asia Pacific Glyphosate Market Volume Share (%), by Application 2025 & 2033
- Figure 59: Asia Pacific Glyphosate Market Revenue (Million), by Country 2025 & 2033
- Figure 60: Asia Pacific Glyphosate Market Volume (Kiloton), by Country 2025 & 2033
- Figure 61: Asia Pacific Glyphosate Market Revenue Share (%), by Country 2025 & 2033
- Figure 62: Asia Pacific Glyphosate Market Volume Share (%), by Country 2025 & 2033
- Figure 63: South America Glyphosate Market Revenue (Million), by Type 2025 & 2033
- Figure 64: South America Glyphosate Market Volume (Kiloton), by Type 2025 & 2033
- Figure 65: South America Glyphosate Market Revenue Share (%), by Type 2025 & 2033
- Figure 66: South America Glyphosate Market Volume Share (%), by Type 2025 & 2033
- Figure 67: South America Glyphosate Market Revenue (Million), by Application 2025 & 2033
- Figure 68: South America Glyphosate Market Volume (Kiloton), by Application 2025 & 2033
- Figure 69: South America Glyphosate Market Revenue Share (%), by Application 2025 & 2033
- Figure 70: South America Glyphosate Market Volume Share (%), by Application 2025 & 2033
- Figure 71: South America Glyphosate Market Revenue (Million), by Type 2025 & 2033
- Figure 72: South America Glyphosate Market Volume (Kiloton), by Type 2025 & 2033
- Figure 73: South America Glyphosate Market Revenue Share (%), by Type 2025 & 2033
- Figure 74: South America Glyphosate Market Volume Share (%), by Type 2025 & 2033
- Figure 75: South America Glyphosate Market Revenue (Million), by Application 2025 & 2033
- Figure 76: South America Glyphosate Market Volume (Kiloton), by Application 2025 & 2033
- Figure 77: South America Glyphosate Market Revenue Share (%), by Application 2025 & 2033
- Figure 78: South America Glyphosate Market Volume Share (%), by Application 2025 & 2033
- Figure 79: South America Glyphosate Market Revenue (Million), by Country 2025 & 2033
- Figure 80: South America Glyphosate Market Volume (Kiloton), by Country 2025 & 2033
- Figure 81: South America Glyphosate Market Revenue Share (%), by Country 2025 & 2033
- Figure 82: South America Glyphosate Market Volume Share (%), by Country 2025 & 2033
- Figure 83: Africa Glyphosate Market Revenue (Million), by Type 2025 & 2033
- Figure 84: Africa Glyphosate Market Volume (Kiloton), by Type 2025 & 2033
- Figure 85: Africa Glyphosate Market Revenue Share (%), by Type 2025 & 2033
- Figure 86: Africa Glyphosate Market Volume Share (%), by Type 2025 & 2033
- Figure 87: Africa Glyphosate Market Revenue (Million), by Application 2025 & 2033
- Figure 88: Africa Glyphosate Market Volume (Kiloton), by Application 2025 & 2033
- Figure 89: Africa Glyphosate Market Revenue Share (%), by Application 2025 & 2033
- Figure 90: Africa Glyphosate Market Volume Share (%), by Application 2025 & 2033
- Figure 91: Africa Glyphosate Market Revenue (Million), by Type 2025 & 2033
- Figure 92: Africa Glyphosate Market Volume (Kiloton), by Type 2025 & 2033
- Figure 93: Africa Glyphosate Market Revenue Share (%), by Type 2025 & 2033
- Figure 94: Africa Glyphosate Market Volume Share (%), by Type 2025 & 2033
- Figure 95: Africa Glyphosate Market Revenue (Million), by Application 2025 & 2033
- Figure 96: Africa Glyphosate Market Volume (Kiloton), by Application 2025 & 2033
- Figure 97: Africa Glyphosate Market Revenue Share (%), by Application 2025 & 2033
- Figure 98: Africa Glyphosate Market Volume Share (%), by Application 2025 & 2033
- Figure 99: Africa Glyphosate Market Revenue (Million), by Country 2025 & 2033
- Figure 100: Africa Glyphosate Market Volume (Kiloton), by Country 2025 & 2033
- Figure 101: Africa Glyphosate Market Revenue Share (%), by Country 2025 & 2033
- Figure 102: Africa Glyphosate Market Volume Share (%), by Country 2025 & 2033
List of Tables
- Table 1: Global Glyphosate Market Revenue Million Forecast, by Type 2020 & 2033
- Table 2: Global Glyphosate Market Volume Kiloton Forecast, by Type 2020 & 2033
- Table 3: Global Glyphosate Market Revenue Million Forecast, by Application 2020 & 2033
- Table 4: Global Glyphosate Market Volume Kiloton Forecast, by Application 2020 & 2033
- Table 5: Global Glyphosate Market Revenue Million Forecast, by Type 2020 & 2033
- Table 6: Global Glyphosate Market Volume Kiloton Forecast, by Type 2020 & 2033
- Table 7: Global Glyphosate Market Revenue Million Forecast, by Application 2020 & 2033
- Table 8: Global Glyphosate Market Volume Kiloton Forecast, by Application 2020 & 2033
- Table 9: Global Glyphosate Market Revenue Million Forecast, by Region 2020 & 2033
- Table 10: Global Glyphosate Market Volume Kiloton Forecast, by Region 2020 & 2033
- Table 11: Global Glyphosate Market Revenue Million Forecast, by Type 2020 & 2033
- Table 12: Global Glyphosate Market Volume Kiloton Forecast, by Type 2020 & 2033
- Table 13: Global Glyphosate Market Revenue Million Forecast, by Application 2020 & 2033
- Table 14: Global Glyphosate Market Volume Kiloton Forecast, by Application 2020 & 2033
- Table 15: Global Glyphosate Market Revenue Million Forecast, by Type 2020 & 2033
- Table 16: Global Glyphosate Market Volume Kiloton Forecast, by Type 2020 & 2033
- Table 17: Global Glyphosate Market Revenue Million Forecast, by Application 2020 & 2033
- Table 18: Global Glyphosate Market Volume Kiloton Forecast, by Application 2020 & 2033
- Table 19: Global Glyphosate Market Revenue Million Forecast, by Country 2020 & 2033
- Table 20: Global Glyphosate Market Volume Kiloton Forecast, by Country 2020 & 2033
- Table 21: United States Glyphosate Market Revenue (Million) Forecast, by Application 2020 & 2033
- Table 22: United States Glyphosate Market Volume (Kiloton) Forecast, by Application 2020 & 2033
- Table 23: Canada Glyphosate Market Revenue (Million) Forecast, by Application 2020 & 2033
- Table 24: Canada Glyphosate Market Volume (Kiloton) Forecast, by Application 2020 & 2033
- Table 25: Mexico Glyphosate Market Revenue (Million) Forecast, by Application 2020 & 2033
- Table 26: Mexico Glyphosate Market Volume (Kiloton) Forecast, by Application 2020 & 2033
- Table 27: Rest of North America Glyphosate Market Revenue (Million) Forecast, by Application 2020 & 2033
- Table 28: Rest of North America Glyphosate Market Volume (Kiloton) Forecast, by Application 2020 & 2033
- Table 29: Global Glyphosate Market Revenue Million Forecast, by Type 2020 & 2033
- Table 30: Global Glyphosate Market Volume Kiloton Forecast, by Type 2020 & 2033
- Table 31: Global Glyphosate Market Revenue Million Forecast, by Application 2020 & 2033
- Table 32: Global Glyphosate Market Volume Kiloton Forecast, by Application 2020 & 2033
- Table 33: Global Glyphosate Market Revenue Million Forecast, by Type 2020 & 2033
- Table 34: Global Glyphosate Market Volume Kiloton Forecast, by Type 2020 & 2033
- Table 35: Global Glyphosate Market Revenue Million Forecast, by Application 2020 & 2033
- Table 36: Global Glyphosate Market Volume Kiloton Forecast, by Application 2020 & 2033
- Table 37: Global Glyphosate Market Revenue Million Forecast, by Country 2020 & 2033
- Table 38: Global Glyphosate Market Volume Kiloton Forecast, by Country 2020 & 2033
- Table 39: Spain Glyphosate Market Revenue (Million) Forecast, by Application 2020 & 2033
- Table 40: Spain Glyphosate Market Volume (Kiloton) Forecast, by Application 2020 & 2033
- Table 41: Italy Glyphosate Market Revenue (Million) Forecast, by Application 2020 & 2033
- Table 42: Italy Glyphosate Market Volume (Kiloton) Forecast, by Application 2020 & 2033
- Table 43: France Glyphosate Market Revenue (Million) Forecast, by Application 2020 & 2033
- Table 44: France Glyphosate Market Volume (Kiloton) Forecast, by Application 2020 & 2033
- Table 45: Germany Glyphosate Market Revenue (Million) Forecast, by Application 2020 & 2033
- Table 46: Germany Glyphosate Market Volume (Kiloton) Forecast, by Application 2020 & 2033
- Table 47: Russia Glyphosate Market Revenue (Million) Forecast, by Application 2020 & 2033
- Table 48: Russia Glyphosate Market Volume (Kiloton) Forecast, by Application 2020 & 2033
- Table 49: United Kingdom Glyphosate Market Revenue (Million) Forecast, by Application 2020 & 2033
- Table 50: United Kingdom Glyphosate Market Volume (Kiloton) Forecast, by Application 2020 & 2033
- Table 51: Rest of Europe Glyphosate Market Revenue (Million) Forecast, by Application 2020 & 2033
- Table 52: Rest of Europe Glyphosate Market Volume (Kiloton) Forecast, by Application 2020 & 2033
- Table 53: Global Glyphosate Market Revenue Million Forecast, by Type 2020 & 2033
- Table 54: Global Glyphosate Market Volume Kiloton Forecast, by Type 2020 & 2033
- Table 55: Global Glyphosate Market Revenue Million Forecast, by Application 2020 & 2033
- Table 56: Global Glyphosate Market Volume Kiloton Forecast, by Application 2020 & 2033
- Table 57: Global Glyphosate Market Revenue Million Forecast, by Type 2020 & 2033
- Table 58: Global Glyphosate Market Volume Kiloton Forecast, by Type 2020 & 2033
- Table 59: Global Glyphosate Market Revenue Million Forecast, by Application 2020 & 2033
- Table 60: Global Glyphosate Market Volume Kiloton Forecast, by Application 2020 & 2033
- Table 61: Global Glyphosate Market Revenue Million Forecast, by Country 2020 & 2033
- Table 62: Global Glyphosate Market Volume Kiloton Forecast, by Country 2020 & 2033
- Table 63: India Glyphosate Market Revenue (Million) Forecast, by Application 2020 & 2033
- Table 64: India Glyphosate Market Volume (Kiloton) Forecast, by Application 2020 & 2033
- Table 65: China Glyphosate Market Revenue (Million) Forecast, by Application 2020 & 2033
- Table 66: China Glyphosate Market Volume (Kiloton) Forecast, by Application 2020 & 2033
- Table 67: Japan Glyphosate Market Revenue (Million) Forecast, by Application 2020 & 2033
- Table 68: Japan Glyphosate Market Volume (Kiloton) Forecast, by Application 2020 & 2033
- Table 69: Australia Glyphosate Market Revenue (Million) Forecast, by Application 2020 & 2033
- Table 70: Australia Glyphosate Market Volume (Kiloton) Forecast, by Application 2020 & 2033
- Table 71: Rest of Asia Pacific Glyphosate Market Revenue (Million) Forecast, by Application 2020 & 2033
- Table 72: Rest of Asia Pacific Glyphosate Market Volume (Kiloton) Forecast, by Application 2020 & 2033
- Table 73: Global Glyphosate Market Revenue Million Forecast, by Type 2020 & 2033
- Table 74: Global Glyphosate Market Volume Kiloton Forecast, by Type 2020 & 2033
- Table 75: Global Glyphosate Market Revenue Million Forecast, by Application 2020 & 2033
- Table 76: Global Glyphosate Market Volume Kiloton Forecast, by Application 2020 & 2033
- Table 77: Global Glyphosate Market Revenue Million Forecast, by Type 2020 & 2033
- Table 78: Global Glyphosate Market Volume Kiloton Forecast, by Type 2020 & 2033
- Table 79: Global Glyphosate Market Revenue Million Forecast, by Application 2020 & 2033
- Table 80: Global Glyphosate Market Volume Kiloton Forecast, by Application 2020 & 2033
- Table 81: Global Glyphosate Market Revenue Million Forecast, by Country 2020 & 2033
- Table 82: Global Glyphosate Market Volume Kiloton Forecast, by Country 2020 & 2033
- Table 83: Brazil Glyphosate Market Revenue (Million) Forecast, by Application 2020 & 2033
- Table 84: Brazil Glyphosate Market Volume (Kiloton) Forecast, by Application 2020 & 2033
- Table 85: Argentina Glyphosate Market Revenue (Million) Forecast, by Application 2020 & 2033
- Table 86: Argentina Glyphosate Market Volume (Kiloton) Forecast, by Application 2020 & 2033
- Table 87: Rest of South America Glyphosate Market Revenue (Million) Forecast, by Application 2020 & 2033
- Table 88: Rest of South America Glyphosate Market Volume (Kiloton) Forecast, by Application 2020 & 2033
- Table 89: Global Glyphosate Market Revenue Million Forecast, by Type 2020 & 2033
- Table 90: Global Glyphosate Market Volume Kiloton Forecast, by Type 2020 & 2033
- Table 91: Global Glyphosate Market Revenue Million Forecast, by Application 2020 & 2033
- Table 92: Global Glyphosate Market Volume Kiloton Forecast, by Application 2020 & 2033
- Table 93: Global Glyphosate Market Revenue Million Forecast, by Type 2020 & 2033
- Table 94: Global Glyphosate Market Volume Kiloton Forecast, by Type 2020 & 2033
- Table 95: Global Glyphosate Market Revenue Million Forecast, by Application 2020 & 2033
- Table 96: Global Glyphosate Market Volume Kiloton Forecast, by Application 2020 & 2033
- Table 97: Global Glyphosate Market Revenue Million Forecast, by Country 2020 & 2033
- Table 98: Global Glyphosate Market Volume Kiloton Forecast, by Country 2020 & 2033
- Table 99: South Africa Glyphosate Market Revenue (Million) Forecast, by Application 2020 & 2033
- Table 100: South Africa Glyphosate Market Volume (Kiloton) Forecast, by Application 2020 & 2033
- Table 101: Rest of Africa Glyphosate Market Revenue (Million) Forecast, by Application 2020 & 2033
- Table 102: Rest of Africa Glyphosate Market Volume (Kiloton) Forecast, by Application 2020 & 2033
Frequently Asked Questions
1. What is the projected Compound Annual Growth Rate (CAGR) of the Glyphosate Market?
The projected CAGR is approximately 7.49%.
2. Which companies are prominent players in the Glyphosate Market?
Key companies in the market include FMC Corporation, Bayer Cropscience AG, Dow AgroScience, DuPont, Adama Agricultural Solutions Ltd, Nufarm Limited, Zhejiang Xinan Chemical Industrial Group Company Ltd, UPL Limited, Syngenta International, BASF SE.
3. What are the main segments of the Glyphosate Market?
The market segments include Type, Application, Type, Application.
4. Can you provide details about the market size?
The market size is estimated to be USD 9.14 Million as of 2022.
5. What are some drivers contributing to market growth?
Seed Treatment As A Solution To Enhance Yield; Growing Awareness For Seed Treatment Among The Farmers; Rising Trend Of Organic Farming.
6. What are the notable trends driving market growth?
Commercialization of Genetically Engineered Herbicide-tolerant Crops.
7. Are there any restraints impacting market growth?
Limitations Across Farm-Level Seed Treatment; Rising Environmental Concerns.
8. Can you provide examples of recent developments in the market?
August 2022: BASF and Corteva Agriscience entered a collaboration deal to develop new soybean weed control solutions for farmers around the world, and the companies agreed to cross-license soybean traits while developing complementary herbicide technologies (which will include tolerance to glyphosate), enabling both companies to offer innovative soybean weed management solutions.
9. What pricing options are available for accessing the report?
Pricing options include single-user, multi-user, and enterprise licenses priced at USD 4750, USD 5250, and USD 8750 respectively.
10. Is the market size provided in terms of value or volume?
The market size is provided in terms of value, measured in Million and volume, measured in Kiloton.
11. Are there any specific market keywords associated with the report?
Yes, the market keyword associated with the report is "Glyphosate Market," which aids in identifying and referencing the specific market segment covered.
12. How do I determine which pricing option suits my needs best?
The pricing options vary based on user requirements and access needs. Individual users may opt for single-user licenses, while businesses requiring broader access may choose multi-user or enterprise licenses for cost-effective access to the report.
13. Are there any additional resources or data provided in the Glyphosate Market report?
While the report offers comprehensive insights, it's advisable to review the specific contents or supplementary materials provided to ascertain if additional resources or data are available.
14. How can I stay updated on further developments or reports in the Glyphosate Market?
To stay informed about further developments, trends, and reports in the Glyphosate Market, consider subscribing to industry newsletters, following relevant companies and organizations, or regularly checking reputable industry news sources and publications.
Methodology
Step 1 - Identification of Relevant Samples Size from Population Database


Step 2 - Approaches for Defining Global Market Size (Value, Volume* & Price*)

Note*: In applicable scenarios
Step 3 - Data Sources
Primary Research
- Web Analytics
- Survey Reports
- Research Institute
- Latest Research Reports
- Opinion Leaders
Secondary Research
- Annual Reports
- White Paper
- Latest Press Release
- Industry Association
- Paid Database
- Investor Presentations

Step 4 - Data Triangulation
Involves using different sources of information in order to increase the validity of a study
These sources are likely to be stakeholders in a program - participants, other researchers, program staff, other community members, and so on.
Then we put all data in single framework & apply various statistical tools to find out the dynamic on the market.
During the analysis stage, feedback from the stakeholder groups would be compared to determine areas of agreement as well as areas of divergence