

Key Insights
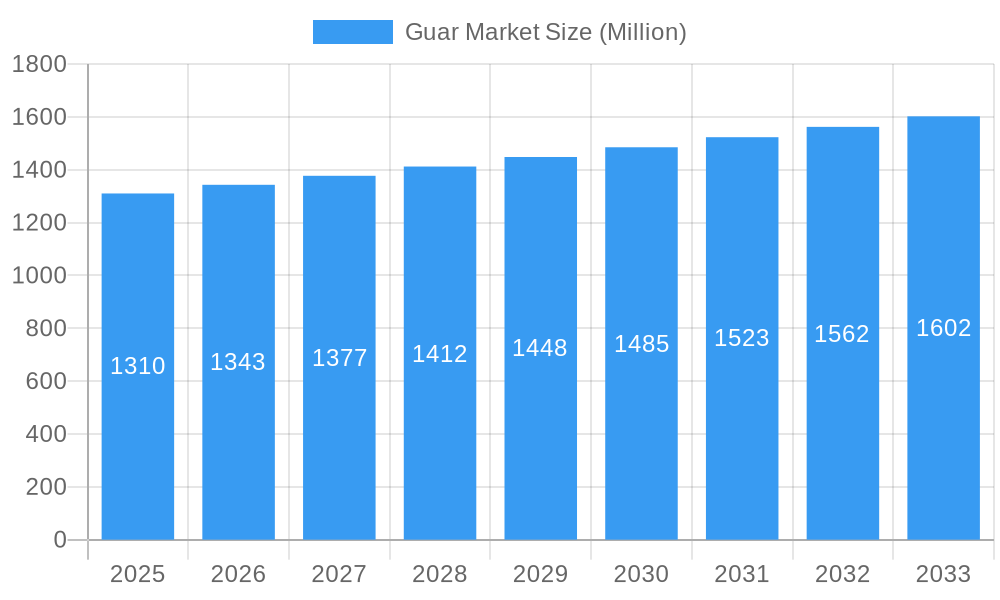
The global guar market, valued at $1.31 billion in 2025, is projected to experience steady growth, driven primarily by increasing demand from the food and pharmaceutical industries. The food industry utilizes guar gum as a thickening and stabilizing agent, while the pharmaceutical sector employs it in various drug formulations. Growth in these sectors, coupled with the expanding oil and gas industry's use of guar gum for fracturing fluids, contributes significantly to market expansion. The consistent CAGR of 2.60% indicates a stable, albeit moderate, growth trajectory over the forecast period (2025-2033). While the exact breakdown of segment contributions isn't provided, a reasonable estimation based on industry trends suggests that food and pharmaceuticals likely hold the largest market shares within the application segments. Similarly, guar gum likely accounts for a more significant portion of the market compared to guar meal due to its broader applicability. Geographical expansion, particularly in developing economies experiencing growth in the aforementioned industries, presents further opportunities. However, potential restraints could include fluctuations in guar bean crop yields, impacting raw material prices and overall market stability. Competition among key players like Noble Commodities, SunGum Global, and others further shapes market dynamics.
Guar Market Market Size (In Billion)
The forecast period (2025-2033) suggests continued growth, albeit at a moderate pace. Several factors could influence the market's trajectory. Technological advancements in guar gum processing could improve efficiency and reduce production costs. Sustainability concerns may increase demand for sustainably sourced guar, leading to changes in production practices. Regulatory changes in specific industries could also have a significant impact. Finally, the market's susceptibility to global economic fluctuations needs to be considered. A more in-depth analysis considering regional variations and specific consumer trends would paint a more nuanced picture of the market’s future.
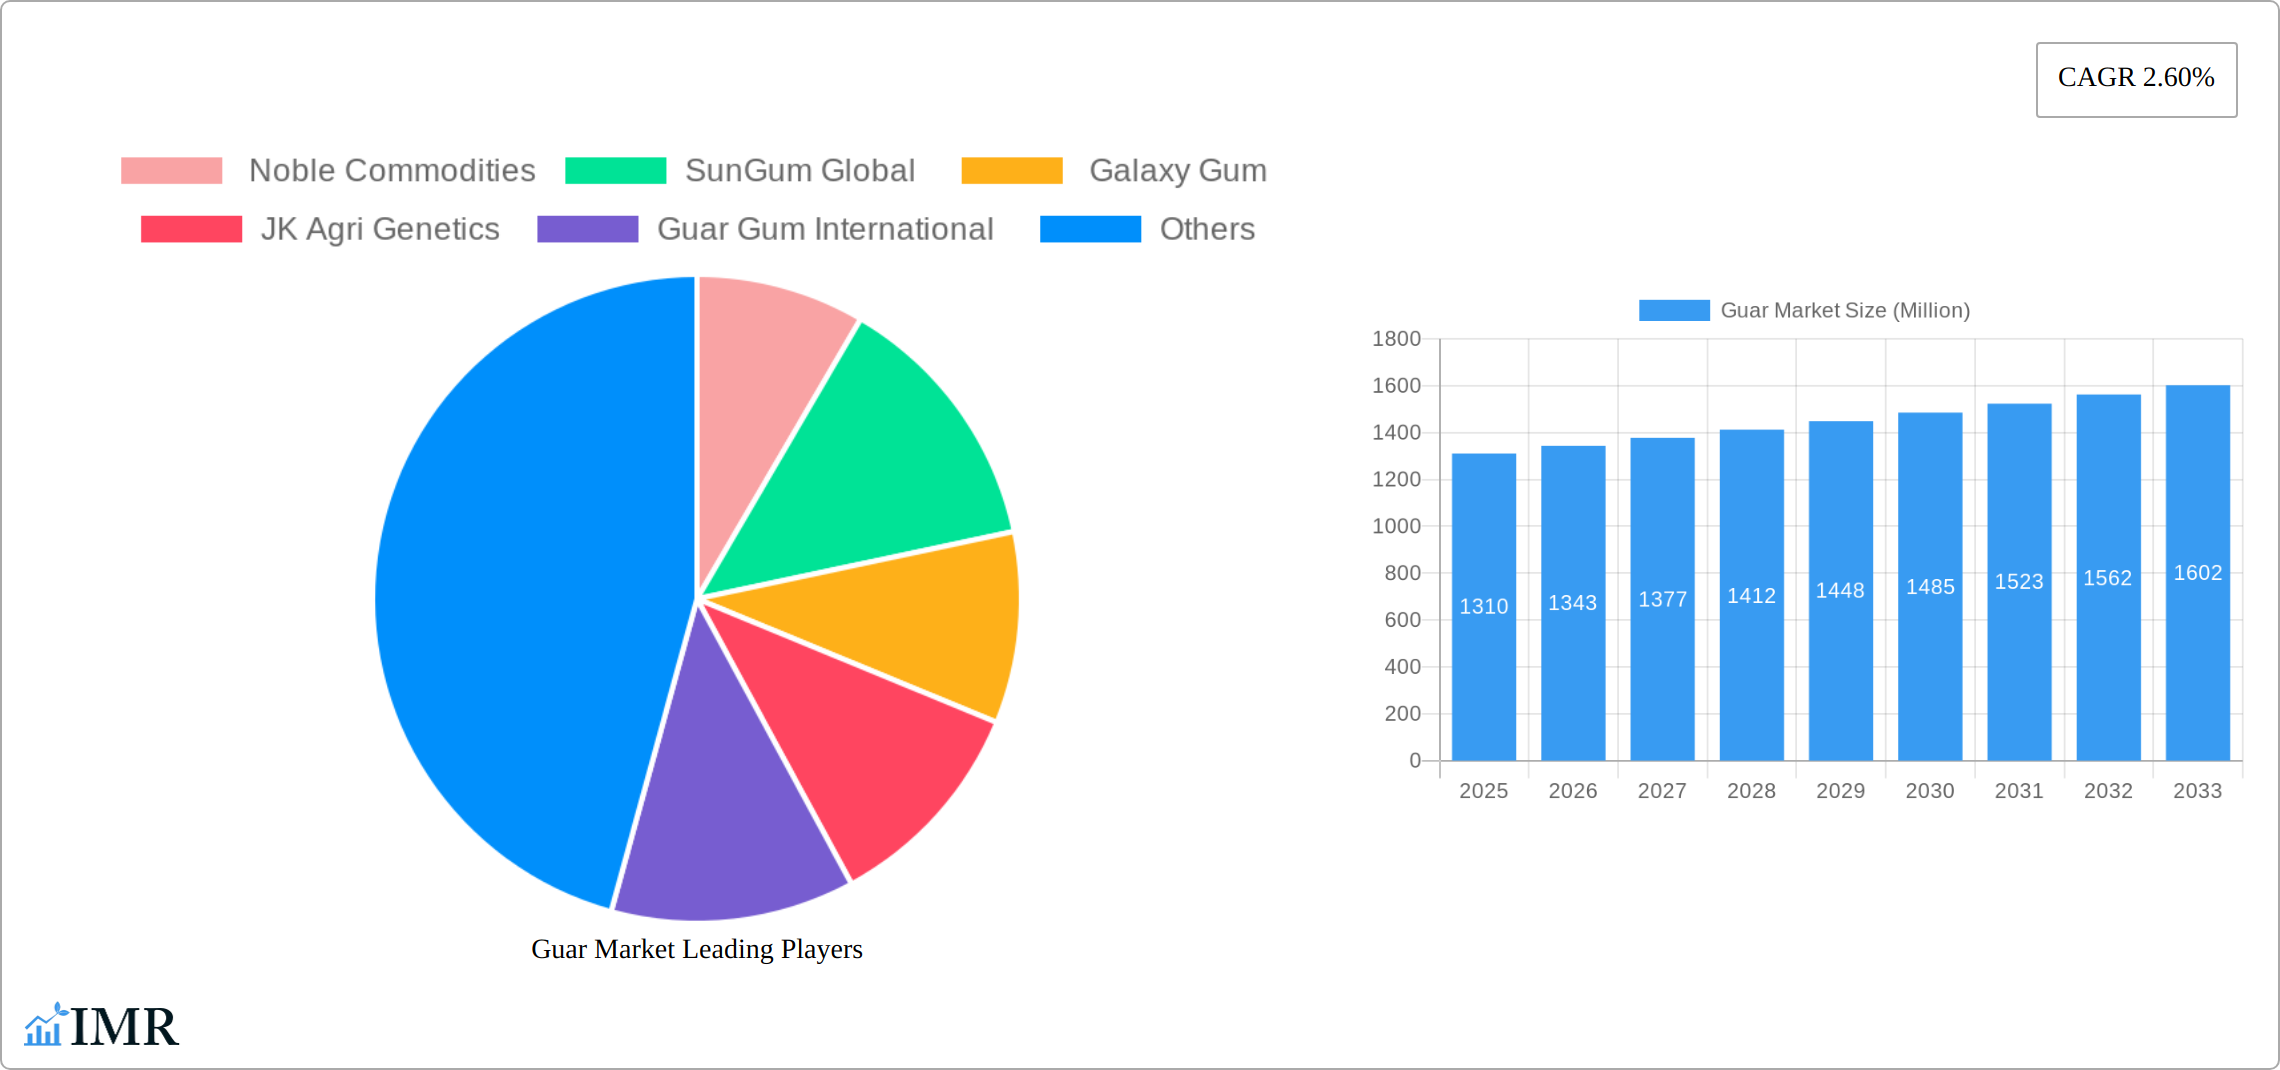
Guar Market Company Market Share
This comprehensive report provides a detailed analysis of the Guar Market, encompassing market dynamics, growth trends, regional insights, product landscape, key players, and future outlook. The study period spans from 2019 to 2033, with 2025 as the base and estimated year. The report utilizes data from the historical period (2019-2024) and forecasts the market's trajectory from 2025 to 2033. The report meticulously analyzes the parent market (Agricultural Commodities) and child markets (Guar Gum and Guar Meal) across diverse applications. This in-depth analysis will equip industry professionals with valuable insights to navigate the dynamic Guar Market landscape.
Guar Market Dynamics & Structure
The Guar Market, valued at xx Million in 2024, exhibits a moderately concentrated structure with key players like Noble Commodities, SunGum Global, Galaxy Gum, JK Agri Genetics, and Guar Gum International holding significant market share. Technological innovations, primarily in guar gum processing and derivative development, are key growth drivers. Regulatory frameworks, particularly concerning export standards (as highlighted by the May 2022 DGFT amendment), significantly impact market dynamics. Competitive substitutes, such as other hydrocolloids, pose a challenge, influencing pricing and market penetration. End-user demographics are diverse, spanning the food, oil & gas, paper, pharmaceutical, and other industries. M&A activity in the sector has been relatively limited in recent years, with only xx deals recorded between 2019 and 2024, indicating a potential for consolidation in the coming years.
- Market Concentration: Moderately concentrated, with top 5 players holding approximately xx% market share.
- Technological Innovation: Focus on improving guar gum quality, developing new derivatives, and enhancing processing efficiency.
- Regulatory Framework: Stringent export regulations and quality standards influence market access and trade flows.
- Competitive Substitutes: Xanthan gum, locust bean gum, and other hydrocolloids pose competitive pressure.
- End-User Demographics: Diverse applications across various industries, influencing demand patterns.
- M&A Trends: Limited M&A activity observed (xx deals between 2019 and 2024), suggesting potential for future consolidation.
Guar Market Growth Trends & Insights
The Guar Market has witnessed consistent growth over the past five years, driven by increasing demand from various sectors. The market size expanded from xx Million in 2019 to xx Million in 2024, exhibiting a CAGR of xx%. Adoption rates vary across applications, with the food and oil & gas industries showing strong growth. Technological disruptions, such as the development of novel guar gum-based polymers (as seen in October 2021), are opening new avenues. Consumer behavior shifts towards sustainable and eco-friendly products are further fueling the demand for guar gum, especially in packaging and other environmentally conscious applications. Market penetration rates in emerging economies are expected to rise significantly in the coming years.
Dominant Regions, Countries, or Segments in Guar Market
India dominates the Guar Market, accounting for approximately xx% of the global production and exports. This dominance is attributed to favorable climatic conditions and large-scale cultivation. Amongst the segments, Guar Gum commands a significantly larger market share than Guar Meal, with the food application sector driving the highest demand.
- Key Drivers for India's Dominance: Favorable climatic conditions, established cultivation practices, and government support.
- Guar Gum Segment: Holds a larger market share due to its wide applicability across various industries.
- Food Application Sector: The largest end-use segment, driven by its use as a thickening and stabilizing agent.
- Growth Potential: Emerging markets in Asia and Africa present significant growth opportunities for Guar Gum and Guar Meal.
Guar Market Product Landscape
The guar market encompasses a diverse range of guar gum products, each with specific properties designed to meet the unique demands of various applications. These applications span multiple industries, driving innovation focused on enhancing purity, viscosity, solubility, and overall functionality. Significant advancements in processing techniques have led to improvements in product consistency, yield optimization, and reduced production costs. Guar gum's inherent advantages, including its exceptionally high viscosity, excellent water solubility, biodegradability, and non-toxicity, continue to fuel its widespread adoption.
Key Drivers, Barriers & Challenges in Guar Market
Key Drivers: The guar market is experiencing robust growth, propelled by several key factors. These include the escalating demand from major industries like food & beverage, oil & gas (particularly in enhanced oil recovery), pharmaceuticals, and cosmetics. The development of novel applications, such as biodegradable polymers and water-treatment solutions, further expands the market potential. Increased cultivation in key regions also contributes to a larger supply, although this is subject to the challenges mentioned below.
Challenges: Despite the positive growth drivers, the guar market faces significant challenges. The primary concern is the inherent volatility of raw material prices, directly influenced by unpredictable weather patterns impacting guar bean harvests. This vulnerability is further exacerbated by dependence on specific geographic regions for cultivation. Potential regulatory hurdles in international markets and increasing competition from synthetic substitutes also pose considerable challenges. These factors have resulted in significant price volatility, estimated at approximately xx% between 2019 and 2024. Supply chain disruptions and geopolitical instability can also contribute to market uncertainty.
Emerging Opportunities in Guar Market
Emerging opportunities lie in exploring new applications in the cosmetics, textile, and biofuel industries. Untapped markets in developing economies present significant growth potential. Furthermore, innovative applications of guar gum in environmentally friendly products and packaging are gaining traction, opening new market segments.
Growth Accelerators in the Guar Market Industry
Several key factors are poised to accelerate growth within the guar market. Ongoing technological breakthroughs in processing techniques and the development of novel guar gum derivatives are expanding application possibilities. Strategic partnerships between guar gum producers and end-users are fostering collaboration and enhancing supply chain efficiency. Expansion into new geographic markets, particularly in developing economies, presents significant growth opportunities. Government initiatives promoting sustainable agriculture and incentivizing innovation within the sector further contribute to a positive market outlook. Furthermore, the increasing focus on sustainability and environmentally friendly alternatives is boosting the demand for guar gum.
Key Players Shaping the Guar Market Market
- Noble Commodities
- SunGum Global
- Galaxy Gum
- JK Agri Genetics
- Guar Gum International
- [Add other significant players here]
Notable Milestones in Guar Market Sector
- May 2022: DGFT amends export regulations for guar gum to the EU and UK, requiring official certificates and PCP/ETO testing reports.
- October 2021: Indian scientists develop a biodegradable polymer using guar gum and chitosan, opening new avenues in packaging applications.
In-Depth Guar Market Market Outlook
The Guar Market is poised for continued growth, driven by its unique properties and expanding applications. Strategic partnerships, technological advancements, and exploration of untapped markets will be crucial for maximizing future potential. The forecast period (2025-2033) anticipates a robust CAGR of xx%, driven by increased demand and market penetration.
Guar Market Segmentation
- 1. Production Analysis
- 2. Consumption Analysis
- 3. Import Market Analysis (Value & Volume)
- 4. Export Market Analysis (Value & Volume)
- 5. Price Trend Analysis
Guar Market Segmentation By Geography
-
1. North America
- 1.1. United States
- 1.2. Canada
-
2. Europe
- 2.1. Germany
- 2.2. France
- 2.3. Russia
- 2.4. Spain
-
3. Asia Pacific
- 3.1. India
- 3.2. China
- 3.3. Japan
- 3.4. Australia
-
4. South America
- 4.1. Brazil
- 4.2. Argentina
-
5. Africa
- 5.1. Malawi
- 5.2. Sudan
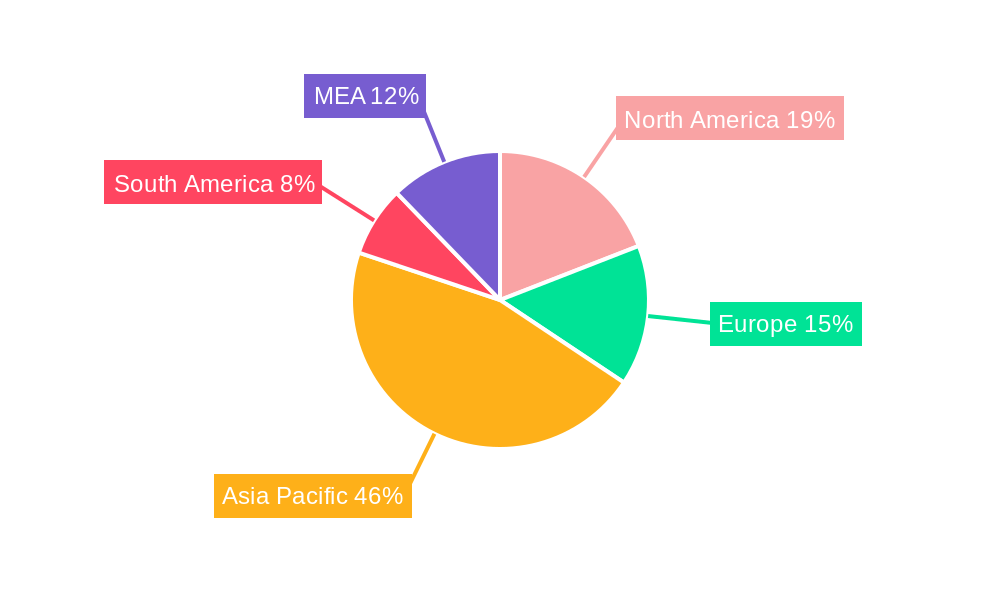
Guar Market Regional Market Share
Geographic Coverage of Guar Market
Guar Market REPORT HIGHLIGHTS
| Aspects | Details |
|---|---|
| Study Period | 2020-2034 |
| Base Year | 2025 |
| Estimated Year | 2026 |
| Forecast Period | 2026-2034 |
| Historical Period | 2020-2025 |
| Growth Rate | CAGR of 2.60% from 2020-2034 |
| Segmentation |
|
Table of Contents
- 1. Introduction
- 1.1. Research Scope
- 1.2. Market Segmentation
- 1.3. Research Objective
- 1.4. Definitions and Assumptions
- 2. Executive Summary
- 2.1. Market Snapshot
- 3. Market Dynamics
- 3.1. Market Drivers
- 3.2. Market Restrains
- 3.3. Market Trends
- 3.4. Market Opportunities
- 4. Market Factor Analysis
- 4.1. Porters Five Forces
- 4.1.1. Bargaining Power of Suppliers
- 4.1.2. Bargaining Power of Buyers
- 4.1.3. Threat of New Entrants
- 4.1.4. Threat of Substitutes
- 4.1.5. Competitive Rivalry
- 4.2. PESTEL analysis
- 4.3. BCG Analysis
- 4.3.1. Stars (High Growth, High Market Share)
- 4.3.2. Cash Cows (Low Growth, High Market Share)
- 4.3.3. Question Mark (High Growth, Low Market Share)
- 4.3.4. Dogs (Low Growth, Low Market Share)
- 4.4. Ansoff Matrix Analysis
- 4.5. Supply Chain Analysis
- 4.6. Regulatory Landscape
- 4.7. Current Market Potential and Opportunity Assessment (TAM–SAM–SOM Framework)
- 4.8. IMR Analyst Note
- 4.1. Porters Five Forces
- 5. Market Analysis, Insights and Forecast 2021-2033
- 5.1. Market Analysis, Insights and Forecast - by Production Analysis
- 5.2. Market Analysis, Insights and Forecast - by Consumption Analysis
- 5.3. Market Analysis, Insights and Forecast - by Import Market Analysis (Value & Volume)
- 5.4. Market Analysis, Insights and Forecast - by Export Market Analysis (Value & Volume)
- 5.5. Market Analysis, Insights and Forecast - by Price Trend Analysis
- 5.6. Market Analysis, Insights and Forecast - by Region
- 5.6.1. North America
- 5.6.2. Europe
- 5.6.3. Asia Pacific
- 5.6.4. South America
- 5.6.5. Africa
- 6. Global Guar Market Analysis, Insights and Forecast, 2021-2033
- 6.1. Market Analysis, Insights and Forecast - by Production Analysis
- 6.2. Market Analysis, Insights and Forecast - by Consumption Analysis
- 6.3. Market Analysis, Insights and Forecast - by Import Market Analysis (Value & Volume)
- 6.4. Market Analysis, Insights and Forecast - by Export Market Analysis (Value & Volume)
- 6.5. Market Analysis, Insights and Forecast - by Price Trend Analysis
- 7. North America Guar Market Analysis, Insights and Forecast, 2020-2032
- 7.1. Market Analysis, Insights and Forecast - by Production Analysis
- 7.2. Market Analysis, Insights and Forecast - by Consumption Analysis
- 7.3. Market Analysis, Insights and Forecast - by Import Market Analysis (Value & Volume)
- 7.4. Market Analysis, Insights and Forecast - by Export Market Analysis (Value & Volume)
- 7.5. Market Analysis, Insights and Forecast - by Price Trend Analysis
- 8. Europe Guar Market Analysis, Insights and Forecast, 2020-2032
- 8.1. Market Analysis, Insights and Forecast - by Production Analysis
- 8.2. Market Analysis, Insights and Forecast - by Consumption Analysis
- 8.3. Market Analysis, Insights and Forecast - by Import Market Analysis (Value & Volume)
- 8.4. Market Analysis, Insights and Forecast - by Export Market Analysis (Value & Volume)
- 8.5. Market Analysis, Insights and Forecast - by Price Trend Analysis
- 9. Asia Pacific Guar Market Analysis, Insights and Forecast, 2020-2032
- 9.1. Market Analysis, Insights and Forecast - by Production Analysis
- 9.2. Market Analysis, Insights and Forecast - by Consumption Analysis
- 9.3. Market Analysis, Insights and Forecast - by Import Market Analysis (Value & Volume)
- 9.4. Market Analysis, Insights and Forecast - by Export Market Analysis (Value & Volume)
- 9.5. Market Analysis, Insights and Forecast - by Price Trend Analysis
- 10. South America Guar Market Analysis, Insights and Forecast, 2020-2032
- 10.1. Market Analysis, Insights and Forecast - by Production Analysis
- 10.2. Market Analysis, Insights and Forecast - by Consumption Analysis
- 10.3. Market Analysis, Insights and Forecast - by Import Market Analysis (Value & Volume)
- 10.4. Market Analysis, Insights and Forecast - by Export Market Analysis (Value & Volume)
- 10.5. Market Analysis, Insights and Forecast - by Price Trend Analysis
- 11. Africa Guar Market Analysis, Insights and Forecast, 2020-2032
- 11.1. Market Analysis, Insights and Forecast - by Production Analysis
- 11.2. Market Analysis, Insights and Forecast - by Consumption Analysis
- 11.3. Market Analysis, Insights and Forecast - by Import Market Analysis (Value & Volume)
- 11.4. Market Analysis, Insights and Forecast - by Export Market Analysis (Value & Volume)
- 11.5. Market Analysis, Insights and Forecast - by Price Trend Analysis
- 12. Competitive Analysis
- 12.1. Company Profiles
- 12.1.1 Noble Commodities
- 12.1.1.1. Company Overview
- 12.1.1.2. Products
- 12.1.1.3. Company Financials
- 12.1.1.4. SWOT Analysis
- 12.1.2 SunGum Global
- 12.1.2.1. Company Overview
- 12.1.2.2. Products
- 12.1.2.3. Company Financials
- 12.1.2.4. SWOT Analysis
- 12.1.3 Galaxy Gum
- 12.1.3.1. Company Overview
- 12.1.3.2. Products
- 12.1.3.3. Company Financials
- 12.1.3.4. SWOT Analysis
- 12.1.4 JK Agri Genetics
- 12.1.4.1. Company Overview
- 12.1.4.2. Products
- 12.1.4.3. Company Financials
- 12.1.4.4. SWOT Analysis
- 12.1.5 Guar Gum International
- 12.1.5.1. Company Overview
- 12.1.5.2. Products
- 12.1.5.3. Company Financials
- 12.1.5.4. SWOT Analysis
- 12.1.1 Noble Commodities
- 12.2. Market Entropy
- 12.2.1 Company's Key Areas Served
- 12.2.2 Recent Developments
- 12.3. Company Market Share Analysis 2025
- 12.3.1 Top 5 Companies Market Share Analysis
- 12.3.2 Top 3 Companies Market Share Analysis
- 12.4. List of Potential Customers
- 13. Research Methodology
List of Figures
- Figure 1: Global Guar Market Revenue Breakdown (Million, %) by Region 2025 & 2033
- Figure 2: Global Guar Market Volume Breakdown (Kiloton, %) by Region 2025 & 2033
- Figure 3: North America Guar Market Revenue (Million), by Production Analysis 2025 & 2033
- Figure 4: North America Guar Market Volume (Kiloton), by Production Analysis 2025 & 2033
- Figure 5: North America Guar Market Revenue Share (%), by Production Analysis 2025 & 2033
- Figure 6: North America Guar Market Volume Share (%), by Production Analysis 2025 & 2033
- Figure 7: North America Guar Market Revenue (Million), by Consumption Analysis 2025 & 2033
- Figure 8: North America Guar Market Volume (Kiloton), by Consumption Analysis 2025 & 2033
- Figure 9: North America Guar Market Revenue Share (%), by Consumption Analysis 2025 & 2033
- Figure 10: North America Guar Market Volume Share (%), by Consumption Analysis 2025 & 2033
- Figure 11: North America Guar Market Revenue (Million), by Import Market Analysis (Value & Volume) 2025 & 2033
- Figure 12: North America Guar Market Volume (Kiloton), by Import Market Analysis (Value & Volume) 2025 & 2033
- Figure 13: North America Guar Market Revenue Share (%), by Import Market Analysis (Value & Volume) 2025 & 2033
- Figure 14: North America Guar Market Volume Share (%), by Import Market Analysis (Value & Volume) 2025 & 2033
- Figure 15: North America Guar Market Revenue (Million), by Export Market Analysis (Value & Volume) 2025 & 2033
- Figure 16: North America Guar Market Volume (Kiloton), by Export Market Analysis (Value & Volume) 2025 & 2033
- Figure 17: North America Guar Market Revenue Share (%), by Export Market Analysis (Value & Volume) 2025 & 2033
- Figure 18: North America Guar Market Volume Share (%), by Export Market Analysis (Value & Volume) 2025 & 2033
- Figure 19: North America Guar Market Revenue (Million), by Price Trend Analysis 2025 & 2033
- Figure 20: North America Guar Market Volume (Kiloton), by Price Trend Analysis 2025 & 2033
- Figure 21: North America Guar Market Revenue Share (%), by Price Trend Analysis 2025 & 2033
- Figure 22: North America Guar Market Volume Share (%), by Price Trend Analysis 2025 & 2033
- Figure 23: North America Guar Market Revenue (Million), by Country 2025 & 2033
- Figure 24: North America Guar Market Volume (Kiloton), by Country 2025 & 2033
- Figure 25: North America Guar Market Revenue Share (%), by Country 2025 & 2033
- Figure 26: North America Guar Market Volume Share (%), by Country 2025 & 2033
- Figure 27: Europe Guar Market Revenue (Million), by Production Analysis 2025 & 2033
- Figure 28: Europe Guar Market Volume (Kiloton), by Production Analysis 2025 & 2033
- Figure 29: Europe Guar Market Revenue Share (%), by Production Analysis 2025 & 2033
- Figure 30: Europe Guar Market Volume Share (%), by Production Analysis 2025 & 2033
- Figure 31: Europe Guar Market Revenue (Million), by Consumption Analysis 2025 & 2033
- Figure 32: Europe Guar Market Volume (Kiloton), by Consumption Analysis 2025 & 2033
- Figure 33: Europe Guar Market Revenue Share (%), by Consumption Analysis 2025 & 2033
- Figure 34: Europe Guar Market Volume Share (%), by Consumption Analysis 2025 & 2033
- Figure 35: Europe Guar Market Revenue (Million), by Import Market Analysis (Value & Volume) 2025 & 2033
- Figure 36: Europe Guar Market Volume (Kiloton), by Import Market Analysis (Value & Volume) 2025 & 2033
- Figure 37: Europe Guar Market Revenue Share (%), by Import Market Analysis (Value & Volume) 2025 & 2033
- Figure 38: Europe Guar Market Volume Share (%), by Import Market Analysis (Value & Volume) 2025 & 2033
- Figure 39: Europe Guar Market Revenue (Million), by Export Market Analysis (Value & Volume) 2025 & 2033
- Figure 40: Europe Guar Market Volume (Kiloton), by Export Market Analysis (Value & Volume) 2025 & 2033
- Figure 41: Europe Guar Market Revenue Share (%), by Export Market Analysis (Value & Volume) 2025 & 2033
- Figure 42: Europe Guar Market Volume Share (%), by Export Market Analysis (Value & Volume) 2025 & 2033
- Figure 43: Europe Guar Market Revenue (Million), by Price Trend Analysis 2025 & 2033
- Figure 44: Europe Guar Market Volume (Kiloton), by Price Trend Analysis 2025 & 2033
- Figure 45: Europe Guar Market Revenue Share (%), by Price Trend Analysis 2025 & 2033
- Figure 46: Europe Guar Market Volume Share (%), by Price Trend Analysis 2025 & 2033
- Figure 47: Europe Guar Market Revenue (Million), by Country 2025 & 2033
- Figure 48: Europe Guar Market Volume (Kiloton), by Country 2025 & 2033
- Figure 49: Europe Guar Market Revenue Share (%), by Country 2025 & 2033
- Figure 50: Europe Guar Market Volume Share (%), by Country 2025 & 2033
- Figure 51: Asia Pacific Guar Market Revenue (Million), by Production Analysis 2025 & 2033
- Figure 52: Asia Pacific Guar Market Volume (Kiloton), by Production Analysis 2025 & 2033
- Figure 53: Asia Pacific Guar Market Revenue Share (%), by Production Analysis 2025 & 2033
- Figure 54: Asia Pacific Guar Market Volume Share (%), by Production Analysis 2025 & 2033
- Figure 55: Asia Pacific Guar Market Revenue (Million), by Consumption Analysis 2025 & 2033
- Figure 56: Asia Pacific Guar Market Volume (Kiloton), by Consumption Analysis 2025 & 2033
- Figure 57: Asia Pacific Guar Market Revenue Share (%), by Consumption Analysis 2025 & 2033
- Figure 58: Asia Pacific Guar Market Volume Share (%), by Consumption Analysis 2025 & 2033
- Figure 59: Asia Pacific Guar Market Revenue (Million), by Import Market Analysis (Value & Volume) 2025 & 2033
- Figure 60: Asia Pacific Guar Market Volume (Kiloton), by Import Market Analysis (Value & Volume) 2025 & 2033
- Figure 61: Asia Pacific Guar Market Revenue Share (%), by Import Market Analysis (Value & Volume) 2025 & 2033
- Figure 62: Asia Pacific Guar Market Volume Share (%), by Import Market Analysis (Value & Volume) 2025 & 2033
- Figure 63: Asia Pacific Guar Market Revenue (Million), by Export Market Analysis (Value & Volume) 2025 & 2033
- Figure 64: Asia Pacific Guar Market Volume (Kiloton), by Export Market Analysis (Value & Volume) 2025 & 2033
- Figure 65: Asia Pacific Guar Market Revenue Share (%), by Export Market Analysis (Value & Volume) 2025 & 2033
- Figure 66: Asia Pacific Guar Market Volume Share (%), by Export Market Analysis (Value & Volume) 2025 & 2033
- Figure 67: Asia Pacific Guar Market Revenue (Million), by Price Trend Analysis 2025 & 2033
- Figure 68: Asia Pacific Guar Market Volume (Kiloton), by Price Trend Analysis 2025 & 2033
- Figure 69: Asia Pacific Guar Market Revenue Share (%), by Price Trend Analysis 2025 & 2033
- Figure 70: Asia Pacific Guar Market Volume Share (%), by Price Trend Analysis 2025 & 2033
- Figure 71: Asia Pacific Guar Market Revenue (Million), by Country 2025 & 2033
- Figure 72: Asia Pacific Guar Market Volume (Kiloton), by Country 2025 & 2033
- Figure 73: Asia Pacific Guar Market Revenue Share (%), by Country 2025 & 2033
- Figure 74: Asia Pacific Guar Market Volume Share (%), by Country 2025 & 2033
- Figure 75: South America Guar Market Revenue (Million), by Production Analysis 2025 & 2033
- Figure 76: South America Guar Market Volume (Kiloton), by Production Analysis 2025 & 2033
- Figure 77: South America Guar Market Revenue Share (%), by Production Analysis 2025 & 2033
- Figure 78: South America Guar Market Volume Share (%), by Production Analysis 2025 & 2033
- Figure 79: South America Guar Market Revenue (Million), by Consumption Analysis 2025 & 2033
- Figure 80: South America Guar Market Volume (Kiloton), by Consumption Analysis 2025 & 2033
- Figure 81: South America Guar Market Revenue Share (%), by Consumption Analysis 2025 & 2033
- Figure 82: South America Guar Market Volume Share (%), by Consumption Analysis 2025 & 2033
- Figure 83: South America Guar Market Revenue (Million), by Import Market Analysis (Value & Volume) 2025 & 2033
- Figure 84: South America Guar Market Volume (Kiloton), by Import Market Analysis (Value & Volume) 2025 & 2033
- Figure 85: South America Guar Market Revenue Share (%), by Import Market Analysis (Value & Volume) 2025 & 2033
- Figure 86: South America Guar Market Volume Share (%), by Import Market Analysis (Value & Volume) 2025 & 2033
- Figure 87: South America Guar Market Revenue (Million), by Export Market Analysis (Value & Volume) 2025 & 2033
- Figure 88: South America Guar Market Volume (Kiloton), by Export Market Analysis (Value & Volume) 2025 & 2033
- Figure 89: South America Guar Market Revenue Share (%), by Export Market Analysis (Value & Volume) 2025 & 2033
- Figure 90: South America Guar Market Volume Share (%), by Export Market Analysis (Value & Volume) 2025 & 2033
- Figure 91: South America Guar Market Revenue (Million), by Price Trend Analysis 2025 & 2033
- Figure 92: South America Guar Market Volume (Kiloton), by Price Trend Analysis 2025 & 2033
- Figure 93: South America Guar Market Revenue Share (%), by Price Trend Analysis 2025 & 2033
- Figure 94: South America Guar Market Volume Share (%), by Price Trend Analysis 2025 & 2033
- Figure 95: South America Guar Market Revenue (Million), by Country 2025 & 2033
- Figure 96: South America Guar Market Volume (Kiloton), by Country 2025 & 2033
- Figure 97: South America Guar Market Revenue Share (%), by Country 2025 & 2033
- Figure 98: South America Guar Market Volume Share (%), by Country 2025 & 2033
- Figure 99: Africa Guar Market Revenue (Million), by Production Analysis 2025 & 2033
- Figure 100: Africa Guar Market Volume (Kiloton), by Production Analysis 2025 & 2033
- Figure 101: Africa Guar Market Revenue Share (%), by Production Analysis 2025 & 2033
- Figure 102: Africa Guar Market Volume Share (%), by Production Analysis 2025 & 2033
- Figure 103: Africa Guar Market Revenue (Million), by Consumption Analysis 2025 & 2033
- Figure 104: Africa Guar Market Volume (Kiloton), by Consumption Analysis 2025 & 2033
- Figure 105: Africa Guar Market Revenue Share (%), by Consumption Analysis 2025 & 2033
- Figure 106: Africa Guar Market Volume Share (%), by Consumption Analysis 2025 & 2033
- Figure 107: Africa Guar Market Revenue (Million), by Import Market Analysis (Value & Volume) 2025 & 2033
- Figure 108: Africa Guar Market Volume (Kiloton), by Import Market Analysis (Value & Volume) 2025 & 2033
- Figure 109: Africa Guar Market Revenue Share (%), by Import Market Analysis (Value & Volume) 2025 & 2033
- Figure 110: Africa Guar Market Volume Share (%), by Import Market Analysis (Value & Volume) 2025 & 2033
- Figure 111: Africa Guar Market Revenue (Million), by Export Market Analysis (Value & Volume) 2025 & 2033
- Figure 112: Africa Guar Market Volume (Kiloton), by Export Market Analysis (Value & Volume) 2025 & 2033
- Figure 113: Africa Guar Market Revenue Share (%), by Export Market Analysis (Value & Volume) 2025 & 2033
- Figure 114: Africa Guar Market Volume Share (%), by Export Market Analysis (Value & Volume) 2025 & 2033
- Figure 115: Africa Guar Market Revenue (Million), by Price Trend Analysis 2025 & 2033
- Figure 116: Africa Guar Market Volume (Kiloton), by Price Trend Analysis 2025 & 2033
- Figure 117: Africa Guar Market Revenue Share (%), by Price Trend Analysis 2025 & 2033
- Figure 118: Africa Guar Market Volume Share (%), by Price Trend Analysis 2025 & 2033
- Figure 119: Africa Guar Market Revenue (Million), by Country 2025 & 2033
- Figure 120: Africa Guar Market Volume (Kiloton), by Country 2025 & 2033
- Figure 121: Africa Guar Market Revenue Share (%), by Country 2025 & 2033
- Figure 122: Africa Guar Market Volume Share (%), by Country 2025 & 2033
List of Tables
- Table 1: Global Guar Market Revenue Million Forecast, by Production Analysis 2020 & 2033
- Table 2: Global Guar Market Volume Kiloton Forecast, by Production Analysis 2020 & 2033
- Table 3: Global Guar Market Revenue Million Forecast, by Consumption Analysis 2020 & 2033
- Table 4: Global Guar Market Volume Kiloton Forecast, by Consumption Analysis 2020 & 2033
- Table 5: Global Guar Market Revenue Million Forecast, by Import Market Analysis (Value & Volume) 2020 & 2033
- Table 6: Global Guar Market Volume Kiloton Forecast, by Import Market Analysis (Value & Volume) 2020 & 2033
- Table 7: Global Guar Market Revenue Million Forecast, by Export Market Analysis (Value & Volume) 2020 & 2033
- Table 8: Global Guar Market Volume Kiloton Forecast, by Export Market Analysis (Value & Volume) 2020 & 2033
- Table 9: Global Guar Market Revenue Million Forecast, by Price Trend Analysis 2020 & 2033
- Table 10: Global Guar Market Volume Kiloton Forecast, by Price Trend Analysis 2020 & 2033
- Table 11: Global Guar Market Revenue Million Forecast, by Region 2020 & 2033
- Table 12: Global Guar Market Volume Kiloton Forecast, by Region 2020 & 2033
- Table 13: Global Guar Market Revenue Million Forecast, by Production Analysis 2020 & 2033
- Table 14: Global Guar Market Volume Kiloton Forecast, by Production Analysis 2020 & 2033
- Table 15: Global Guar Market Revenue Million Forecast, by Consumption Analysis 2020 & 2033
- Table 16: Global Guar Market Volume Kiloton Forecast, by Consumption Analysis 2020 & 2033
- Table 17: Global Guar Market Revenue Million Forecast, by Import Market Analysis (Value & Volume) 2020 & 2033
- Table 18: Global Guar Market Volume Kiloton Forecast, by Import Market Analysis (Value & Volume) 2020 & 2033
- Table 19: Global Guar Market Revenue Million Forecast, by Export Market Analysis (Value & Volume) 2020 & 2033
- Table 20: Global Guar Market Volume Kiloton Forecast, by Export Market Analysis (Value & Volume) 2020 & 2033
- Table 21: Global Guar Market Revenue Million Forecast, by Price Trend Analysis 2020 & 2033
- Table 22: Global Guar Market Volume Kiloton Forecast, by Price Trend Analysis 2020 & 2033
- Table 23: Global Guar Market Revenue Million Forecast, by Country 2020 & 2033
- Table 24: Global Guar Market Volume Kiloton Forecast, by Country 2020 & 2033
- Table 25: United States Guar Market Revenue (Million) Forecast, by Application 2020 & 2033
- Table 26: United States Guar Market Volume (Kiloton) Forecast, by Application 2020 & 2033
- Table 27: Canada Guar Market Revenue (Million) Forecast, by Application 2020 & 2033
- Table 28: Canada Guar Market Volume (Kiloton) Forecast, by Application 2020 & 2033
- Table 29: Global Guar Market Revenue Million Forecast, by Production Analysis 2020 & 2033
- Table 30: Global Guar Market Volume Kiloton Forecast, by Production Analysis 2020 & 2033
- Table 31: Global Guar Market Revenue Million Forecast, by Consumption Analysis 2020 & 2033
- Table 32: Global Guar Market Volume Kiloton Forecast, by Consumption Analysis 2020 & 2033
- Table 33: Global Guar Market Revenue Million Forecast, by Import Market Analysis (Value & Volume) 2020 & 2033
- Table 34: Global Guar Market Volume Kiloton Forecast, by Import Market Analysis (Value & Volume) 2020 & 2033
- Table 35: Global Guar Market Revenue Million Forecast, by Export Market Analysis (Value & Volume) 2020 & 2033
- Table 36: Global Guar Market Volume Kiloton Forecast, by Export Market Analysis (Value & Volume) 2020 & 2033
- Table 37: Global Guar Market Revenue Million Forecast, by Price Trend Analysis 2020 & 2033
- Table 38: Global Guar Market Volume Kiloton Forecast, by Price Trend Analysis 2020 & 2033
- Table 39: Global Guar Market Revenue Million Forecast, by Country 2020 & 2033
- Table 40: Global Guar Market Volume Kiloton Forecast, by Country 2020 & 2033
- Table 41: Germany Guar Market Revenue (Million) Forecast, by Application 2020 & 2033
- Table 42: Germany Guar Market Volume (Kiloton) Forecast, by Application 2020 & 2033
- Table 43: France Guar Market Revenue (Million) Forecast, by Application 2020 & 2033
- Table 44: France Guar Market Volume (Kiloton) Forecast, by Application 2020 & 2033
- Table 45: Russia Guar Market Revenue (Million) Forecast, by Application 2020 & 2033
- Table 46: Russia Guar Market Volume (Kiloton) Forecast, by Application 2020 & 2033
- Table 47: Spain Guar Market Revenue (Million) Forecast, by Application 2020 & 2033
- Table 48: Spain Guar Market Volume (Kiloton) Forecast, by Application 2020 & 2033
- Table 49: Global Guar Market Revenue Million Forecast, by Production Analysis 2020 & 2033
- Table 50: Global Guar Market Volume Kiloton Forecast, by Production Analysis 2020 & 2033
- Table 51: Global Guar Market Revenue Million Forecast, by Consumption Analysis 2020 & 2033
- Table 52: Global Guar Market Volume Kiloton Forecast, by Consumption Analysis 2020 & 2033
- Table 53: Global Guar Market Revenue Million Forecast, by Import Market Analysis (Value & Volume) 2020 & 2033
- Table 54: Global Guar Market Volume Kiloton Forecast, by Import Market Analysis (Value & Volume) 2020 & 2033
- Table 55: Global Guar Market Revenue Million Forecast, by Export Market Analysis (Value & Volume) 2020 & 2033
- Table 56: Global Guar Market Volume Kiloton Forecast, by Export Market Analysis (Value & Volume) 2020 & 2033
- Table 57: Global Guar Market Revenue Million Forecast, by Price Trend Analysis 2020 & 2033
- Table 58: Global Guar Market Volume Kiloton Forecast, by Price Trend Analysis 2020 & 2033
- Table 59: Global Guar Market Revenue Million Forecast, by Country 2020 & 2033
- Table 60: Global Guar Market Volume Kiloton Forecast, by Country 2020 & 2033
- Table 61: India Guar Market Revenue (Million) Forecast, by Application 2020 & 2033
- Table 62: India Guar Market Volume (Kiloton) Forecast, by Application 2020 & 2033
- Table 63: China Guar Market Revenue (Million) Forecast, by Application 2020 & 2033
- Table 64: China Guar Market Volume (Kiloton) Forecast, by Application 2020 & 2033
- Table 65: Japan Guar Market Revenue (Million) Forecast, by Application 2020 & 2033
- Table 66: Japan Guar Market Volume (Kiloton) Forecast, by Application 2020 & 2033
- Table 67: Australia Guar Market Revenue (Million) Forecast, by Application 2020 & 2033
- Table 68: Australia Guar Market Volume (Kiloton) Forecast, by Application 2020 & 2033
- Table 69: Global Guar Market Revenue Million Forecast, by Production Analysis 2020 & 2033
- Table 70: Global Guar Market Volume Kiloton Forecast, by Production Analysis 2020 & 2033
- Table 71: Global Guar Market Revenue Million Forecast, by Consumption Analysis 2020 & 2033
- Table 72: Global Guar Market Volume Kiloton Forecast, by Consumption Analysis 2020 & 2033
- Table 73: Global Guar Market Revenue Million Forecast, by Import Market Analysis (Value & Volume) 2020 & 2033
- Table 74: Global Guar Market Volume Kiloton Forecast, by Import Market Analysis (Value & Volume) 2020 & 2033
- Table 75: Global Guar Market Revenue Million Forecast, by Export Market Analysis (Value & Volume) 2020 & 2033
- Table 76: Global Guar Market Volume Kiloton Forecast, by Export Market Analysis (Value & Volume) 2020 & 2033
- Table 77: Global Guar Market Revenue Million Forecast, by Price Trend Analysis 2020 & 2033
- Table 78: Global Guar Market Volume Kiloton Forecast, by Price Trend Analysis 2020 & 2033
- Table 79: Global Guar Market Revenue Million Forecast, by Country 2020 & 2033
- Table 80: Global Guar Market Volume Kiloton Forecast, by Country 2020 & 2033
- Table 81: Brazil Guar Market Revenue (Million) Forecast, by Application 2020 & 2033
- Table 82: Brazil Guar Market Volume (Kiloton) Forecast, by Application 2020 & 2033
- Table 83: Argentina Guar Market Revenue (Million) Forecast, by Application 2020 & 2033
- Table 84: Argentina Guar Market Volume (Kiloton) Forecast, by Application 2020 & 2033
- Table 85: Global Guar Market Revenue Million Forecast, by Production Analysis 2020 & 2033
- Table 86: Global Guar Market Volume Kiloton Forecast, by Production Analysis 2020 & 2033
- Table 87: Global Guar Market Revenue Million Forecast, by Consumption Analysis 2020 & 2033
- Table 88: Global Guar Market Volume Kiloton Forecast, by Consumption Analysis 2020 & 2033
- Table 89: Global Guar Market Revenue Million Forecast, by Import Market Analysis (Value & Volume) 2020 & 2033
- Table 90: Global Guar Market Volume Kiloton Forecast, by Import Market Analysis (Value & Volume) 2020 & 2033
- Table 91: Global Guar Market Revenue Million Forecast, by Export Market Analysis (Value & Volume) 2020 & 2033
- Table 92: Global Guar Market Volume Kiloton Forecast, by Export Market Analysis (Value & Volume) 2020 & 2033
- Table 93: Global Guar Market Revenue Million Forecast, by Price Trend Analysis 2020 & 2033
- Table 94: Global Guar Market Volume Kiloton Forecast, by Price Trend Analysis 2020 & 2033
- Table 95: Global Guar Market Revenue Million Forecast, by Country 2020 & 2033
- Table 96: Global Guar Market Volume Kiloton Forecast, by Country 2020 & 2033
- Table 97: Malawi Guar Market Revenue (Million) Forecast, by Application 2020 & 2033
- Table 98: Malawi Guar Market Volume (Kiloton) Forecast, by Application 2020 & 2033
- Table 99: Sudan Guar Market Revenue (Million) Forecast, by Application 2020 & 2033
- Table 100: Sudan Guar Market Volume (Kiloton) Forecast, by Application 2020 & 2033
Frequently Asked Questions
1. What is the projected Compound Annual Growth Rate (CAGR) of the Guar Market?
The projected CAGR is approximately 2.60%.
2. Which companies are prominent players in the Guar Market?
Key companies in the market include Noble Commodities, SunGum Global , Galaxy Gum , JK Agri Genetics , Guar Gum International .
3. What are the main segments of the Guar Market?
The market segments include Production Analysis, Consumption Analysis, Import Market Analysis (Value & Volume), Export Market Analysis (Value & Volume), Price Trend Analysis.
4. Can you provide details about the market size?
The market size is estimated to be USD 1.31 Million as of 2022.
5. What are some drivers contributing to market growth?
Rising Consumption of Cashew Nuts in the Country; Favorable Government Initiatives.
6. What are the notable trends driving market growth?
High Demand by End-users.
7. Are there any restraints impacting market growth?
Hazardous Climatic Condition Hinders Cashew Production; Stringent Regulations Related to Food Quality Standards.
8. Can you provide examples of recent developments in the market?
May 2022: The Directorate General of Foreign Trade (DGFT), on May 9, 2022, issued an amendment to the notification dated September 29, 2017, for the export of guar gum to the European Union and the United Kingdom. The export originating from India should get an official certificate and the original analytical report of testing of pentachlorophenol (PCP) and ethylene oxide (ETO) from Vimta Labs, Hyderabad. In addition to Vimta Labs, Hyderabad, Export Inspection Agency (EIA) Chennai has also been authorized to issue the analytical report of testing of PCP.
9. What pricing options are available for accessing the report?
Pricing options include single-user, multi-user, and enterprise licenses priced at USD 4750, USD 5250, and USD 8750 respectively.
10. Is the market size provided in terms of value or volume?
The market size is provided in terms of value, measured in Million and volume, measured in Kiloton.
11. Are there any specific market keywords associated with the report?
Yes, the market keyword associated with the report is "Guar Market," which aids in identifying and referencing the specific market segment covered.
12. How do I determine which pricing option suits my needs best?
The pricing options vary based on user requirements and access needs. Individual users may opt for single-user licenses, while businesses requiring broader access may choose multi-user or enterprise licenses for cost-effective access to the report.
13. Are there any additional resources or data provided in the Guar Market report?
While the report offers comprehensive insights, it's advisable to review the specific contents or supplementary materials provided to ascertain if additional resources or data are available.
14. How can I stay updated on further developments or reports in the Guar Market?
To stay informed about further developments, trends, and reports in the Guar Market, consider subscribing to industry newsletters, following relevant companies and organizations, or regularly checking reputable industry news sources and publications.
Methodology
Step 1 - Identification of Relevant Samples Size from Population Database


Step 2 - Approaches for Defining Global Market Size (Value, Volume* & Price*)

Note*: In applicable scenarios
Step 3 - Data Sources
Primary Research
- Web Analytics
- Survey Reports
- Research Institute
- Latest Research Reports
- Opinion Leaders
Secondary Research
- Annual Reports
- White Paper
- Latest Press Release
- Industry Association
- Paid Database
- Investor Presentations

Step 4 - Data Triangulation
Involves using different sources of information in order to increase the validity of a study
These sources are likely to be stakeholders in a program - participants, other researchers, program staff, other community members, and so on.
Then we put all data in single framework & apply various statistical tools to find out the dynamic on the market.
During the analysis stage, feedback from the stakeholder groups would be compared to determine areas of agreement as well as areas of divergence