

Key Insights
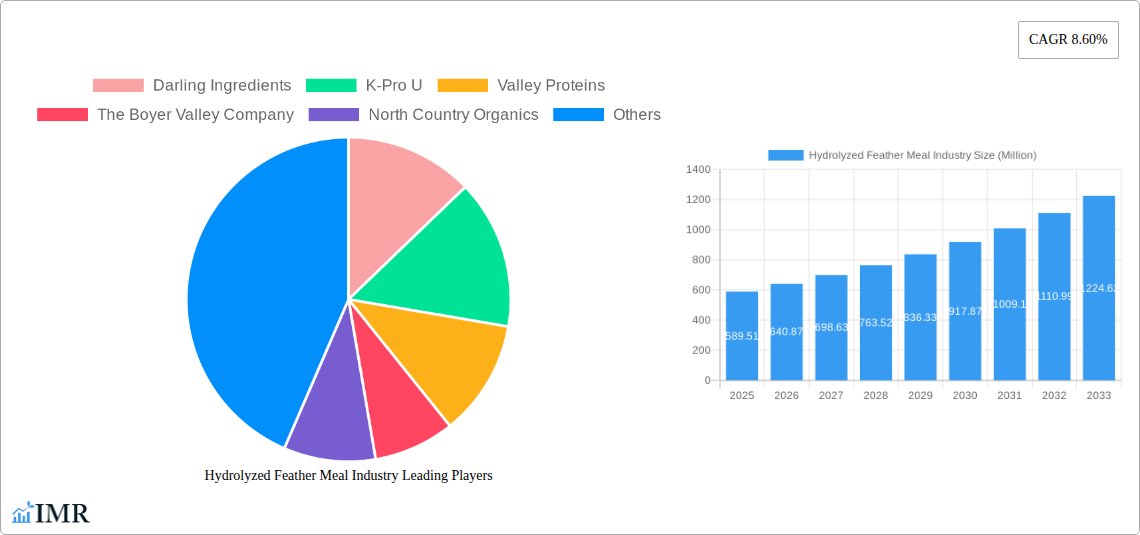
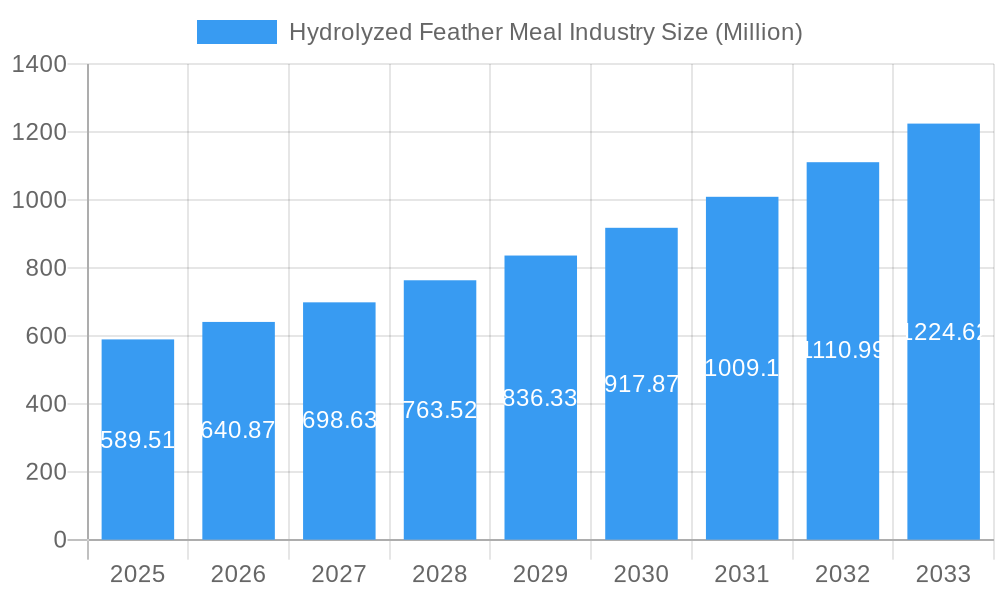
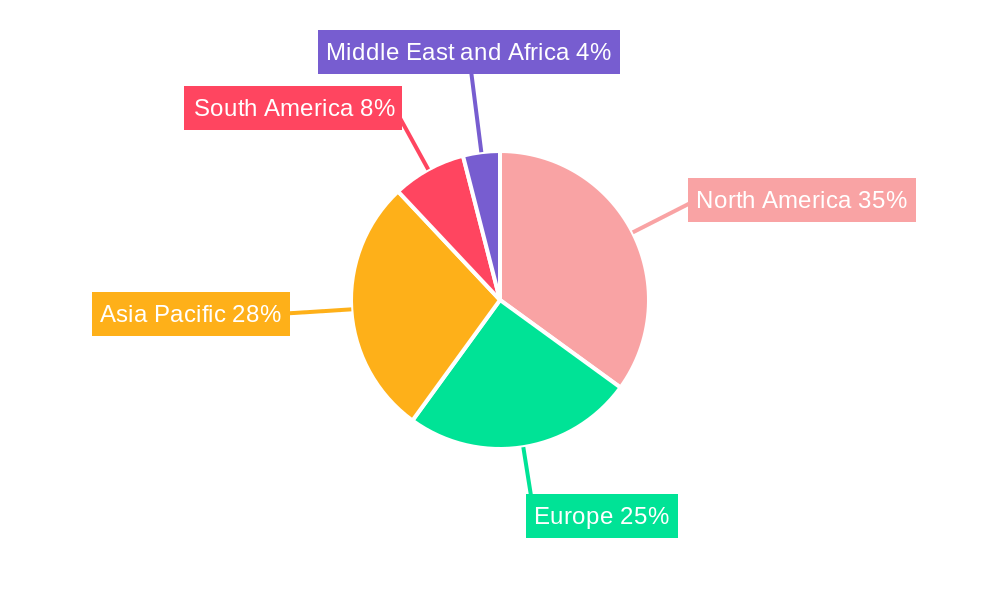
The hydrolyzed feather meal market, valued at $589.51 million in 2025, is projected to experience robust growth, driven by increasing demand from animal feed and agrochemical industries. The market's Compound Annual Growth Rate (CAGR) of 8.60% from 2025 to 2033 indicates significant expansion opportunities. This growth is fueled by several factors. The rising global population necessitates increased protein production in animal agriculture, making hydrolyzed feather meal—a sustainable and cost-effective protein source—an attractive alternative. Furthermore, its use as a fertilizer component in agrochemicals contributes to the market's expansion, as farmers seek environmentally friendly and economically viable solutions. The organic segment is anticipated to witness particularly strong growth due to rising consumer awareness of sustainable agricultural practices and the increasing demand for organically produced animal products. While competition among established players like Darling Ingredients and K-Pro U remains significant, the market also presents opportunities for smaller, specialized companies focused on niche applications or specific geographical regions. Regional variations in growth are expected, with North America and Asia-Pacific anticipated to lead market expansion due to significant agricultural activities and increasing consumer demand in these areas. However, regulatory hurdles and potential fluctuations in raw material costs could present challenges to sustained growth.
Hydrolyzed Feather Meal Industry Market Size (In Million)
The market segmentation reveals that the animal feed application dominates, benefiting from the protein-rich nature of hydrolyzed feather meal and its suitability for various animal species. The agrochemical application segment is showing promising growth potential, driven by its positive environmental impact compared to traditional fertilizers. The "other applications" segment, although smaller now, presents an interesting avenue for innovation and diversification, potentially leveraging hydrolyzed feather meal's unique properties in areas such as bioplastics or cosmetics. Future growth will depend on further research and development into its applications, along with successful marketing efforts highlighting its sustainability advantages and cost-effectiveness compared to traditional alternatives. Continued investment in sustainable sourcing and processing technologies will further support market expansion and solidify its position as a key component of the future of sustainable agriculture.
Hydrolyzed Feather Meal Industry Company Market Share
This comprehensive report provides a detailed analysis of the global Hydrolyzed Feather Meal industry, covering market dynamics, growth trends, competitive landscape, and future outlook. The study period spans from 2019 to 2033, with a base year of 2025 and a forecast period from 2025 to 2033. The historical period analyzed is 2019-2024. The report is essential for industry professionals, investors, and stakeholders seeking insights into this rapidly evolving market. The market is segmented by Type (Conventional, Organic) and Application (Animal Feed, Agrochemicals, Other Applications).
Hydrolyzed Feather Meal Industry Market Dynamics & Structure
This section analyzes the market structure, encompassing market concentration, technological innovation, regulatory landscapes, competitive substitutes, end-user demographics, and mergers and acquisitions (M&A) activity. The global hydrolyzed feather meal market is moderately fragmented, with several key players competing based on product quality, pricing, and geographic reach. The market size in 2025 is estimated at XX Million.
- Market Concentration: The top five players hold an estimated XX% market share in 2025.
- Technological Innovation: Ongoing research focuses on improving the efficiency and sustainability of hydrolysis processes, leading to higher-quality products and reduced environmental impact. Innovation barriers include high initial investment costs for advanced technologies.
- Regulatory Frameworks: Regulations concerning animal feed safety and environmental protection significantly influence market dynamics. Variations in regulations across different regions create complexities for global players.
- Competitive Product Substitutes: Other protein sources, such as soybean meal and fishmeal, pose competitive pressure. However, the cost-effectiveness and sustainable nature of hydrolyzed feather meal offer a competitive edge.
- End-User Demographics: The primary end-users are animal feed manufacturers, followed by agrochemical producers and other niche applications. Growth in animal agriculture directly fuels market demand.
- M&A Trends: The past five years have witnessed XX M&A deals, driven by consolidation efforts and expansion into new markets. The average deal size was approximately XX Million.
Hydrolyzed Feather Meal Industry Growth Trends & Insights
The global hydrolyzed feather meal market is projected to experience significant growth during the forecast period (2025-2033). Driven by increasing demand from the animal feed industry and the growing adoption of sustainable agricultural practices, the market is anticipated to reach XX Million by 2033, exhibiting a Compound Annual Growth Rate (CAGR) of XX%. The rising global population and increasing meat consumption are key drivers. Technological advancements in hydrolysis processes, leading to improved product quality and efficiency, are also boosting market expansion. Consumer preference towards sustainable and environmentally friendly feed solutions further strengthens market growth. Market penetration in developing regions remains relatively low, offering substantial growth potential.
Dominant Regions, Countries, or Segments in Hydrolyzed Feather Meal Industry
North America currently dominates the global hydrolyzed feather meal market, holding approximately XX% market share in 2025. This dominance is attributed to factors like:
- Developed Animal Feed Industry: The region boasts a large and technologically advanced animal feed industry, creating high demand for hydrolyzed feather meal.
- Stringent Regulatory Framework: While stringent, the well-established regulatory framework ensures product quality and safety, increasing consumer confidence.
- Technological Advancements: North America is a hub for research and development in hydrolyzed feather meal production, fostering innovation and efficiency.
However, regions like Asia-Pacific are showing rapid growth, propelled by factors such as:
- Expanding Poultry Industry: The booming poultry industry in countries like China and India fuels the demand for affordable and efficient protein sources.
- Government Support for Sustainable Agriculture: Many governments in the region are promoting sustainable agriculture practices, creating favorable conditions for hydrolyzed feather meal adoption.
Within the segments, the Animal Feed application segment holds the largest market share, contributing approximately XX% to total revenue in 2025. The Conventional type segment dominates in volume but the Organic segment is witnessing higher growth due to increasing consumer preference for organic products.
Hydrolyzed Feather Meal Industry Product Landscape
The Hydrolyzed Feather Meal Industry is characterized by its innovative approach to transforming a readily available byproduct into a valuable resource. Hydrolyzed feather meal, derived from the enzymatic or thermal processing of poultry feathers, is meticulously engineered to optimize its nutritional profile and bioavailability. Current product development is sharply focused on enhancing digestibility, increasing the concentration of essential amino acids, and achieving specific protein qualities tailored for diverse animal species, from poultry and swine to aquaculture and companion animals. This involves sophisticated hydrolysis techniques that break down tough keratin proteins into more accessible peptides and amino acids. Furthermore, manufacturers are exploring advancements in processing to minimize environmental footprints, such as optimizing energy consumption and waste valorization within the production cycle. Emerging product lines are also incorporating synergistic additives, such as vitamins, minerals, and specialized enzymes, to further amplify the functional benefits and overall efficacy of the feather meal in animal nutrition and potentially in other innovative sectors.
Key Drivers, Barriers & Challenges in Hydrolyzed Feather Meal Industry
Key Drivers:
- Surging Demand for Sustainable and Circular Protein Sources: The global imperative for environmentally conscious and cost-effective protein alternatives in animal feed is a primary catalyst. Hydrolyzed feather meal offers a compelling solution by valorizing a significant agricultural byproduct, reducing reliance on resource-intensive protein crops.
- Continuous Technological Advancements in Hydrolysis and Processing: Ongoing research and development in hydrolysis methodologies, including enzymatic and thermochemical processes, are yielding higher-quality products with improved nutritional profiles and enhanced digestibility. These innovations also contribute to greater production efficiency and reduced environmental impact.
- Supportive Regulatory Frameworks and Policy Initiatives: Governments worldwide are increasingly promoting sustainable agriculture, circular economy principles, and waste-to-resource strategies. These supportive policies, including incentives for byproduct utilization and bio-based product development, are significantly boosting market growth.
- Growing Awareness of the Nutritional Benefits: A deeper understanding within the animal feed industry of the unique amino acid composition and functional benefits of hydrolyzed feather meal, such as its high methionine and cystine content, is driving its adoption.
Key Challenges:
- Volatility in Raw Material (Feather) Supply and Pricing: The availability and cost of raw poultry feathers can experience significant fluctuations due to factors like seasonal demand for poultry, disease outbreaks, and changes in poultry processing volumes, directly impacting production costs and market stability.
- Navigating Stringent Regulatory Landscapes for Animal Feed Safety and Quality: Adhering to comprehensive and evolving regulatory requirements concerning animal feed safety, traceability, and quality assurance, including potential concerns related to heavy metals or other contaminants, presents an ongoing challenge.
- Intense Competition from Established and Emerging Protein Sources: Hydrolyzed feather meal faces robust competition from conventional protein meals like soybean meal, corn gluten meal, and increasingly from alternative protein sources such as insect meal and algal protein. The need for clear differentiation and demonstration of superior value is paramount. The competitive pressure from alternative protein sources is estimated to cost the industry upwards of $XX Million annually in market share and price erosion.
- Perception and Market Acceptance: Overcoming historical perceptions and educating stakeholders about the advanced processing and superior nutritional value of modern hydrolyzed feather meal, compared to less processed feather meal, is crucial for wider market acceptance.
Emerging Opportunities in Hydrolyzed Feather Meal Industry
- Diversification into Novel Applications: Beyond its established role in animal nutrition, significant untapped potential exists for hydrolyzed feather meal in emerging sectors such as the development of biodegradable bioplastics, functional ingredients for cosmetics and personal care products (due to keratin's properties), and advanced agricultural soil conditioners.
- Development and Marketing of Premium, Value-Added Formulations: Creating highly specialized and customized hydrolyzed feather meal products with enhanced functional properties, such as improved palatability, targeted amino acid profiles for specific life stages or physiological conditions, or incorporating prebiotics and probiotics, offers a pathway to higher market value.
- Strategic Market Penetration in Developing and Emerging Economies: Rapidly growing animal agriculture sectors in developing regions present substantial opportunities for market expansion. Tailored product offerings and partnerships can address the increasing demand for affordable and high-quality protein sources in these markets.
- Integration into Circular Economy and Biorefinery Concepts: Positioning hydrolyzed feather meal as a key component within integrated biorefineries, alongside other agricultural byproducts, can unlock synergistic opportunities for resource optimization and the creation of multiple high-value co-products, further enhancing sustainability credentials.
Growth Accelerators in the Hydrolyzed Feather Meal Industry Industry
Technological breakthroughs in hydrolysis processes, along with strategic partnerships between feather processors and animal feed manufacturers, are key growth catalysts. Expanding into new geographic markets and developing innovative product formulations are crucial for long-term market expansion. Investing in research and development and adopting sustainable manufacturing practices will play a vital role in shaping the industry's future.
Key Players Shaping the Hydrolyzed Feather Meal Industry Market
- Darling Ingredients Inc.
- K-Pro U.S.A.
- Valley Proteins, Inc.
- The Boyer Company
- North Country Organics
- JG Pears Ltd.
- Kleingarn Agrarprodukte
- FASA Group
- Keraplast (as a potential innovator in feather-based materials)
Notable Milestones in Hydrolyzed Feather Meal Industry Sector
- September 2021: Indian scientists achieved a significant breakthrough by developing a novel, sustainable, and cost-effective hydrodynamic technique to convert poultry feathers and animal hair into a valuable organic fertilizer. This innovation underscores the growing focus on sustainable waste valorization and the creation of eco-friendly agricultural inputs.
- August 2022: Researchers at the University of Danang - University of Science and Technology in Vietnam successfully engineered a high-quality bio-organic fertilizer derived from chicken feathers. This achievement highlights the successful application of advanced processing techniques for transforming feather waste into beneficial products for sustainable agriculture, demonstrating the growing efficacy of such solutions.
- Ongoing: Continuous advancements in enzymatic hydrolysis technologies are leading to improved protein efficiency ratios (PER) and reduced processing times, making hydrolyzed feather meal a more competitive and attractive ingredient in feed formulations across various animal species.
In-Depth Hydrolyzed Feather Meal Industry Market Outlook
The hydrolyzed feather meal market is poised for substantial growth in the coming years. Ongoing technological advancements, coupled with the increasing demand for sustainable protein sources, will drive market expansion. Strategic partnerships and market expansion into untapped regions will be critical for long-term success. The focus on sustainability and the development of value-added products will shape the future competitive landscape of this dynamic industry. The market is expected to surpass XX Million by 2033.
Hydrolyzed Feather Meal Industry Segmentation
- 1. Production Analysis
- 2. Consumption Analysis
- 3. Import Market Analysis (Value & Volume)
- 4. Export Market Analysis (Value & Volume)
- 5. Price Trend Analysis
Hydrolyzed Feather Meal Industry Segmentation By Geography
-
1. North America
- 1.1. United States
- 1.2. Canada
- 1.3. Mexico
-
2. South America
- 2.1. Brazil
- 2.2. Argentina
- 2.3. Rest of South America
-
3. Europe
- 3.1. United Kingdom
- 3.2. Germany
- 3.3. France
- 3.4. Italy
- 3.5. Spain
- 3.6. Russia
- 3.7. Benelux
- 3.8. Nordics
- 3.9. Rest of Europe
-
4. Middle East & Africa
- 4.1. Turkey
- 4.2. Israel
- 4.3. GCC
- 4.4. North Africa
- 4.5. South Africa
- 4.6. Rest of Middle East & Africa
-
5. Asia Pacific
- 5.1. China
- 5.2. India
- 5.3. Japan
- 5.4. South Korea
- 5.5. ASEAN
- 5.6. Oceania
- 5.7. Rest of Asia Pacific
Hydrolyzed Feather Meal Industry Regional Market Share
Geographic Coverage of Hydrolyzed Feather Meal Industry
Hydrolyzed Feather Meal Industry REPORT HIGHLIGHTS
| Aspects | Details |
|---|---|
| Study Period | 2020-2034 |
| Base Year | 2025 |
| Estimated Year | 2026 |
| Forecast Period | 2026-2034 |
| Historical Period | 2020-2025 |
| Growth Rate | CAGR of 8.60% from 2020-2034 |
| Segmentation |
|
Table of Contents
- 1. Introduction
- 1.1. Research Scope
- 1.2. Market Segmentation
- 1.3. Research Objective
- 1.4. Definitions and Assumptions
- 2. Executive Summary
- 2.1. Market Snapshot
- 3. Market Dynamics
- 3.1. Market Drivers
- 3.2. Market Restrains
- 3.3. Market Trends
- 3.4. Market Opportunities
- 4. Market Factor Analysis
- 4.1. Porters Five Forces
- 4.1.1. Bargaining Power of Suppliers
- 4.1.2. Bargaining Power of Buyers
- 4.1.3. Threat of New Entrants
- 4.1.4. Threat of Substitutes
- 4.1.5. Competitive Rivalry
- 4.2. PESTEL analysis
- 4.3. BCG Analysis
- 4.3.1. Stars (High Growth, High Market Share)
- 4.3.2. Cash Cows (Low Growth, High Market Share)
- 4.3.3. Question Mark (High Growth, Low Market Share)
- 4.3.4. Dogs (Low Growth, Low Market Share)
- 4.4. Ansoff Matrix Analysis
- 4.5. Supply Chain Analysis
- 4.6. Regulatory Landscape
- 4.7. Current Market Potential and Opportunity Assessment (TAM–SAM–SOM Framework)
- 4.8. IMR Analyst Note
- 4.1. Porters Five Forces
- 5. Market Analysis, Insights and Forecast 2021-2033
- 5.1. Market Analysis, Insights and Forecast - by Production Analysis
- 5.2. Market Analysis, Insights and Forecast - by Consumption Analysis
- 5.3. Market Analysis, Insights and Forecast - by Import Market Analysis (Value & Volume)
- 5.4. Market Analysis, Insights and Forecast - by Export Market Analysis (Value & Volume)
- 5.5. Market Analysis, Insights and Forecast - by Price Trend Analysis
- 5.6. Market Analysis, Insights and Forecast - by Region
- 5.6.1. North America
- 5.6.2. South America
- 5.6.3. Europe
- 5.6.4. Middle East & Africa
- 5.6.5. Asia Pacific
- 6. Global Hydrolyzed Feather Meal Industry Analysis, Insights and Forecast, 2021-2033
- 6.1. Market Analysis, Insights and Forecast - by Production Analysis
- 6.2. Market Analysis, Insights and Forecast - by Consumption Analysis
- 6.3. Market Analysis, Insights and Forecast - by Import Market Analysis (Value & Volume)
- 6.4. Market Analysis, Insights and Forecast - by Export Market Analysis (Value & Volume)
- 6.5. Market Analysis, Insights and Forecast - by Price Trend Analysis
- 7. North America Hydrolyzed Feather Meal Industry Analysis, Insights and Forecast, 2020-2032
- 7.1. Market Analysis, Insights and Forecast - by Production Analysis
- 7.2. Market Analysis, Insights and Forecast - by Consumption Analysis
- 7.3. Market Analysis, Insights and Forecast - by Import Market Analysis (Value & Volume)
- 7.4. Market Analysis, Insights and Forecast - by Export Market Analysis (Value & Volume)
- 7.5. Market Analysis, Insights and Forecast - by Price Trend Analysis
- 8. South America Hydrolyzed Feather Meal Industry Analysis, Insights and Forecast, 2020-2032
- 8.1. Market Analysis, Insights and Forecast - by Production Analysis
- 8.2. Market Analysis, Insights and Forecast - by Consumption Analysis
- 8.3. Market Analysis, Insights and Forecast - by Import Market Analysis (Value & Volume)
- 8.4. Market Analysis, Insights and Forecast - by Export Market Analysis (Value & Volume)
- 8.5. Market Analysis, Insights and Forecast - by Price Trend Analysis
- 9. Europe Hydrolyzed Feather Meal Industry Analysis, Insights and Forecast, 2020-2032
- 9.1. Market Analysis, Insights and Forecast - by Production Analysis
- 9.2. Market Analysis, Insights and Forecast - by Consumption Analysis
- 9.3. Market Analysis, Insights and Forecast - by Import Market Analysis (Value & Volume)
- 9.4. Market Analysis, Insights and Forecast - by Export Market Analysis (Value & Volume)
- 9.5. Market Analysis, Insights and Forecast - by Price Trend Analysis
- 10. Middle East & Africa Hydrolyzed Feather Meal Industry Analysis, Insights and Forecast, 2020-2032
- 10.1. Market Analysis, Insights and Forecast - by Production Analysis
- 10.2. Market Analysis, Insights and Forecast - by Consumption Analysis
- 10.3. Market Analysis, Insights and Forecast - by Import Market Analysis (Value & Volume)
- 10.4. Market Analysis, Insights and Forecast - by Export Market Analysis (Value & Volume)
- 10.5. Market Analysis, Insights and Forecast - by Price Trend Analysis
- 11. Asia Pacific Hydrolyzed Feather Meal Industry Analysis, Insights and Forecast, 2020-2032
- 11.1. Market Analysis, Insights and Forecast - by Production Analysis
- 11.2. Market Analysis, Insights and Forecast - by Consumption Analysis
- 11.3. Market Analysis, Insights and Forecast - by Import Market Analysis (Value & Volume)
- 11.4. Market Analysis, Insights and Forecast - by Export Market Analysis (Value & Volume)
- 11.5. Market Analysis, Insights and Forecast - by Price Trend Analysis
- 12. Competitive Analysis
- 12.1. Company Profiles
- 12.1.1 Darling Ingredients
- 12.1.1.1. Company Overview
- 12.1.1.2. Products
- 12.1.1.3. Company Financials
- 12.1.1.4. SWOT Analysis
- 12.1.2 K-Pro U
- 12.1.2.1. Company Overview
- 12.1.2.2. Products
- 12.1.2.3. Company Financials
- 12.1.2.4. SWOT Analysis
- 12.1.3 Valley Proteins
- 12.1.3.1. Company Overview
- 12.1.3.2. Products
- 12.1.3.3. Company Financials
- 12.1.3.4. SWOT Analysis
- 12.1.4 The Boyer Valley Company
- 12.1.4.1. Company Overview
- 12.1.4.2. Products
- 12.1.4.3. Company Financials
- 12.1.4.4. SWOT Analysis
- 12.1.5 North Country Organics
- 12.1.5.1. Company Overview
- 12.1.5.2. Products
- 12.1.5.3. Company Financials
- 12.1.5.4. SWOT Analysis
- 12.1.6 JG Pears
- 12.1.6.1. Company Overview
- 12.1.6.2. Products
- 12.1.6.3. Company Financials
- 12.1.6.4. SWOT Analysis
- 12.1.7 Kleingarn Agrarprodukte
- 12.1.7.1. Company Overview
- 12.1.7.2. Products
- 12.1.7.3. Company Financials
- 12.1.7.4. SWOT Analysis
- 12.1.8 FASA Group
- 12.1.8.1. Company Overview
- 12.1.8.2. Products
- 12.1.8.3. Company Financials
- 12.1.8.4. SWOT Analysis
- 12.1.1 Darling Ingredients
- 12.2. Market Entropy
- 12.2.1 Company's Key Areas Served
- 12.2.2 Recent Developments
- 12.3. Company Market Share Analysis 2025
- 12.3.1 Top 5 Companies Market Share Analysis
- 12.3.2 Top 3 Companies Market Share Analysis
- 12.4. List of Potential Customers
- 13. Research Methodology
List of Figures
- Figure 1: Global Hydrolyzed Feather Meal Industry Revenue Breakdown (Million, %) by Region 2025 & 2033
- Figure 2: North America Hydrolyzed Feather Meal Industry Revenue (Million), by Production Analysis 2025 & 2033
- Figure 3: North America Hydrolyzed Feather Meal Industry Revenue Share (%), by Production Analysis 2025 & 2033
- Figure 4: North America Hydrolyzed Feather Meal Industry Revenue (Million), by Consumption Analysis 2025 & 2033
- Figure 5: North America Hydrolyzed Feather Meal Industry Revenue Share (%), by Consumption Analysis 2025 & 2033
- Figure 6: North America Hydrolyzed Feather Meal Industry Revenue (Million), by Import Market Analysis (Value & Volume) 2025 & 2033
- Figure 7: North America Hydrolyzed Feather Meal Industry Revenue Share (%), by Import Market Analysis (Value & Volume) 2025 & 2033
- Figure 8: North America Hydrolyzed Feather Meal Industry Revenue (Million), by Export Market Analysis (Value & Volume) 2025 & 2033
- Figure 9: North America Hydrolyzed Feather Meal Industry Revenue Share (%), by Export Market Analysis (Value & Volume) 2025 & 2033
- Figure 10: North America Hydrolyzed Feather Meal Industry Revenue (Million), by Price Trend Analysis 2025 & 2033
- Figure 11: North America Hydrolyzed Feather Meal Industry Revenue Share (%), by Price Trend Analysis 2025 & 2033
- Figure 12: North America Hydrolyzed Feather Meal Industry Revenue (Million), by Country 2025 & 2033
- Figure 13: North America Hydrolyzed Feather Meal Industry Revenue Share (%), by Country 2025 & 2033
- Figure 14: South America Hydrolyzed Feather Meal Industry Revenue (Million), by Production Analysis 2025 & 2033
- Figure 15: South America Hydrolyzed Feather Meal Industry Revenue Share (%), by Production Analysis 2025 & 2033
- Figure 16: South America Hydrolyzed Feather Meal Industry Revenue (Million), by Consumption Analysis 2025 & 2033
- Figure 17: South America Hydrolyzed Feather Meal Industry Revenue Share (%), by Consumption Analysis 2025 & 2033
- Figure 18: South America Hydrolyzed Feather Meal Industry Revenue (Million), by Import Market Analysis (Value & Volume) 2025 & 2033
- Figure 19: South America Hydrolyzed Feather Meal Industry Revenue Share (%), by Import Market Analysis (Value & Volume) 2025 & 2033
- Figure 20: South America Hydrolyzed Feather Meal Industry Revenue (Million), by Export Market Analysis (Value & Volume) 2025 & 2033
- Figure 21: South America Hydrolyzed Feather Meal Industry Revenue Share (%), by Export Market Analysis (Value & Volume) 2025 & 2033
- Figure 22: South America Hydrolyzed Feather Meal Industry Revenue (Million), by Price Trend Analysis 2025 & 2033
- Figure 23: South America Hydrolyzed Feather Meal Industry Revenue Share (%), by Price Trend Analysis 2025 & 2033
- Figure 24: South America Hydrolyzed Feather Meal Industry Revenue (Million), by Country 2025 & 2033
- Figure 25: South America Hydrolyzed Feather Meal Industry Revenue Share (%), by Country 2025 & 2033
- Figure 26: Europe Hydrolyzed Feather Meal Industry Revenue (Million), by Production Analysis 2025 & 2033
- Figure 27: Europe Hydrolyzed Feather Meal Industry Revenue Share (%), by Production Analysis 2025 & 2033
- Figure 28: Europe Hydrolyzed Feather Meal Industry Revenue (Million), by Consumption Analysis 2025 & 2033
- Figure 29: Europe Hydrolyzed Feather Meal Industry Revenue Share (%), by Consumption Analysis 2025 & 2033
- Figure 30: Europe Hydrolyzed Feather Meal Industry Revenue (Million), by Import Market Analysis (Value & Volume) 2025 & 2033
- Figure 31: Europe Hydrolyzed Feather Meal Industry Revenue Share (%), by Import Market Analysis (Value & Volume) 2025 & 2033
- Figure 32: Europe Hydrolyzed Feather Meal Industry Revenue (Million), by Export Market Analysis (Value & Volume) 2025 & 2033
- Figure 33: Europe Hydrolyzed Feather Meal Industry Revenue Share (%), by Export Market Analysis (Value & Volume) 2025 & 2033
- Figure 34: Europe Hydrolyzed Feather Meal Industry Revenue (Million), by Price Trend Analysis 2025 & 2033
- Figure 35: Europe Hydrolyzed Feather Meal Industry Revenue Share (%), by Price Trend Analysis 2025 & 2033
- Figure 36: Europe Hydrolyzed Feather Meal Industry Revenue (Million), by Country 2025 & 2033
- Figure 37: Europe Hydrolyzed Feather Meal Industry Revenue Share (%), by Country 2025 & 2033
- Figure 38: Middle East & Africa Hydrolyzed Feather Meal Industry Revenue (Million), by Production Analysis 2025 & 2033
- Figure 39: Middle East & Africa Hydrolyzed Feather Meal Industry Revenue Share (%), by Production Analysis 2025 & 2033
- Figure 40: Middle East & Africa Hydrolyzed Feather Meal Industry Revenue (Million), by Consumption Analysis 2025 & 2033
- Figure 41: Middle East & Africa Hydrolyzed Feather Meal Industry Revenue Share (%), by Consumption Analysis 2025 & 2033
- Figure 42: Middle East & Africa Hydrolyzed Feather Meal Industry Revenue (Million), by Import Market Analysis (Value & Volume) 2025 & 2033
- Figure 43: Middle East & Africa Hydrolyzed Feather Meal Industry Revenue Share (%), by Import Market Analysis (Value & Volume) 2025 & 2033
- Figure 44: Middle East & Africa Hydrolyzed Feather Meal Industry Revenue (Million), by Export Market Analysis (Value & Volume) 2025 & 2033
- Figure 45: Middle East & Africa Hydrolyzed Feather Meal Industry Revenue Share (%), by Export Market Analysis (Value & Volume) 2025 & 2033
- Figure 46: Middle East & Africa Hydrolyzed Feather Meal Industry Revenue (Million), by Price Trend Analysis 2025 & 2033
- Figure 47: Middle East & Africa Hydrolyzed Feather Meal Industry Revenue Share (%), by Price Trend Analysis 2025 & 2033
- Figure 48: Middle East & Africa Hydrolyzed Feather Meal Industry Revenue (Million), by Country 2025 & 2033
- Figure 49: Middle East & Africa Hydrolyzed Feather Meal Industry Revenue Share (%), by Country 2025 & 2033
- Figure 50: Asia Pacific Hydrolyzed Feather Meal Industry Revenue (Million), by Production Analysis 2025 & 2033
- Figure 51: Asia Pacific Hydrolyzed Feather Meal Industry Revenue Share (%), by Production Analysis 2025 & 2033
- Figure 52: Asia Pacific Hydrolyzed Feather Meal Industry Revenue (Million), by Consumption Analysis 2025 & 2033
- Figure 53: Asia Pacific Hydrolyzed Feather Meal Industry Revenue Share (%), by Consumption Analysis 2025 & 2033
- Figure 54: Asia Pacific Hydrolyzed Feather Meal Industry Revenue (Million), by Import Market Analysis (Value & Volume) 2025 & 2033
- Figure 55: Asia Pacific Hydrolyzed Feather Meal Industry Revenue Share (%), by Import Market Analysis (Value & Volume) 2025 & 2033
- Figure 56: Asia Pacific Hydrolyzed Feather Meal Industry Revenue (Million), by Export Market Analysis (Value & Volume) 2025 & 2033
- Figure 57: Asia Pacific Hydrolyzed Feather Meal Industry Revenue Share (%), by Export Market Analysis (Value & Volume) 2025 & 2033
- Figure 58: Asia Pacific Hydrolyzed Feather Meal Industry Revenue (Million), by Price Trend Analysis 2025 & 2033
- Figure 59: Asia Pacific Hydrolyzed Feather Meal Industry Revenue Share (%), by Price Trend Analysis 2025 & 2033
- Figure 60: Asia Pacific Hydrolyzed Feather Meal Industry Revenue (Million), by Country 2025 & 2033
- Figure 61: Asia Pacific Hydrolyzed Feather Meal Industry Revenue Share (%), by Country 2025 & 2033
List of Tables
- Table 1: Global Hydrolyzed Feather Meal Industry Revenue Million Forecast, by Production Analysis 2020 & 2033
- Table 2: Global Hydrolyzed Feather Meal Industry Revenue Million Forecast, by Consumption Analysis 2020 & 2033
- Table 3: Global Hydrolyzed Feather Meal Industry Revenue Million Forecast, by Import Market Analysis (Value & Volume) 2020 & 2033
- Table 4: Global Hydrolyzed Feather Meal Industry Revenue Million Forecast, by Export Market Analysis (Value & Volume) 2020 & 2033
- Table 5: Global Hydrolyzed Feather Meal Industry Revenue Million Forecast, by Price Trend Analysis 2020 & 2033
- Table 6: Global Hydrolyzed Feather Meal Industry Revenue Million Forecast, by Region 2020 & 2033
- Table 7: Global Hydrolyzed Feather Meal Industry Revenue Million Forecast, by Production Analysis 2020 & 2033
- Table 8: Global Hydrolyzed Feather Meal Industry Revenue Million Forecast, by Consumption Analysis 2020 & 2033
- Table 9: Global Hydrolyzed Feather Meal Industry Revenue Million Forecast, by Import Market Analysis (Value & Volume) 2020 & 2033
- Table 10: Global Hydrolyzed Feather Meal Industry Revenue Million Forecast, by Export Market Analysis (Value & Volume) 2020 & 2033
- Table 11: Global Hydrolyzed Feather Meal Industry Revenue Million Forecast, by Price Trend Analysis 2020 & 2033
- Table 12: Global Hydrolyzed Feather Meal Industry Revenue Million Forecast, by Country 2020 & 2033
- Table 13: United States Hydrolyzed Feather Meal Industry Revenue (Million) Forecast, by Application 2020 & 2033
- Table 14: Canada Hydrolyzed Feather Meal Industry Revenue (Million) Forecast, by Application 2020 & 2033
- Table 15: Mexico Hydrolyzed Feather Meal Industry Revenue (Million) Forecast, by Application 2020 & 2033
- Table 16: Global Hydrolyzed Feather Meal Industry Revenue Million Forecast, by Production Analysis 2020 & 2033
- Table 17: Global Hydrolyzed Feather Meal Industry Revenue Million Forecast, by Consumption Analysis 2020 & 2033
- Table 18: Global Hydrolyzed Feather Meal Industry Revenue Million Forecast, by Import Market Analysis (Value & Volume) 2020 & 2033
- Table 19: Global Hydrolyzed Feather Meal Industry Revenue Million Forecast, by Export Market Analysis (Value & Volume) 2020 & 2033
- Table 20: Global Hydrolyzed Feather Meal Industry Revenue Million Forecast, by Price Trend Analysis 2020 & 2033
- Table 21: Global Hydrolyzed Feather Meal Industry Revenue Million Forecast, by Country 2020 & 2033
- Table 22: Brazil Hydrolyzed Feather Meal Industry Revenue (Million) Forecast, by Application 2020 & 2033
- Table 23: Argentina Hydrolyzed Feather Meal Industry Revenue (Million) Forecast, by Application 2020 & 2033
- Table 24: Rest of South America Hydrolyzed Feather Meal Industry Revenue (Million) Forecast, by Application 2020 & 2033
- Table 25: Global Hydrolyzed Feather Meal Industry Revenue Million Forecast, by Production Analysis 2020 & 2033
- Table 26: Global Hydrolyzed Feather Meal Industry Revenue Million Forecast, by Consumption Analysis 2020 & 2033
- Table 27: Global Hydrolyzed Feather Meal Industry Revenue Million Forecast, by Import Market Analysis (Value & Volume) 2020 & 2033
- Table 28: Global Hydrolyzed Feather Meal Industry Revenue Million Forecast, by Export Market Analysis (Value & Volume) 2020 & 2033
- Table 29: Global Hydrolyzed Feather Meal Industry Revenue Million Forecast, by Price Trend Analysis 2020 & 2033
- Table 30: Global Hydrolyzed Feather Meal Industry Revenue Million Forecast, by Country 2020 & 2033
- Table 31: United Kingdom Hydrolyzed Feather Meal Industry Revenue (Million) Forecast, by Application 2020 & 2033
- Table 32: Germany Hydrolyzed Feather Meal Industry Revenue (Million) Forecast, by Application 2020 & 2033
- Table 33: France Hydrolyzed Feather Meal Industry Revenue (Million) Forecast, by Application 2020 & 2033
- Table 34: Italy Hydrolyzed Feather Meal Industry Revenue (Million) Forecast, by Application 2020 & 2033
- Table 35: Spain Hydrolyzed Feather Meal Industry Revenue (Million) Forecast, by Application 2020 & 2033
- Table 36: Russia Hydrolyzed Feather Meal Industry Revenue (Million) Forecast, by Application 2020 & 2033
- Table 37: Benelux Hydrolyzed Feather Meal Industry Revenue (Million) Forecast, by Application 2020 & 2033
- Table 38: Nordics Hydrolyzed Feather Meal Industry Revenue (Million) Forecast, by Application 2020 & 2033
- Table 39: Rest of Europe Hydrolyzed Feather Meal Industry Revenue (Million) Forecast, by Application 2020 & 2033
- Table 40: Global Hydrolyzed Feather Meal Industry Revenue Million Forecast, by Production Analysis 2020 & 2033
- Table 41: Global Hydrolyzed Feather Meal Industry Revenue Million Forecast, by Consumption Analysis 2020 & 2033
- Table 42: Global Hydrolyzed Feather Meal Industry Revenue Million Forecast, by Import Market Analysis (Value & Volume) 2020 & 2033
- Table 43: Global Hydrolyzed Feather Meal Industry Revenue Million Forecast, by Export Market Analysis (Value & Volume) 2020 & 2033
- Table 44: Global Hydrolyzed Feather Meal Industry Revenue Million Forecast, by Price Trend Analysis 2020 & 2033
- Table 45: Global Hydrolyzed Feather Meal Industry Revenue Million Forecast, by Country 2020 & 2033
- Table 46: Turkey Hydrolyzed Feather Meal Industry Revenue (Million) Forecast, by Application 2020 & 2033
- Table 47: Israel Hydrolyzed Feather Meal Industry Revenue (Million) Forecast, by Application 2020 & 2033
- Table 48: GCC Hydrolyzed Feather Meal Industry Revenue (Million) Forecast, by Application 2020 & 2033
- Table 49: North Africa Hydrolyzed Feather Meal Industry Revenue (Million) Forecast, by Application 2020 & 2033
- Table 50: South Africa Hydrolyzed Feather Meal Industry Revenue (Million) Forecast, by Application 2020 & 2033
- Table 51: Rest of Middle East & Africa Hydrolyzed Feather Meal Industry Revenue (Million) Forecast, by Application 2020 & 2033
- Table 52: Global Hydrolyzed Feather Meal Industry Revenue Million Forecast, by Production Analysis 2020 & 2033
- Table 53: Global Hydrolyzed Feather Meal Industry Revenue Million Forecast, by Consumption Analysis 2020 & 2033
- Table 54: Global Hydrolyzed Feather Meal Industry Revenue Million Forecast, by Import Market Analysis (Value & Volume) 2020 & 2033
- Table 55: Global Hydrolyzed Feather Meal Industry Revenue Million Forecast, by Export Market Analysis (Value & Volume) 2020 & 2033
- Table 56: Global Hydrolyzed Feather Meal Industry Revenue Million Forecast, by Price Trend Analysis 2020 & 2033
- Table 57: Global Hydrolyzed Feather Meal Industry Revenue Million Forecast, by Country 2020 & 2033
- Table 58: China Hydrolyzed Feather Meal Industry Revenue (Million) Forecast, by Application 2020 & 2033
- Table 59: India Hydrolyzed Feather Meal Industry Revenue (Million) Forecast, by Application 2020 & 2033
- Table 60: Japan Hydrolyzed Feather Meal Industry Revenue (Million) Forecast, by Application 2020 & 2033
- Table 61: South Korea Hydrolyzed Feather Meal Industry Revenue (Million) Forecast, by Application 2020 & 2033
- Table 62: ASEAN Hydrolyzed Feather Meal Industry Revenue (Million) Forecast, by Application 2020 & 2033
- Table 63: Oceania Hydrolyzed Feather Meal Industry Revenue (Million) Forecast, by Application 2020 & 2033
- Table 64: Rest of Asia Pacific Hydrolyzed Feather Meal Industry Revenue (Million) Forecast, by Application 2020 & 2033
Frequently Asked Questions
1. What is the projected Compound Annual Growth Rate (CAGR) of the Hydrolyzed Feather Meal Industry?
The projected CAGR is approximately 8.60%.
2. Which companies are prominent players in the Hydrolyzed Feather Meal Industry?
Key companies in the market include Darling Ingredients, K-Pro U, Valley Proteins, The Boyer Valley Company, North Country Organics, JG Pears, Kleingarn Agrarprodukte, FASA Group.
3. What are the main segments of the Hydrolyzed Feather Meal Industry?
The market segments include Production Analysis, Consumption Analysis, Import Market Analysis (Value & Volume), Export Market Analysis (Value & Volume), Price Trend Analysis.
4. Can you provide details about the market size?
The market size is estimated to be USD 589.51 Million as of 2022.
5. What are some drivers contributing to market growth?
Adoption of Organic and Eco-friendly Farming Practices; Declining Area of Arable Land and Rising Food Security Concerns.
6. What are the notable trends driving market growth?
Increasing demand for organic farming accelerating feather meal market.
7. Are there any restraints impacting market growth?
High Demand for Conventional and Synthetic Products; Lack of Awareness and Other Factors Limiting the Adoption of Agricultural Inoculants.
8. Can you provide examples of recent developments in the market?
August 2022: The University of Danang - University of Science and Technology has successfully made a type of bio-organic fertilizer from chicken feathers with the desire to reduce environmental pollution from by-products such as chicken feathers.
9. What pricing options are available for accessing the report?
Pricing options include single-user, multi-user, and enterprise licenses priced at USD 4750, USD 5250, and USD 8750 respectively.
10. Is the market size provided in terms of value or volume?
The market size is provided in terms of value, measured in Million.
11. Are there any specific market keywords associated with the report?
Yes, the market keyword associated with the report is "Hydrolyzed Feather Meal Industry," which aids in identifying and referencing the specific market segment covered.
12. How do I determine which pricing option suits my needs best?
The pricing options vary based on user requirements and access needs. Individual users may opt for single-user licenses, while businesses requiring broader access may choose multi-user or enterprise licenses for cost-effective access to the report.
13. Are there any additional resources or data provided in the Hydrolyzed Feather Meal Industry report?
While the report offers comprehensive insights, it's advisable to review the specific contents or supplementary materials provided to ascertain if additional resources or data are available.
14. How can I stay updated on further developments or reports in the Hydrolyzed Feather Meal Industry?
To stay informed about further developments, trends, and reports in the Hydrolyzed Feather Meal Industry, consider subscribing to industry newsletters, following relevant companies and organizations, or regularly checking reputable industry news sources and publications.
Methodology
Step 1 - Identification of Relevant Samples Size from Population Database


Step 2 - Approaches for Defining Global Market Size (Value, Volume* & Price*)

Note*: In applicable scenarios
Step 3 - Data Sources
Primary Research
- Web Analytics
- Survey Reports
- Research Institute
- Latest Research Reports
- Opinion Leaders
Secondary Research
- Annual Reports
- White Paper
- Latest Press Release
- Industry Association
- Paid Database
- Investor Presentations

Step 4 - Data Triangulation
Involves using different sources of information in order to increase the validity of a study
These sources are likely to be stakeholders in a program - participants, other researchers, program staff, other community members, and so on.
Then we put all data in single framework & apply various statistical tools to find out the dynamic on the market.
During the analysis stage, feedback from the stakeholder groups would be compared to determine areas of agreement as well as areas of divergence