

Key Insights
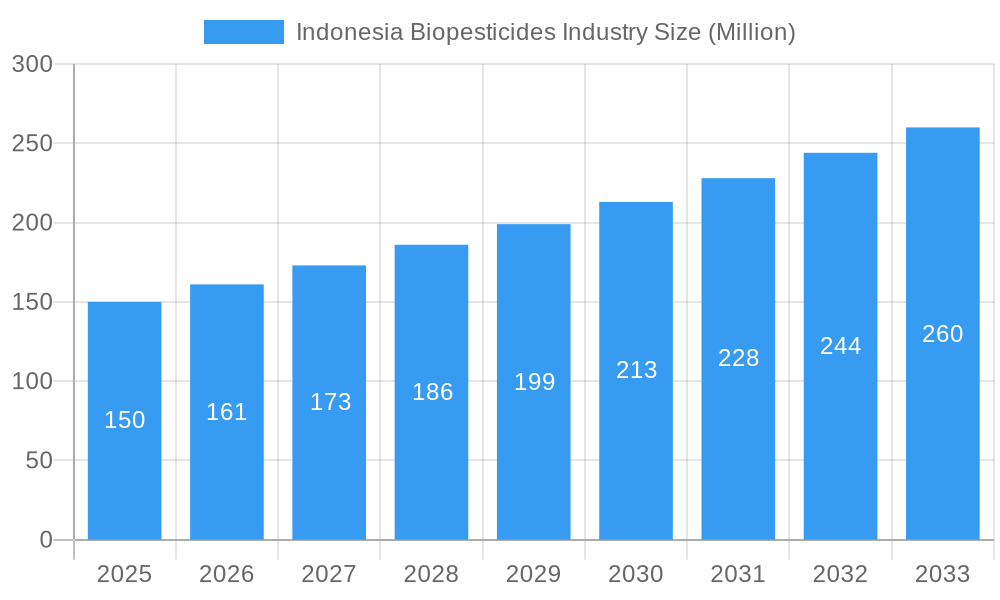
The Indonesian biopesticides market, valued at approximately $150 million in 2025, is experiencing robust growth, projected to reach $250 million by 2033, exhibiting a Compound Annual Growth Rate (CAGR) of 6.80%. This expansion is driven by several factors. Firstly, the increasing awareness of the environmental and health risks associated with synthetic pesticides is fueling consumer demand for safer, more sustainable alternatives. Secondly, the Indonesian government's initiatives promoting sustainable agriculture and reducing reliance on chemical pesticides are providing a supportive regulatory environment. Furthermore, the rising prevalence of crop diseases and pests, coupled with the growing demand for higher crop yields, necessitates the adoption of effective and environmentally friendly pest control solutions. The biopesticides market is segmented by product type (bioherbicides, bioinsecticides, biofungicides, and others), mode of application (foliar spray, seed treatment, soil treatment, and post-harvest), and application area (crop-based and non-crop-based). Bioinsecticides currently dominate the market share, followed by biofungicides, reflecting the significant pest and disease pressure on Indonesian crops like rice, palm oil, and coffee. Key players like FMC Corporation, Marrone Bio Innovations, Nufarm, and others are actively investing in research and development, expanding their product portfolios, and establishing strong distribution networks to cater to this growing demand.
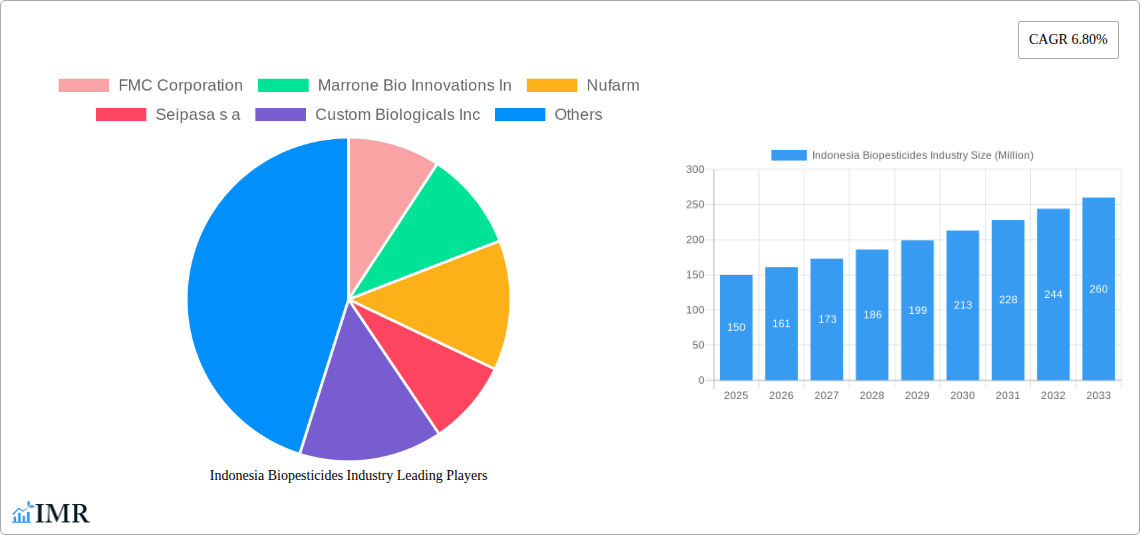
Indonesia Biopesticides Industry Market Size (In Million)
The growth trajectory of the Indonesian biopesticides market is influenced by several trends. The increasing adoption of precision agriculture techniques, coupled with the development of innovative biopesticide formulations, is enhancing the efficacy and target specificity of these products. Moreover, the rising adoption of integrated pest management (IPM) strategies, which integrate biopesticides with other pest control methods, contributes significantly to market growth. While the market faces some challenges such as relatively high initial investment costs for farmers transitioning from conventional pesticides and the potential for inconsistent product efficacy depending on environmental conditions, these limitations are being actively addressed by technological advancements and farmer education programs, driving consistent market expansion throughout the forecast period. The market is likely to witness further consolidation as larger companies acquire smaller players and expand their reach.
Indonesia Biopesticides Industry Company Market Share
Indonesia Biopesticides Industry: A Comprehensive Market Report (2019-2033)
This comprehensive report provides an in-depth analysis of the Indonesia biopesticides industry, offering invaluable insights for stakeholders, investors, and industry professionals. Covering the period 2019-2033, with a focus on 2025, this report meticulously examines market dynamics, growth trends, key players, and future opportunities within the Indonesian biopesticide landscape. The report segments the market by product type (Bioherbicide, Bioinsecticide, Biofungicide, Others), mode of application (Foliar Spray, Seed Treatment, Soil Treatment, Post-harvest), and application (Crop-based, Non-crop-based). The market size is presented in Million units.
Indonesia Biopesticides Industry Market Dynamics & Structure
The Indonesian biopesticides market is experiencing significant growth, driven by increasing awareness of environmental concerns and the rising demand for sustainable agricultural practices. Market concentration is moderate, with several key players vying for market share. Technological innovation, particularly in biopesticide formulation and delivery systems, is a significant driver. The regulatory framework is evolving to support the adoption of biopesticides, although challenges remain in streamlining the approval process. Biopesticides are facing competition from conventional chemical pesticides, but the growing consumer preference for organic and sustainable produce is favoring biopesticide adoption. M&A activity in the sector is moderate, with larger players strategically acquiring smaller companies to expand their product portfolios and market reach. The end-user demographics are shifting towards larger, more technologically advanced farms.
- Market Concentration: Moderately concentrated, with top 5 players holding approximately xx% market share in 2025.
- Technological Innovation: Focus on enhancing efficacy, improving shelf life, and developing targeted delivery systems.
- Regulatory Framework: Evolving but requires further streamlining for faster product approvals.
- Competitive Substitutes: Conventional chemical pesticides pose a significant competitive threat.
- End-User Demographics: Shifting towards larger commercial farms adopting modern agricultural techniques.
- M&A Activity: Moderate level of mergers and acquisitions, primarily driven by strategic expansion. Estimated xx deals between 2019 and 2024.
Indonesia Biopesticides Industry Growth Trends & Insights
The Indonesian biopesticides market has witnessed robust growth during the historical period (2019-2024), fueled by factors such as government initiatives promoting sustainable agriculture, increasing consumer demand for organic produce, and growing awareness of the harmful effects of chemical pesticides. The market size is projected to grow at a Compound Annual Growth Rate (CAGR) of xx% during the forecast period (2025-2033), driven by rising disposable incomes, increasing agricultural output, and government support for sustainable farming practices. Technological advancements in biopesticide formulation and application technologies are further accelerating market adoption. Consumer behavior is shifting towards environmentally friendly products, favoring biopesticides over chemical alternatives. Market penetration of biopesticides in the Indonesian agricultural sector is steadily increasing, although it still has significant potential for future growth.
Dominant Regions, Countries, or Segments in Indonesia Biopesticides Industry
The Java island dominates the Indonesian biopesticides market due to its high agricultural output and concentration of farming activities. Within product segments, bioinsecticides hold the largest market share, followed by biofungicides and bioherbicides. The foliar spray mode of application accounts for the significant portion of the market. Crop-based applications are currently dominant, but non-crop applications are exhibiting faster growth rates.
- Key Drivers:
- High agricultural output in Java.
- Government initiatives promoting sustainable agriculture.
- Growing demand for organic produce.
- Dominance Factors:
- High agricultural density in Java.
- Established distribution networks.
- Early adoption of biopesticides by farmers in specific regions.
- Bioinsecticide segment holds the largest market share, estimated at xx Million units in 2025, driven by the prevalence of pest infestations in various crops.
Indonesia Biopesticides Industry Product Landscape
The Indonesian biopesticide market showcases a diverse range of products, including bioinsecticides derived from Bacillus thuringiensis, biofungicides based on Trichoderma spp., and bioherbicides utilizing natural plant extracts. These products are formulated for various applications, including foliar sprays, seed treatments, and soil treatments. Recent innovations focus on enhancing efficacy, improving shelf life, and developing targeted delivery systems to maximize the effectiveness and minimize environmental impact. Unique selling propositions include environmentally friendly formulations, reduced pesticide residues, and enhanced crop yield.
Key Drivers, Barriers & Challenges in Indonesia Biopesticides Industry
Key Drivers:
- Growing consumer demand for organic produce.
- Government support for sustainable agriculture.
- Increasing awareness of the harmful effects of chemical pesticides.
- Technological advancements leading to improved efficacy and affordability of biopesticides.
Key Challenges & Restraints:
- High initial cost compared to chemical pesticides.
- Limited awareness among farmers about the benefits of biopesticides.
- Relatively shorter shelf life compared to some chemical pesticides.
- Supply chain complexities for sourcing raw materials and distribution.
- Regulatory hurdles and approval processes can be lengthy and complex. The estimated time to obtain regulatory approval in 2025 is xx months.
Emerging Opportunities in Indonesia Biopesticides Industry
Untapped market potential exists in non-crop applications, such as pest control in urban areas and public health applications. Innovative applications, such as combining biopesticides with other sustainable agricultural practices, hold significant potential. Evolving consumer preferences for organic and sustainably produced products present substantial growth opportunities. Furthermore, the development of new biopesticide formulations targeted towards specific pest and disease pressures can unlock significant market share.
Growth Accelerators in the Indonesia Biopesticides Industry
Technological breakthroughs in biopesticide formulation and delivery systems are accelerating market growth. Strategic partnerships between research institutions, biopesticide manufacturers, and agricultural extension services are facilitating wider adoption. Expanding the market reach through effective distribution networks and tailored marketing strategies targeting different farmer segments will accelerate growth.
Key Players Shaping the Indonesia Biopesticides Industry Market
- FMC Corporation
- Marrone Bio Innovations Inc
- Nufarm
- Seipasa s.a
- Custom Biologicals Inc
- Bayer CropScience AG
- Koppert Biological Systems
- BASF SE
Notable Milestones in Indonesia Biopesticides Industry Sector
- 2020: Government launches a program to promote sustainable agriculture, including increased support for biopesticide use.
- 2022: A major biopesticide manufacturer expands its production facility in Indonesia.
- 2023: Introduction of a new biopesticide formulation with improved efficacy against a major rice pest.
- 2024: Several successful collaborations between research institutions and biopesticide companies lead to the development of novel products.
In-Depth Indonesia Biopesticides Industry Market Outlook
The Indonesian biopesticides market is poised for continued robust growth driven by favorable government policies, heightened consumer awareness, and technological advancements. Strategic investments in research and development, coupled with effective marketing and distribution strategies, will be crucial for maximizing market potential. The increasing adoption of sustainable agricultural practices and growing preference for organic produce present considerable opportunities for market expansion and innovation. The market is expected to reach xx Million units by 2033.
Indonesia Biopesticides Industry Segmentation
- 1. Production Analysis
- 2. Consumption Analysis
- 3. Import Market Analysis (Value & Volume)
- 4. Export Market Analysis (Value & Volume)
- 5. Price Trend Analysis
Indonesia Biopesticides Industry Segmentation By Geography
- 1. Indonesia
Indonesia Biopesticides Industry Regional Market Share
Geographic Coverage of Indonesia Biopesticides Industry
Indonesia Biopesticides Industry REPORT HIGHLIGHTS
| Aspects | Details |
|---|---|
| Study Period | 2020-2034 |
| Base Year | 2025 |
| Estimated Year | 2026 |
| Forecast Period | 2026-2034 |
| Historical Period | 2020-2025 |
| Growth Rate | CAGR of 6.80% from 2020-2034 |
| Segmentation |
|
Table of Contents
- 1. Introduction
- 1.1. Research Scope
- 1.2. Market Segmentation
- 1.3. Research Methodology
- 1.4. Definitions and Assumptions
- 2. Executive Summary
- 2.1. Introduction
- 3. Market Dynamics
- 3.1. Introduction
- 3.2. Market Drivers
- 3.2.1. Decreasing Per Capita Arable Land; Increased Demand for Food
- 3.3. Market Restrains
- 3.3.1. High Initial Investments; Requirement of Precision Agriculture
- 3.4. Market Trends
- 3.4.1. Rising Consumer Preference Towards Organic Products
- 4. Market Factor Analysis
- 4.1. Porters Five Forces
- 4.2. Supply/Value Chain
- 4.3. PESTEL analysis
- 4.4. Market Entropy
- 4.5. Patent/Trademark Analysis
- 5. Indonesia Biopesticides Industry Analysis, Insights and Forecast, 2020-2032
- 5.1. Market Analysis, Insights and Forecast - by Production Analysis
- 5.2. Market Analysis, Insights and Forecast - by Consumption Analysis
- 5.3. Market Analysis, Insights and Forecast - by Import Market Analysis (Value & Volume)
- 5.4. Market Analysis, Insights and Forecast - by Export Market Analysis (Value & Volume)
- 5.5. Market Analysis, Insights and Forecast - by Price Trend Analysis
- 5.6. Market Analysis, Insights and Forecast - by Region
- 5.6.1. Indonesia
- 5.1. Market Analysis, Insights and Forecast - by Production Analysis
- 6. Competitive Analysis
- 6.1. Market Share Analysis 2025
- 6.2. Company Profiles
- 6.2.1 FMC Corporation
- 6.2.1.1. Overview
- 6.2.1.2. Products
- 6.2.1.3. SWOT Analysis
- 6.2.1.4. Recent Developments
- 6.2.1.5. Financials (Based on Availability)
- 6.2.2 Marrone Bio Innovations In
- 6.2.2.1. Overview
- 6.2.2.2. Products
- 6.2.2.3. SWOT Analysis
- 6.2.2.4. Recent Developments
- 6.2.2.5. Financials (Based on Availability)
- 6.2.3 Nufarm
- 6.2.3.1. Overview
- 6.2.3.2. Products
- 6.2.3.3. SWOT Analysis
- 6.2.3.4. Recent Developments
- 6.2.3.5. Financials (Based on Availability)
- 6.2.4 Seipasa s a
- 6.2.4.1. Overview
- 6.2.4.2. Products
- 6.2.4.3. SWOT Analysis
- 6.2.4.4. Recent Developments
- 6.2.4.5. Financials (Based on Availability)
- 6.2.5 Custom Biologicals Inc
- 6.2.5.1. Overview
- 6.2.5.2. Products
- 6.2.5.3. SWOT Analysis
- 6.2.5.4. Recent Developments
- 6.2.5.5. Financials (Based on Availability)
- 6.2.6 Bayer CropScience AG
- 6.2.6.1. Overview
- 6.2.6.2. Products
- 6.2.6.3. SWOT Analysis
- 6.2.6.4. Recent Developments
- 6.2.6.5. Financials (Based on Availability)
- 6.2.7 Koppert Biological Systems
- 6.2.7.1. Overview
- 6.2.7.2. Products
- 6.2.7.3. SWOT Analysis
- 6.2.7.4. Recent Developments
- 6.2.7.5. Financials (Based on Availability)
- 6.2.8 BASF SE
- 6.2.8.1. Overview
- 6.2.8.2. Products
- 6.2.8.3. SWOT Analysis
- 6.2.8.4. Recent Developments
- 6.2.8.5. Financials (Based on Availability)
- 6.2.1 FMC Corporation
List of Figures
- Figure 1: Indonesia Biopesticides Industry Revenue Breakdown (Million, %) by Product 2025 & 2033
- Figure 2: Indonesia Biopesticides Industry Share (%) by Company 2025
List of Tables
- Table 1: Indonesia Biopesticides Industry Revenue Million Forecast, by Production Analysis 2020 & 2033
- Table 2: Indonesia Biopesticides Industry Volume Kiloton Forecast, by Production Analysis 2020 & 2033
- Table 3: Indonesia Biopesticides Industry Revenue Million Forecast, by Consumption Analysis 2020 & 2033
- Table 4: Indonesia Biopesticides Industry Volume Kiloton Forecast, by Consumption Analysis 2020 & 2033
- Table 5: Indonesia Biopesticides Industry Revenue Million Forecast, by Import Market Analysis (Value & Volume) 2020 & 2033
- Table 6: Indonesia Biopesticides Industry Volume Kiloton Forecast, by Import Market Analysis (Value & Volume) 2020 & 2033
- Table 7: Indonesia Biopesticides Industry Revenue Million Forecast, by Export Market Analysis (Value & Volume) 2020 & 2033
- Table 8: Indonesia Biopesticides Industry Volume Kiloton Forecast, by Export Market Analysis (Value & Volume) 2020 & 2033
- Table 9: Indonesia Biopesticides Industry Revenue Million Forecast, by Price Trend Analysis 2020 & 2033
- Table 10: Indonesia Biopesticides Industry Volume Kiloton Forecast, by Price Trend Analysis 2020 & 2033
- Table 11: Indonesia Biopesticides Industry Revenue Million Forecast, by Region 2020 & 2033
- Table 12: Indonesia Biopesticides Industry Volume Kiloton Forecast, by Region 2020 & 2033
- Table 13: Indonesia Biopesticides Industry Revenue Million Forecast, by Production Analysis 2020 & 2033
- Table 14: Indonesia Biopesticides Industry Volume Kiloton Forecast, by Production Analysis 2020 & 2033
- Table 15: Indonesia Biopesticides Industry Revenue Million Forecast, by Consumption Analysis 2020 & 2033
- Table 16: Indonesia Biopesticides Industry Volume Kiloton Forecast, by Consumption Analysis 2020 & 2033
- Table 17: Indonesia Biopesticides Industry Revenue Million Forecast, by Import Market Analysis (Value & Volume) 2020 & 2033
- Table 18: Indonesia Biopesticides Industry Volume Kiloton Forecast, by Import Market Analysis (Value & Volume) 2020 & 2033
- Table 19: Indonesia Biopesticides Industry Revenue Million Forecast, by Export Market Analysis (Value & Volume) 2020 & 2033
- Table 20: Indonesia Biopesticides Industry Volume Kiloton Forecast, by Export Market Analysis (Value & Volume) 2020 & 2033
- Table 21: Indonesia Biopesticides Industry Revenue Million Forecast, by Price Trend Analysis 2020 & 2033
- Table 22: Indonesia Biopesticides Industry Volume Kiloton Forecast, by Price Trend Analysis 2020 & 2033
- Table 23: Indonesia Biopesticides Industry Revenue Million Forecast, by Country 2020 & 2033
- Table 24: Indonesia Biopesticides Industry Volume Kiloton Forecast, by Country 2020 & 2033
Frequently Asked Questions
1. What is the projected Compound Annual Growth Rate (CAGR) of the Indonesia Biopesticides Industry?
The projected CAGR is approximately 6.80%.
2. Which companies are prominent players in the Indonesia Biopesticides Industry?
Key companies in the market include FMC Corporation, Marrone Bio Innovations In, Nufarm, Seipasa s a, Custom Biologicals Inc, Bayer CropScience AG, Koppert Biological Systems, BASF SE.
3. What are the main segments of the Indonesia Biopesticides Industry?
The market segments include Production Analysis, Consumption Analysis, Import Market Analysis (Value & Volume), Export Market Analysis (Value & Volume), Price Trend Analysis.
4. Can you provide details about the market size?
The market size is estimated to be USD XX Million as of 2022.
5. What are some drivers contributing to market growth?
Decreasing Per Capita Arable Land; Increased Demand for Food.
6. What are the notable trends driving market growth?
Rising Consumer Preference Towards Organic Products.
7. Are there any restraints impacting market growth?
High Initial Investments; Requirement of Precision Agriculture.
8. Can you provide examples of recent developments in the market?
N/A
9. What pricing options are available for accessing the report?
Pricing options include single-user, multi-user, and enterprise licenses priced at USD 3800, USD 4500, and USD 5800 respectively.
10. Is the market size provided in terms of value or volume?
The market size is provided in terms of value, measured in Million and volume, measured in Kiloton.
11. Are there any specific market keywords associated with the report?
Yes, the market keyword associated with the report is "Indonesia Biopesticides Industry," which aids in identifying and referencing the specific market segment covered.
12. How do I determine which pricing option suits my needs best?
The pricing options vary based on user requirements and access needs. Individual users may opt for single-user licenses, while businesses requiring broader access may choose multi-user or enterprise licenses for cost-effective access to the report.
13. Are there any additional resources or data provided in the Indonesia Biopesticides Industry report?
While the report offers comprehensive insights, it's advisable to review the specific contents or supplementary materials provided to ascertain if additional resources or data are available.
14. How can I stay updated on further developments or reports in the Indonesia Biopesticides Industry?
To stay informed about further developments, trends, and reports in the Indonesia Biopesticides Industry, consider subscribing to industry newsletters, following relevant companies and organizations, or regularly checking reputable industry news sources and publications.
Methodology
Step 1 - Identification of Relevant Samples Size from Population Database


Step 2 - Approaches for Defining Global Market Size (Value, Volume* & Price*)

Note*: In applicable scenarios
Step 3 - Data Sources
Primary Research
- Web Analytics
- Survey Reports
- Research Institute
- Latest Research Reports
- Opinion Leaders
Secondary Research
- Annual Reports
- White Paper
- Latest Press Release
- Industry Association
- Paid Database
- Investor Presentations

Step 4 - Data Triangulation
Involves using different sources of information in order to increase the validity of a study
These sources are likely to be stakeholders in a program - participants, other researchers, program staff, other community members, and so on.
Then we put all data in single framework & apply various statistical tools to find out the dynamic on the market.
During the analysis stage, feedback from the stakeholder groups would be compared to determine areas of agreement as well as areas of divergence