

Key Insights
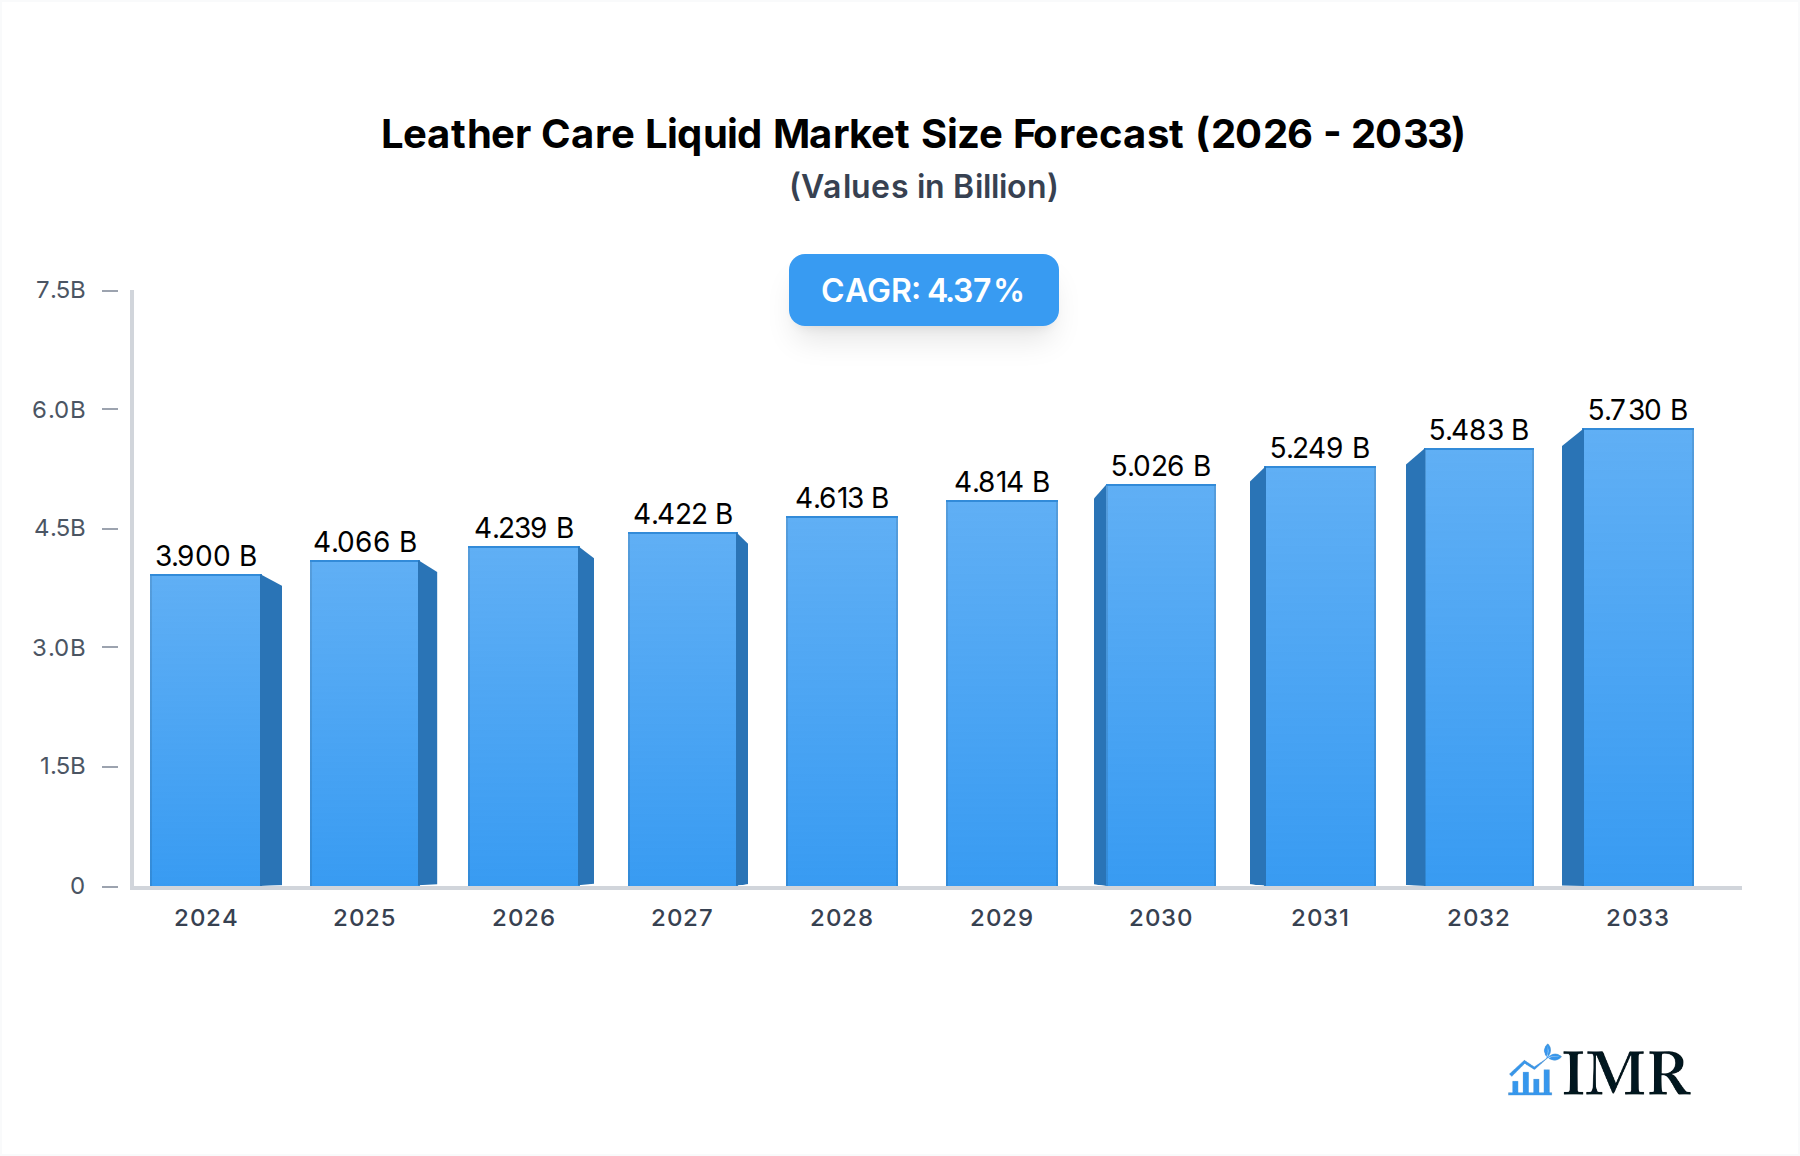
The global leather care liquid market is poised for steady expansion, with an estimated market size of USD 3.9 billion in 2024. This growth trajectory is underpinned by a projected Compound Annual Growth Rate (CAGR) of 4.3% from 2025 to 2033. This sustained increase is primarily driven by the growing consumer appreciation for luxury and durable goods, particularly in the automotive and furniture sectors. As vehicles become more sophisticated and interior aesthetics gain prominence, the demand for effective leather conditioning and protection solutions rises. Similarly, the furniture industry benefits from an increasing focus on maintaining the longevity and premium appearance of leather upholstery. The expanding middle class across emerging economies further fuels this demand, as more consumers invest in high-quality leather products for their homes and vehicles. Furthermore, a heightened awareness regarding the benefits of regular leather maintenance, preventing cracking, fading, and wear, is contributing to increased product adoption.

Leather Care Liquid Market Size (In Billion)
Several key trends are shaping the leather care liquid market. The rise of eco-friendly and natural formulations is a significant development, catering to environmentally conscious consumers and regulatory pressures. Brands are increasingly investing in biodegradable ingredients and sustainable packaging to capture this growing segment. Innovations in product technology, such as advanced cleaning agents and protective coatings that offer enhanced UV resistance and water repellency, are also differentiating offerings and driving market value. Geographically, the Asia Pacific region, led by China and India, presents substantial growth opportunities due to its rapidly expanding automotive and furniture industries and a burgeoning consumer base with increasing disposable incomes. While the market benefits from strong drivers, restraints such as the availability of alternative materials and the initial cost of high-quality leather products could temper rapid expansion. However, the inherent durability and aesthetic appeal of genuine leather continue to ensure its preference, thereby supporting the consistent growth of the leather care liquid market.
Leather Care Liquid Company Market Share
Comprehensive Report: Leather Care Liquid Market Analysis and Forecast (2019-2033)
This in-depth report provides a strategic overview of the global Leather Care Liquid market, offering critical insights for industry stakeholders. Spanning the historical period of 2019-2024, with a base year of 2025 and a robust forecast period extending to 2033, this analysis delves into market dynamics, growth trends, regional dominance, product innovation, and key players. Leveraging advanced analytical methodologies, the report aims to equip businesses with the knowledge to navigate this evolving landscape and capitalize on emerging opportunities within both the parent and child market segments.
Leather Care Liquid Market Dynamics & Structure
The global Leather Care Liquid market exhibits a moderately concentrated structure, with key players actively investing in technological advancements and product differentiation to capture market share. The primary drivers of innovation include the demand for extended leather product lifespan, aesthetic enhancement, and protective properties against environmental factors. Regulatory frameworks, while generally supportive of consumer safety, can influence ingredient formulations and packaging, necessitating continuous R&D. Competitive product substitutes, such as leather wipes and sprays with different formulations, offer alternatives but often lack the deep conditioning and long-term protection provided by dedicated liquids. End-user demographics are increasingly diverse, encompassing automotive enthusiasts seeking to preserve vehicle interiors, homeowners valuing furniture longevity, and specialized industries requiring meticulous leather maintenance. Mergers and acquisitions (M&A) activity, while not rampant, are strategically employed by larger entities to acquire niche technologies or expand their product portfolios. For instance, smaller, innovative brands are sometimes acquired to gain access to proprietary formulations.
- Market Concentration: Moderately concentrated, with top players holding significant, yet not absolute, market share.
- Technological Innovation: Driven by demand for enhanced durability, protection, and aesthetic appeal.
- Regulatory Frameworks: Focus on consumer safety and ingredient transparency.
- Competitive Product Substitutes: Wipes and sprays offer convenience but less comprehensive care.
- End-User Demographics: Broad appeal across automotive, furniture, and specialized sectors.
- M&A Trends: Strategic acquisitions to enhance technological capabilities and market reach.
Leather Care Liquid Growth Trends & Insights
The global Leather Care Liquid market is poised for significant expansion, projected to witness a Compound Annual Growth Rate (CAGR) of xx% from 2025 to 2033. This growth is underpinned by a confluence of factors, including rising disposable incomes in emerging economies, increased consumer awareness regarding the long-term value of leather goods, and a growing appreciation for premium product maintenance. The adoption rate for specialized leather care liquids has been steadily increasing as consumers move beyond basic cleaning to embrace comprehensive care routines that preserve the aesthetic and structural integrity of their leather investments. Technological disruptions, such as the development of advanced, eco-friendly formulations that offer superior protection without harsh chemicals, are playing a pivotal role in shaping product offerings and consumer preferences. Furthermore, evolving consumer behavior is marked by a greater emphasis on sustainability and product longevity, driving demand for high-quality, durable leather care solutions. The market penetration of leather care liquids, particularly in developing regions, is expected to surge as awareness and accessibility improve.
Dominant Regions, Countries, or Segments in Leather Care Liquid
The Automobile Application segment is anticipated to be a dominant force in the global Leather Care Liquid market, driving significant growth throughout the forecast period. This dominance is fueled by several key factors, including the increasing sophistication of automotive interiors, where leather seats and trim are standard in many mid-to-high-end vehicles. The desire to maintain the pristine condition of these expensive components, coupled with a rising trend in car customization and preservation, directly translates into a robust demand for specialized leather care liquids. Economic policies in developed nations often encourage vehicle longevity and aesthetic upkeep, further bolstering this segment. Infrastructure development, particularly the expansion of premium car detailing services and mobile car care solutions, also contributes to the widespread availability and adoption of these products.
- Automobile Application: Expected to lead market growth due to the prevalence of leather interiors and consumer focus on vehicle aesthetics and resale value.
- Market Share: Estimated to hold xx% of the total market by 2033.
- Growth Potential: Driven by advancements in automotive interior materials and consumer demand for premium detailing.
- Furniture Application: A significant contributor, supported by an increasing trend towards investing in high-quality, durable home furnishings.
- Market Share: Projected to account for xx% of the market by 2033.
- Growth Potential: Fueled by the home decor market and a growing awareness of furniture maintenance.
- Others Segment: Encompassing diverse applications like leather apparel, footwear, and accessories, this segment offers steady growth driven by fashion trends and the premiumization of personal items.
The Maintenance Liquid Type is expected to maintain its leadership within the Leather Care Liquid market. This is attributed to its fundamental role in preserving the condition of leather goods over time, preventing cracking, fading, and general wear and tear. Consumers increasingly understand that regular maintenance is crucial for extending the lifespan of their leather investments, from car seats to sofas and apparel.
- Maintenance Liquid Type: Will continue to dominate due to its essential role in long-term leather preservation.
- Market Share: Estimated to hold xx% of the market by 2033.
- Growth Drivers: Consumer focus on product longevity and preventative care.
- Cleansing Fluid Type: While important for initial dirt removal, its growth is expected to be more moderate compared to maintenance liquids, often used in conjunction with or as a precursor to conditioning products.
- Market Share: Projected to represent xx% of the market by 2033.
- Growth Drivers: Demand for effective stain removal and initial cleaning of leather goods.
Leather Care Liquid Product Landscape
The product landscape for Leather Care Liquids is characterized by continuous innovation, with manufacturers focusing on developing formulations that offer enhanced protection, rejuvenation, and ease of use. Advanced solutions incorporate nanotechnology for superior water and stain repellency, alongside UV inhibitors to prevent fading. Biodegradable and eco-friendly ingredients are increasingly prevalent, appealing to environmentally conscious consumers. Unique selling propositions often lie in specialized formulas tailored to specific leather types (e.g., aniline, nubuck) and their unique care requirements. Performance metrics are benchmarked against criteria such as penetration depth, color enhancement, and long-term durability, with leading products demonstrating efficacy in preventing premature wear and tear.
Key Drivers, Barriers & Challenges in Leather Care Liquid
Key Drivers:
- Growing Consumer Awareness: Increased understanding of the benefits of proper leather maintenance for product longevity and aesthetics.
- Premiumization Trend: A rising demand for high-quality leather goods across automotive, furniture, and fashion sectors, necessitating specialized care.
- Technological Advancements: Development of innovative, effective, and eco-friendly formulations.
- Economic Growth: Higher disposable incomes in emerging markets leading to increased purchasing power for premium care products.
Barriers & Challenges:
- High Cost of Premium Products: The perceived or actual higher cost of specialized leather care liquids can be a deterrent for some consumers.
- Market Saturation: Intense competition from established brands and the proliferation of generic alternatives can make differentiation challenging.
- Consumer Education Gap: Some consumers may still lack comprehensive knowledge about the specific needs of different leather types and the benefits of specialized care.
- Supply Chain Volatility: Fluctuations in raw material costs and availability can impact production and pricing.
- Regulatory Hurdles: Evolving regulations regarding chemical formulations and environmental impact can necessitate product reformulation.
Emerging Opportunities in Leather Care Liquid
Emerging opportunities in the Leather Care Liquid market lie in the development of smart, self-healing leather care solutions that can autonomously repair minor abrasions. Untapped markets in developing economies with a rapidly growing middle class and increasing ownership of leather goods present significant potential. The increasing demand for vegan leather alternatives also opens avenues for specialized care products designed for these innovative materials. Furthermore, the integration of IoT in automotive and home furnishings creates possibilities for personalized leather care recommendations and automated maintenance schedules, driven by smart sensors within the products themselves.
Growth Accelerators in the Leather Care Liquid Industry
The long-term growth of the Leather Care Liquid industry is significantly accelerated by breakthroughs in material science, leading to the creation of advanced protective and restorative formulas. Strategic partnerships between leather manufacturers and chemical companies are crucial for developing integrated care solutions. Market expansion strategies, particularly targeting the burgeoning middle class in Asia-Pacific and Latin America, represent a substantial growth catalyst. The increasing focus on sustainability and the development of plant-based, biodegradable leather care products also serve as a significant growth accelerator, aligning with evolving consumer values and regulatory pressures.
Notable Milestones in Leather Care Liquid Sector
- 2019: Increased consumer interest in sustainable and eco-friendly cleaning products, leading to the development of more natural leather care formulations.
- 2020: COVID-19 pandemic led to a surge in home improvement and car detailing activities, boosting demand for home-use leather care products.
- 2021: Introduction of advanced nano-technology-based leather protection sprays offering enhanced water and stain resistance.
- 2022: Major players begin to invest in R&D for biodegradable and plant-based leather care ingredients to meet growing environmental concerns.
- 2023: Rise of direct-to-consumer (DTC) brands offering specialized leather care kits, enhancing accessibility and customer engagement.
- 2024: Growing adoption of subscription models for recurring purchase of leather care liquids, particularly in the automotive detailing segment.
In-Depth Leather Care Liquid Market Outlook
The Leather Care Liquid market is on an upward trajectory, propelled by sustained consumer demand for product longevity and aesthetic preservation. Growth accelerators such as innovative, eco-conscious formulations and strategic market expansion into emerging economies will define the future landscape. The increasing integration of smart technologies within leather goods will unlock novel opportunities for personalized and automated care solutions. Industry players focusing on sustainability, advanced performance, and targeted product development for specific leather types and applications are best positioned for success in this dynamic and evolving market.
Leather Care Liquid Segmentation
-
1. Application
- 1.1. Automobile
- 1.2. Furniture
- 1.3. Others
-
2. Types
- 2.1. Maintenance Liquid
- 2.2. Cleansing Fluid
Leather Care Liquid Segmentation By Geography
-
1. North America
- 1.1. United States
- 1.2. Canada
- 1.3. Mexico
-
2. South America
- 2.1. Brazil
- 2.2. Argentina
- 2.3. Rest of South America
-
3. Europe
- 3.1. United Kingdom
- 3.2. Germany
- 3.3. France
- 3.4. Italy
- 3.5. Spain
- 3.6. Russia
- 3.7. Benelux
- 3.8. Nordics
- 3.9. Rest of Europe
-
4. Middle East & Africa
- 4.1. Turkey
- 4.2. Israel
- 4.3. GCC
- 4.4. North Africa
- 4.5. South Africa
- 4.6. Rest of Middle East & Africa
-
5. Asia Pacific
- 5.1. China
- 5.2. India
- 5.3. Japan
- 5.4. South Korea
- 5.5. ASEAN
- 5.6. Oceania
- 5.7. Rest of Asia Pacific
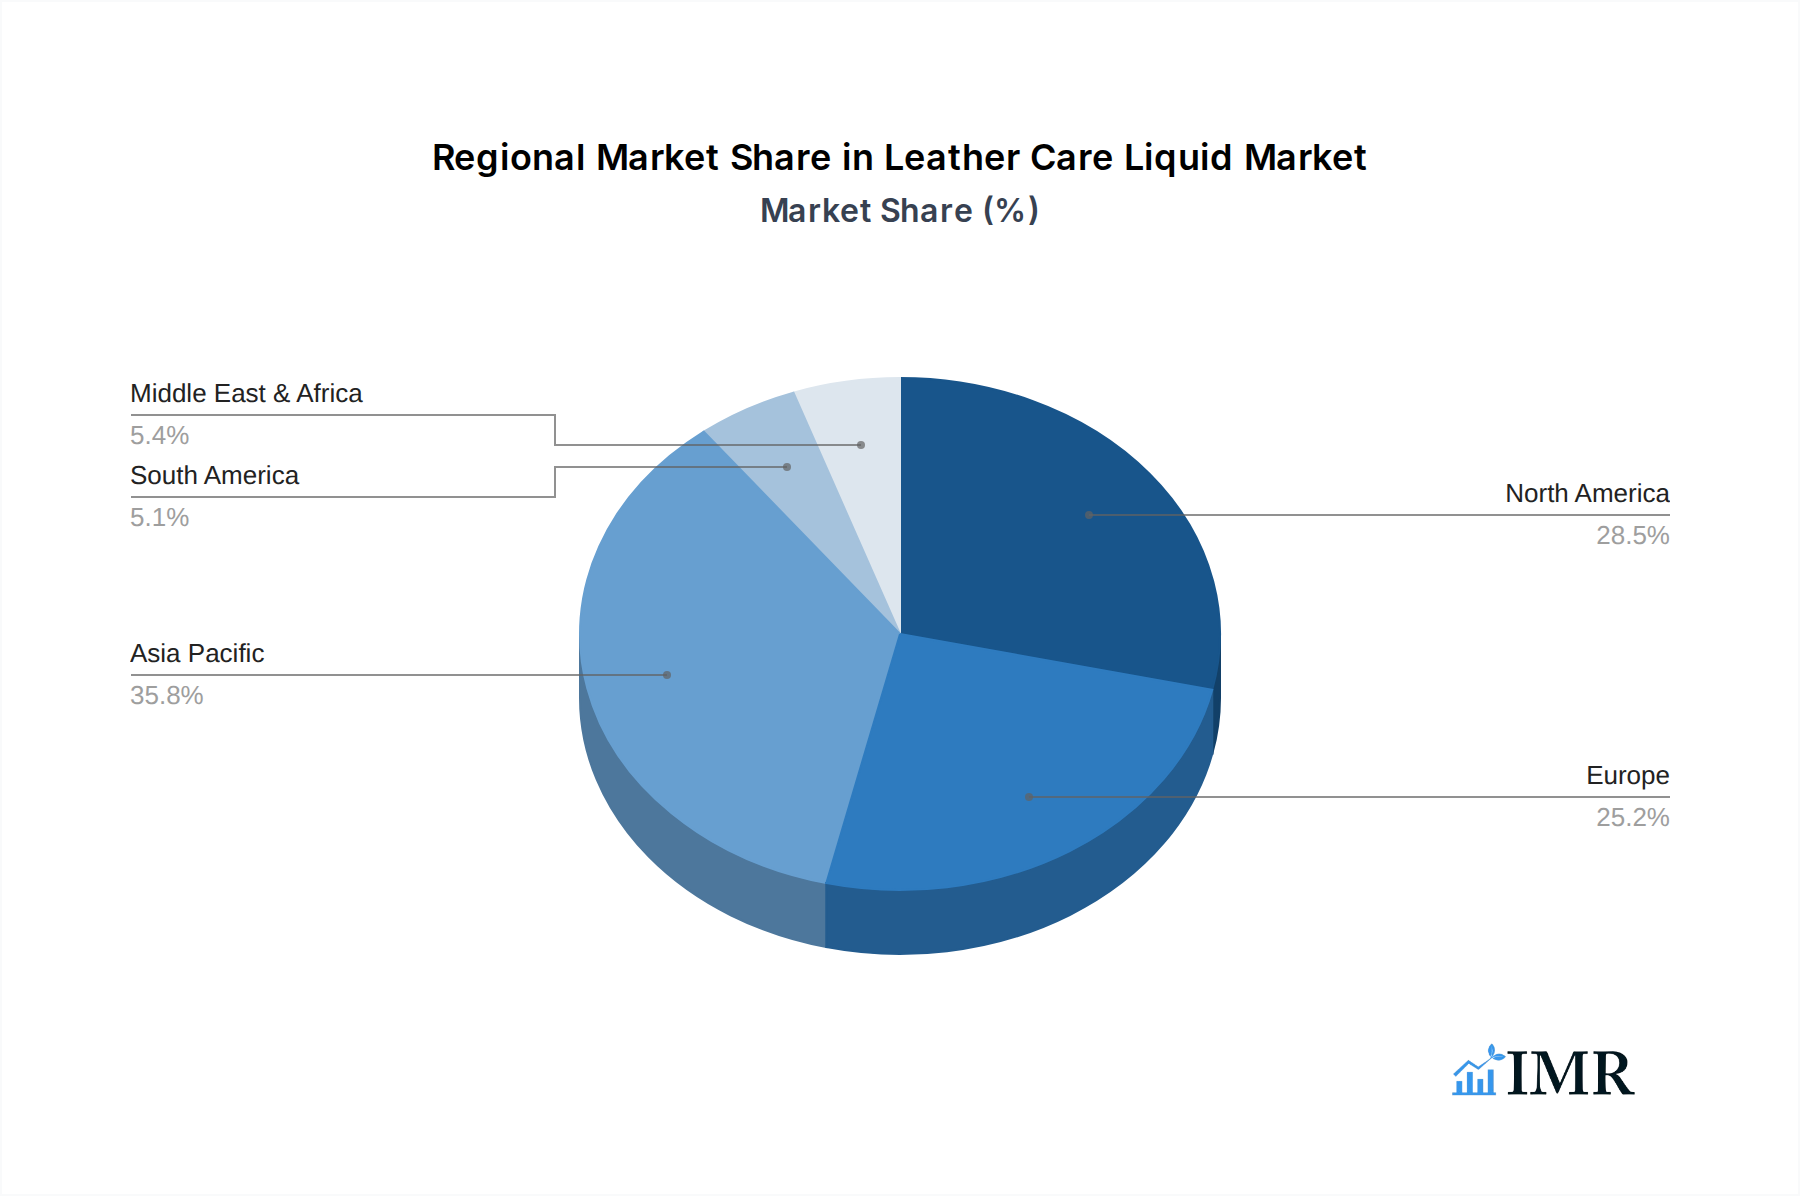
Leather Care Liquid Regional Market Share
Geographic Coverage of Leather Care Liquid
Leather Care Liquid REPORT HIGHLIGHTS
| Aspects | Details |
|---|---|
| Study Period | 2020-2034 |
| Base Year | 2025 |
| Estimated Year | 2026 |
| Forecast Period | 2026-2034 |
| Historical Period | 2020-2025 |
| Growth Rate | CAGR of 4.3% from 2020-2034 |
| Segmentation |
|
Table of Contents
- 1. Introduction
- 1.1. Research Scope
- 1.2. Market Segmentation
- 1.3. Research Methodology
- 1.4. Definitions and Assumptions
- 2. Executive Summary
- 2.1. Introduction
- 3. Market Dynamics
- 3.1. Introduction
- 3.2. Market Drivers
- 3.3. Market Restrains
- 3.4. Market Trends
- 4. Market Factor Analysis
- 4.1. Porters Five Forces
- 4.2. Supply/Value Chain
- 4.3. PESTEL analysis
- 4.4. Market Entropy
- 4.5. Patent/Trademark Analysis
- 5. Global Leather Care Liquid Analysis, Insights and Forecast, 2020-2032
- 5.1. Market Analysis, Insights and Forecast - by Application
- 5.1.1. Automobile
- 5.1.2. Furniture
- 5.1.3. Others
- 5.2. Market Analysis, Insights and Forecast - by Types
- 5.2.1. Maintenance Liquid
- 5.2.2. Cleansing Fluid
- 5.3. Market Analysis, Insights and Forecast - by Region
- 5.3.1. North America
- 5.3.2. South America
- 5.3.3. Europe
- 5.3.4. Middle East & Africa
- 5.3.5. Asia Pacific
- 5.1. Market Analysis, Insights and Forecast - by Application
- 6. North America Leather Care Liquid Analysis, Insights and Forecast, 2020-2032
- 6.1. Market Analysis, Insights and Forecast - by Application
- 6.1.1. Automobile
- 6.1.2. Furniture
- 6.1.3. Others
- 6.2. Market Analysis, Insights and Forecast - by Types
- 6.2.1. Maintenance Liquid
- 6.2.2. Cleansing Fluid
- 6.1. Market Analysis, Insights and Forecast - by Application
- 7. South America Leather Care Liquid Analysis, Insights and Forecast, 2020-2032
- 7.1. Market Analysis, Insights and Forecast - by Application
- 7.1.1. Automobile
- 7.1.2. Furniture
- 7.1.3. Others
- 7.2. Market Analysis, Insights and Forecast - by Types
- 7.2.1. Maintenance Liquid
- 7.2.2. Cleansing Fluid
- 7.1. Market Analysis, Insights and Forecast - by Application
- 8. Europe Leather Care Liquid Analysis, Insights and Forecast, 2020-2032
- 8.1. Market Analysis, Insights and Forecast - by Application
- 8.1.1. Automobile
- 8.1.2. Furniture
- 8.1.3. Others
- 8.2. Market Analysis, Insights and Forecast - by Types
- 8.2.1. Maintenance Liquid
- 8.2.2. Cleansing Fluid
- 8.1. Market Analysis, Insights and Forecast - by Application
- 9. Middle East & Africa Leather Care Liquid Analysis, Insights and Forecast, 2020-2032
- 9.1. Market Analysis, Insights and Forecast - by Application
- 9.1.1. Automobile
- 9.1.2. Furniture
- 9.1.3. Others
- 9.2. Market Analysis, Insights and Forecast - by Types
- 9.2.1. Maintenance Liquid
- 9.2.2. Cleansing Fluid
- 9.1. Market Analysis, Insights and Forecast - by Application
- 10. Asia Pacific Leather Care Liquid Analysis, Insights and Forecast, 2020-2032
- 10.1. Market Analysis, Insights and Forecast - by Application
- 10.1.1. Automobile
- 10.1.2. Furniture
- 10.1.3. Others
- 10.2. Market Analysis, Insights and Forecast - by Types
- 10.2.1. Maintenance Liquid
- 10.2.2. Cleansing Fluid
- 10.1. Market Analysis, Insights and Forecast - by Application
- 11. Competitive Analysis
- 11.1. Global Market Share Analysis 2025
- 11.2. Company Profiles
- 11.2.1 Leather Honey
- 11.2.1.1. Overview
- 11.2.1.2. Products
- 11.2.1.3. SWOT Analysis
- 11.2.1.4. Recent Developments
- 11.2.1.5. Financials (Based on Availability)
- 11.2.2 Weiman
- 11.2.2.1. Overview
- 11.2.2.2. Products
- 11.2.2.3. SWOT Analysis
- 11.2.2.4. Recent Developments
- 11.2.2.5. Financials (Based on Availability)
- 11.2.3 Simoniz
- 11.2.3.1. Overview
- 11.2.3.2. Products
- 11.2.3.3. SWOT Analysis
- 11.2.3.4. Recent Developments
- 11.2.3.5. Financials (Based on Availability)
- 11.2.4 Armor All
- 11.2.4.1. Overview
- 11.2.4.2. Products
- 11.2.4.3. SWOT Analysis
- 11.2.4.4. Recent Developments
- 11.2.4.5. Financials (Based on Availability)
- 11.2.5 Dryshine
- 11.2.5.1. Overview
- 11.2.5.2. Products
- 11.2.5.3. SWOT Analysis
- 11.2.5.4. Recent Developments
- 11.2.5.5. Financials (Based on Availability)
- 11.2.6 Glym
- 11.2.6.1. Overview
- 11.2.6.2. Products
- 11.2.6.3. SWOT Analysis
- 11.2.6.4. Recent Developments
- 11.2.6.5. Financials (Based on Availability)
- 11.2.7 Sans-Zo
- 11.2.7.1. Overview
- 11.2.7.2. Products
- 11.2.7.3. SWOT Analysis
- 11.2.7.4. Recent Developments
- 11.2.7.5. Financials (Based on Availability)
- 11.2.8 Silverwax
- 11.2.8.1. Overview
- 11.2.8.2. Products
- 11.2.8.3. SWOT Analysis
- 11.2.8.4. Recent Developments
- 11.2.8.5. Financials (Based on Availability)
- 11.2.1 Leather Honey
List of Figures
- Figure 1: Global Leather Care Liquid Revenue Breakdown (undefined, %) by Region 2025 & 2033
- Figure 2: Global Leather Care Liquid Volume Breakdown (K, %) by Region 2025 & 2033
- Figure 3: North America Leather Care Liquid Revenue (undefined), by Application 2025 & 2033
- Figure 4: North America Leather Care Liquid Volume (K), by Application 2025 & 2033
- Figure 5: North America Leather Care Liquid Revenue Share (%), by Application 2025 & 2033
- Figure 6: North America Leather Care Liquid Volume Share (%), by Application 2025 & 2033
- Figure 7: North America Leather Care Liquid Revenue (undefined), by Types 2025 & 2033
- Figure 8: North America Leather Care Liquid Volume (K), by Types 2025 & 2033
- Figure 9: North America Leather Care Liquid Revenue Share (%), by Types 2025 & 2033
- Figure 10: North America Leather Care Liquid Volume Share (%), by Types 2025 & 2033
- Figure 11: North America Leather Care Liquid Revenue (undefined), by Country 2025 & 2033
- Figure 12: North America Leather Care Liquid Volume (K), by Country 2025 & 2033
- Figure 13: North America Leather Care Liquid Revenue Share (%), by Country 2025 & 2033
- Figure 14: North America Leather Care Liquid Volume Share (%), by Country 2025 & 2033
- Figure 15: South America Leather Care Liquid Revenue (undefined), by Application 2025 & 2033
- Figure 16: South America Leather Care Liquid Volume (K), by Application 2025 & 2033
- Figure 17: South America Leather Care Liquid Revenue Share (%), by Application 2025 & 2033
- Figure 18: South America Leather Care Liquid Volume Share (%), by Application 2025 & 2033
- Figure 19: South America Leather Care Liquid Revenue (undefined), by Types 2025 & 2033
- Figure 20: South America Leather Care Liquid Volume (K), by Types 2025 & 2033
- Figure 21: South America Leather Care Liquid Revenue Share (%), by Types 2025 & 2033
- Figure 22: South America Leather Care Liquid Volume Share (%), by Types 2025 & 2033
- Figure 23: South America Leather Care Liquid Revenue (undefined), by Country 2025 & 2033
- Figure 24: South America Leather Care Liquid Volume (K), by Country 2025 & 2033
- Figure 25: South America Leather Care Liquid Revenue Share (%), by Country 2025 & 2033
- Figure 26: South America Leather Care Liquid Volume Share (%), by Country 2025 & 2033
- Figure 27: Europe Leather Care Liquid Revenue (undefined), by Application 2025 & 2033
- Figure 28: Europe Leather Care Liquid Volume (K), by Application 2025 & 2033
- Figure 29: Europe Leather Care Liquid Revenue Share (%), by Application 2025 & 2033
- Figure 30: Europe Leather Care Liquid Volume Share (%), by Application 2025 & 2033
- Figure 31: Europe Leather Care Liquid Revenue (undefined), by Types 2025 & 2033
- Figure 32: Europe Leather Care Liquid Volume (K), by Types 2025 & 2033
- Figure 33: Europe Leather Care Liquid Revenue Share (%), by Types 2025 & 2033
- Figure 34: Europe Leather Care Liquid Volume Share (%), by Types 2025 & 2033
- Figure 35: Europe Leather Care Liquid Revenue (undefined), by Country 2025 & 2033
- Figure 36: Europe Leather Care Liquid Volume (K), by Country 2025 & 2033
- Figure 37: Europe Leather Care Liquid Revenue Share (%), by Country 2025 & 2033
- Figure 38: Europe Leather Care Liquid Volume Share (%), by Country 2025 & 2033
- Figure 39: Middle East & Africa Leather Care Liquid Revenue (undefined), by Application 2025 & 2033
- Figure 40: Middle East & Africa Leather Care Liquid Volume (K), by Application 2025 & 2033
- Figure 41: Middle East & Africa Leather Care Liquid Revenue Share (%), by Application 2025 & 2033
- Figure 42: Middle East & Africa Leather Care Liquid Volume Share (%), by Application 2025 & 2033
- Figure 43: Middle East & Africa Leather Care Liquid Revenue (undefined), by Types 2025 & 2033
- Figure 44: Middle East & Africa Leather Care Liquid Volume (K), by Types 2025 & 2033
- Figure 45: Middle East & Africa Leather Care Liquid Revenue Share (%), by Types 2025 & 2033
- Figure 46: Middle East & Africa Leather Care Liquid Volume Share (%), by Types 2025 & 2033
- Figure 47: Middle East & Africa Leather Care Liquid Revenue (undefined), by Country 2025 & 2033
- Figure 48: Middle East & Africa Leather Care Liquid Volume (K), by Country 2025 & 2033
- Figure 49: Middle East & Africa Leather Care Liquid Revenue Share (%), by Country 2025 & 2033
- Figure 50: Middle East & Africa Leather Care Liquid Volume Share (%), by Country 2025 & 2033
- Figure 51: Asia Pacific Leather Care Liquid Revenue (undefined), by Application 2025 & 2033
- Figure 52: Asia Pacific Leather Care Liquid Volume (K), by Application 2025 & 2033
- Figure 53: Asia Pacific Leather Care Liquid Revenue Share (%), by Application 2025 & 2033
- Figure 54: Asia Pacific Leather Care Liquid Volume Share (%), by Application 2025 & 2033
- Figure 55: Asia Pacific Leather Care Liquid Revenue (undefined), by Types 2025 & 2033
- Figure 56: Asia Pacific Leather Care Liquid Volume (K), by Types 2025 & 2033
- Figure 57: Asia Pacific Leather Care Liquid Revenue Share (%), by Types 2025 & 2033
- Figure 58: Asia Pacific Leather Care Liquid Volume Share (%), by Types 2025 & 2033
- Figure 59: Asia Pacific Leather Care Liquid Revenue (undefined), by Country 2025 & 2033
- Figure 60: Asia Pacific Leather Care Liquid Volume (K), by Country 2025 & 2033
- Figure 61: Asia Pacific Leather Care Liquid Revenue Share (%), by Country 2025 & 2033
- Figure 62: Asia Pacific Leather Care Liquid Volume Share (%), by Country 2025 & 2033
List of Tables
- Table 1: Global Leather Care Liquid Revenue undefined Forecast, by Application 2020 & 2033
- Table 2: Global Leather Care Liquid Volume K Forecast, by Application 2020 & 2033
- Table 3: Global Leather Care Liquid Revenue undefined Forecast, by Types 2020 & 2033
- Table 4: Global Leather Care Liquid Volume K Forecast, by Types 2020 & 2033
- Table 5: Global Leather Care Liquid Revenue undefined Forecast, by Region 2020 & 2033
- Table 6: Global Leather Care Liquid Volume K Forecast, by Region 2020 & 2033
- Table 7: Global Leather Care Liquid Revenue undefined Forecast, by Application 2020 & 2033
- Table 8: Global Leather Care Liquid Volume K Forecast, by Application 2020 & 2033
- Table 9: Global Leather Care Liquid Revenue undefined Forecast, by Types 2020 & 2033
- Table 10: Global Leather Care Liquid Volume K Forecast, by Types 2020 & 2033
- Table 11: Global Leather Care Liquid Revenue undefined Forecast, by Country 2020 & 2033
- Table 12: Global Leather Care Liquid Volume K Forecast, by Country 2020 & 2033
- Table 13: United States Leather Care Liquid Revenue (undefined) Forecast, by Application 2020 & 2033
- Table 14: United States Leather Care Liquid Volume (K) Forecast, by Application 2020 & 2033
- Table 15: Canada Leather Care Liquid Revenue (undefined) Forecast, by Application 2020 & 2033
- Table 16: Canada Leather Care Liquid Volume (K) Forecast, by Application 2020 & 2033
- Table 17: Mexico Leather Care Liquid Revenue (undefined) Forecast, by Application 2020 & 2033
- Table 18: Mexico Leather Care Liquid Volume (K) Forecast, by Application 2020 & 2033
- Table 19: Global Leather Care Liquid Revenue undefined Forecast, by Application 2020 & 2033
- Table 20: Global Leather Care Liquid Volume K Forecast, by Application 2020 & 2033
- Table 21: Global Leather Care Liquid Revenue undefined Forecast, by Types 2020 & 2033
- Table 22: Global Leather Care Liquid Volume K Forecast, by Types 2020 & 2033
- Table 23: Global Leather Care Liquid Revenue undefined Forecast, by Country 2020 & 2033
- Table 24: Global Leather Care Liquid Volume K Forecast, by Country 2020 & 2033
- Table 25: Brazil Leather Care Liquid Revenue (undefined) Forecast, by Application 2020 & 2033
- Table 26: Brazil Leather Care Liquid Volume (K) Forecast, by Application 2020 & 2033
- Table 27: Argentina Leather Care Liquid Revenue (undefined) Forecast, by Application 2020 & 2033
- Table 28: Argentina Leather Care Liquid Volume (K) Forecast, by Application 2020 & 2033
- Table 29: Rest of South America Leather Care Liquid Revenue (undefined) Forecast, by Application 2020 & 2033
- Table 30: Rest of South America Leather Care Liquid Volume (K) Forecast, by Application 2020 & 2033
- Table 31: Global Leather Care Liquid Revenue undefined Forecast, by Application 2020 & 2033
- Table 32: Global Leather Care Liquid Volume K Forecast, by Application 2020 & 2033
- Table 33: Global Leather Care Liquid Revenue undefined Forecast, by Types 2020 & 2033
- Table 34: Global Leather Care Liquid Volume K Forecast, by Types 2020 & 2033
- Table 35: Global Leather Care Liquid Revenue undefined Forecast, by Country 2020 & 2033
- Table 36: Global Leather Care Liquid Volume K Forecast, by Country 2020 & 2033
- Table 37: United Kingdom Leather Care Liquid Revenue (undefined) Forecast, by Application 2020 & 2033
- Table 38: United Kingdom Leather Care Liquid Volume (K) Forecast, by Application 2020 & 2033
- Table 39: Germany Leather Care Liquid Revenue (undefined) Forecast, by Application 2020 & 2033
- Table 40: Germany Leather Care Liquid Volume (K) Forecast, by Application 2020 & 2033
- Table 41: France Leather Care Liquid Revenue (undefined) Forecast, by Application 2020 & 2033
- Table 42: France Leather Care Liquid Volume (K) Forecast, by Application 2020 & 2033
- Table 43: Italy Leather Care Liquid Revenue (undefined) Forecast, by Application 2020 & 2033
- Table 44: Italy Leather Care Liquid Volume (K) Forecast, by Application 2020 & 2033
- Table 45: Spain Leather Care Liquid Revenue (undefined) Forecast, by Application 2020 & 2033
- Table 46: Spain Leather Care Liquid Volume (K) Forecast, by Application 2020 & 2033
- Table 47: Russia Leather Care Liquid Revenue (undefined) Forecast, by Application 2020 & 2033
- Table 48: Russia Leather Care Liquid Volume (K) Forecast, by Application 2020 & 2033
- Table 49: Benelux Leather Care Liquid Revenue (undefined) Forecast, by Application 2020 & 2033
- Table 50: Benelux Leather Care Liquid Volume (K) Forecast, by Application 2020 & 2033
- Table 51: Nordics Leather Care Liquid Revenue (undefined) Forecast, by Application 2020 & 2033
- Table 52: Nordics Leather Care Liquid Volume (K) Forecast, by Application 2020 & 2033
- Table 53: Rest of Europe Leather Care Liquid Revenue (undefined) Forecast, by Application 2020 & 2033
- Table 54: Rest of Europe Leather Care Liquid Volume (K) Forecast, by Application 2020 & 2033
- Table 55: Global Leather Care Liquid Revenue undefined Forecast, by Application 2020 & 2033
- Table 56: Global Leather Care Liquid Volume K Forecast, by Application 2020 & 2033
- Table 57: Global Leather Care Liquid Revenue undefined Forecast, by Types 2020 & 2033
- Table 58: Global Leather Care Liquid Volume K Forecast, by Types 2020 & 2033
- Table 59: Global Leather Care Liquid Revenue undefined Forecast, by Country 2020 & 2033
- Table 60: Global Leather Care Liquid Volume K Forecast, by Country 2020 & 2033
- Table 61: Turkey Leather Care Liquid Revenue (undefined) Forecast, by Application 2020 & 2033
- Table 62: Turkey Leather Care Liquid Volume (K) Forecast, by Application 2020 & 2033
- Table 63: Israel Leather Care Liquid Revenue (undefined) Forecast, by Application 2020 & 2033
- Table 64: Israel Leather Care Liquid Volume (K) Forecast, by Application 2020 & 2033
- Table 65: GCC Leather Care Liquid Revenue (undefined) Forecast, by Application 2020 & 2033
- Table 66: GCC Leather Care Liquid Volume (K) Forecast, by Application 2020 & 2033
- Table 67: North Africa Leather Care Liquid Revenue (undefined) Forecast, by Application 2020 & 2033
- Table 68: North Africa Leather Care Liquid Volume (K) Forecast, by Application 2020 & 2033
- Table 69: South Africa Leather Care Liquid Revenue (undefined) Forecast, by Application 2020 & 2033
- Table 70: South Africa Leather Care Liquid Volume (K) Forecast, by Application 2020 & 2033
- Table 71: Rest of Middle East & Africa Leather Care Liquid Revenue (undefined) Forecast, by Application 2020 & 2033
- Table 72: Rest of Middle East & Africa Leather Care Liquid Volume (K) Forecast, by Application 2020 & 2033
- Table 73: Global Leather Care Liquid Revenue undefined Forecast, by Application 2020 & 2033
- Table 74: Global Leather Care Liquid Volume K Forecast, by Application 2020 & 2033
- Table 75: Global Leather Care Liquid Revenue undefined Forecast, by Types 2020 & 2033
- Table 76: Global Leather Care Liquid Volume K Forecast, by Types 2020 & 2033
- Table 77: Global Leather Care Liquid Revenue undefined Forecast, by Country 2020 & 2033
- Table 78: Global Leather Care Liquid Volume K Forecast, by Country 2020 & 2033
- Table 79: China Leather Care Liquid Revenue (undefined) Forecast, by Application 2020 & 2033
- Table 80: China Leather Care Liquid Volume (K) Forecast, by Application 2020 & 2033
- Table 81: India Leather Care Liquid Revenue (undefined) Forecast, by Application 2020 & 2033
- Table 82: India Leather Care Liquid Volume (K) Forecast, by Application 2020 & 2033
- Table 83: Japan Leather Care Liquid Revenue (undefined) Forecast, by Application 2020 & 2033
- Table 84: Japan Leather Care Liquid Volume (K) Forecast, by Application 2020 & 2033
- Table 85: South Korea Leather Care Liquid Revenue (undefined) Forecast, by Application 2020 & 2033
- Table 86: South Korea Leather Care Liquid Volume (K) Forecast, by Application 2020 & 2033
- Table 87: ASEAN Leather Care Liquid Revenue (undefined) Forecast, by Application 2020 & 2033
- Table 88: ASEAN Leather Care Liquid Volume (K) Forecast, by Application 2020 & 2033
- Table 89: Oceania Leather Care Liquid Revenue (undefined) Forecast, by Application 2020 & 2033
- Table 90: Oceania Leather Care Liquid Volume (K) Forecast, by Application 2020 & 2033
- Table 91: Rest of Asia Pacific Leather Care Liquid Revenue (undefined) Forecast, by Application 2020 & 2033
- Table 92: Rest of Asia Pacific Leather Care Liquid Volume (K) Forecast, by Application 2020 & 2033
Frequently Asked Questions
1. What is the projected Compound Annual Growth Rate (CAGR) of the Leather Care Liquid?
The projected CAGR is approximately 4.3%.
2. Which companies are prominent players in the Leather Care Liquid?
Key companies in the market include Leather Honey, Weiman, Simoniz, Armor All, Dryshine, Glym, Sans-Zo, Silverwax.
3. What are the main segments of the Leather Care Liquid?
The market segments include Application, Types.
4. Can you provide details about the market size?
The market size is estimated to be USD XXX N/A as of 2022.
5. What are some drivers contributing to market growth?
N/A
6. What are the notable trends driving market growth?
N/A
7. Are there any restraints impacting market growth?
N/A
8. Can you provide examples of recent developments in the market?
N/A
9. What pricing options are available for accessing the report?
Pricing options include single-user, multi-user, and enterprise licenses priced at USD 3350.00, USD 5025.00, and USD 6700.00 respectively.
10. Is the market size provided in terms of value or volume?
The market size is provided in terms of value, measured in N/A and volume, measured in K.
11. Are there any specific market keywords associated with the report?
Yes, the market keyword associated with the report is "Leather Care Liquid," which aids in identifying and referencing the specific market segment covered.
12. How do I determine which pricing option suits my needs best?
The pricing options vary based on user requirements and access needs. Individual users may opt for single-user licenses, while businesses requiring broader access may choose multi-user or enterprise licenses for cost-effective access to the report.
13. Are there any additional resources or data provided in the Leather Care Liquid report?
While the report offers comprehensive insights, it's advisable to review the specific contents or supplementary materials provided to ascertain if additional resources or data are available.
14. How can I stay updated on further developments or reports in the Leather Care Liquid?
To stay informed about further developments, trends, and reports in the Leather Care Liquid, consider subscribing to industry newsletters, following relevant companies and organizations, or regularly checking reputable industry news sources and publications.
Methodology
Step 1 - Identification of Relevant Samples Size from Population Database


Step 2 - Approaches for Defining Global Market Size (Value, Volume* & Price*)

Note*: In applicable scenarios
Step 3 - Data Sources
Primary Research
- Web Analytics
- Survey Reports
- Research Institute
- Latest Research Reports
- Opinion Leaders
Secondary Research
- Annual Reports
- White Paper
- Latest Press Release
- Industry Association
- Paid Database
- Investor Presentations

Step 4 - Data Triangulation
Involves using different sources of information in order to increase the validity of a study
These sources are likely to be stakeholders in a program - participants, other researchers, program staff, other community members, and so on.
Then we put all data in single framework & apply various statistical tools to find out the dynamic on the market.
During the analysis stage, feedback from the stakeholder groups would be compared to determine areas of agreement as well as areas of divergence