

Key Insights
The global livestock ear tag market, projected to reach $1.74 billion by 2025, is set for significant expansion with a Compound Annual Growth Rate (CAGR) of 8.1% from 2025 to 2033. This growth is primarily driven by the escalating adoption of precision livestock farming (PLF) and the resulting demand for advanced animal identification and tracking solutions. Livestock ear tags are integral to data-driven decision-making, optimizing herd management, and boosting farm productivity. Additionally, stringent government regulations and traceability mandates aimed at disease control and food safety are fueling the demand for robust and reliable ear tags. Technological innovations, including integrated RFID and data analytics, are enhancing the value proposition for farmers, enabling real-time monitoring of animal health, location, and behavior. The market is segmented by tag type (visual, electronic), animal type (cattle, swine, sheep, goats, poultry), and technology (RFID, barcode). The competitive landscape features established players such as Datamars SA and Allflex, alongside emerging regional manufacturers, suggesting continued innovation in materials, design, and data analytics.
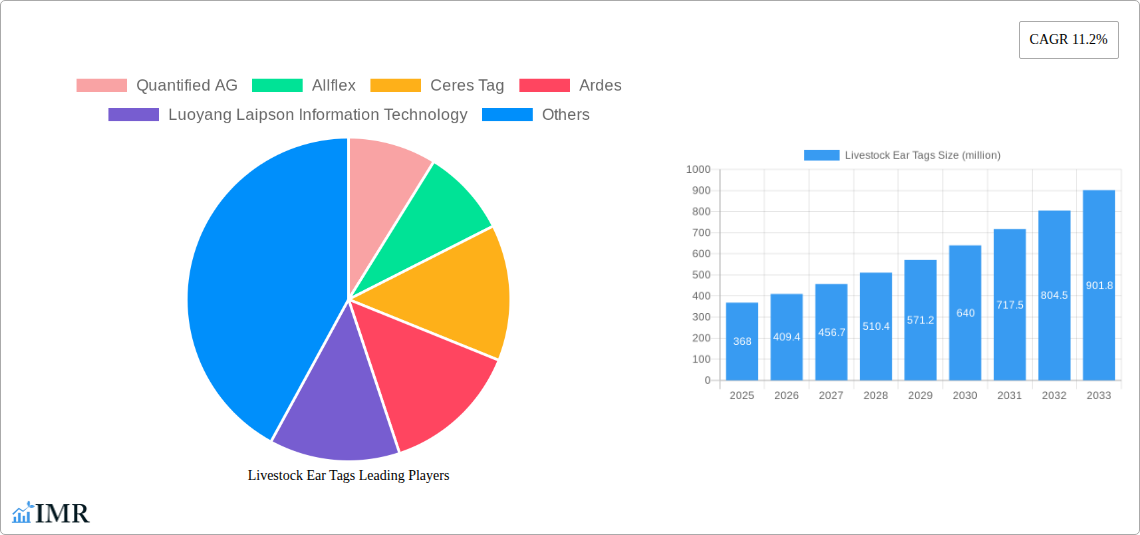
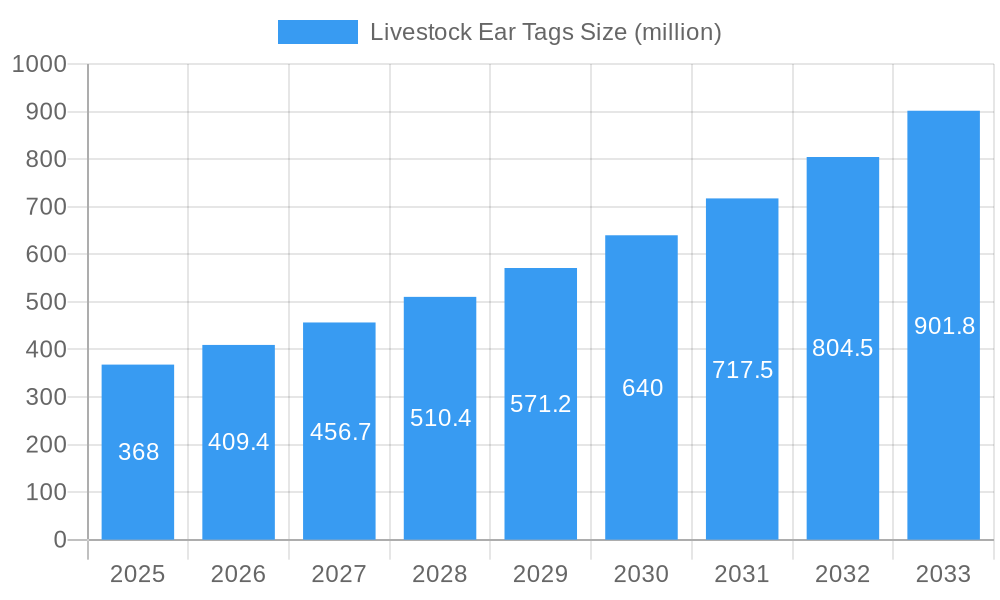
Livestock Ear Tags Market Size (In Billion)
While initial investment costs for electronic tags and the need for supporting infrastructure present challenges, the long-term benefits of enhanced herd management, disease prevention, and traceability are expected to drive market growth. Advancements in technology, declining electronic tag costs, and increasing farmer awareness of PLF benefits will further propel the market. Key regional markets, including North America, Europe, and regions with substantial livestock populations in Asia and South America, are anticipated to experience growth influenced by technological adoption and regulatory frameworks.
Livestock Ear Tags Company Market Share
Livestock Ear Tags Market Report: 2019-2033
This comprehensive report provides a detailed analysis of the global livestock ear tags market, covering the period 2019-2033. With a focus on market dynamics, growth trends, competitive landscape, and future opportunities, this report is an invaluable resource for industry professionals, investors, and researchers seeking to understand this rapidly evolving sector. The report analyzes a market expected to reach xx million units by 2033, representing substantial growth from the 2019 baseline. This report delves deep into the parent market of animal identification and tracking technologies and the child market of livestock management solutions.
Livestock Ear Tags Market Dynamics & Structure
The global livestock ear tags market is characterized by a moderately concentrated landscape, with key players such as Quantified AG, Allflex, Datamars SA, and others holding significant market share. The market is driven by technological innovation, particularly in areas like RFID technology and data analytics integration. Stringent regulatory frameworks governing animal identification and traceability further stimulate demand. Competitive substitutes include various animal identification methods, though ear tags remain the dominant approach due to their cost-effectiveness and ease of use. The end-user demographics are predominantly large-scale commercial farms and agricultural enterprises, with growing adoption among smaller farms. Mergers and acquisitions (M&A) activity has been moderate, primarily involving smaller companies being acquired by larger players seeking to expand their product portfolio and geographic reach.
- Market Concentration: Moderately concentrated, with top 5 players holding approximately xx% market share in 2025.
- Technological Innovation: RFID, GPS tracking, and data analytics integration are key drivers.
- Regulatory Landscape: Stringent regulations in various regions mandate animal identification, boosting demand.
- Competitive Substitutes: Branding, microchipping, and other identification methods present limited competition.
- End-User Demographics: Primarily large-scale commercial farms and agricultural businesses, with increasing adoption by smaller farms.
- M&A Activity: Moderate activity, focused on consolidating market share and expanding product portfolios. An estimated xx M&A deals occurred between 2019 and 2024.
Livestock Ear Tags Growth Trends & Insights
The livestock ear tags market experienced significant growth during the historical period (2019-2024), driven by factors such as increasing livestock populations globally, rising demand for efficient animal management practices, and technological advancements. The market is projected to maintain a healthy Compound Annual Growth Rate (CAGR) of xx% during the forecast period (2025-2033), reaching an estimated xx million units by 2033. Technological disruptions, such as the integration of RFID technology and data analytics, have significantly improved the efficiency and effectiveness of livestock management, driving market adoption. Consumer behavior shifts towards precision livestock farming and data-driven decision-making are further fueling demand. Market penetration remains relatively high in developed regions, but significant growth opportunities exist in emerging economies with expanding livestock sectors.
Dominant Regions, Countries, or Segments in Livestock Ear Tags
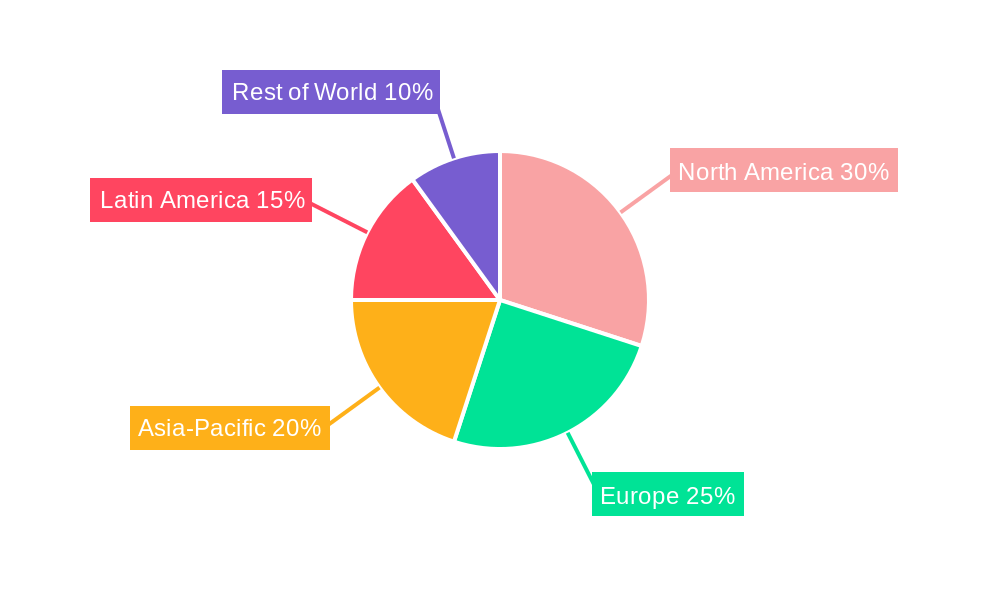
North America and Europe currently dominate the livestock ear tags market, driven by high livestock populations, advanced agricultural practices, and stringent regulatory requirements. However, significant growth is anticipated in regions like Asia-Pacific and Latin America, fueled by increasing livestock production and rising adoption of modern farming techniques. Within these regions, countries with large livestock populations and supportive government policies are experiencing the fastest growth.
- North America: High adoption rates, advanced technology integration, and strong regulatory frameworks contribute to market leadership.
- Europe: Similar to North America, high livestock densities and robust regulatory environment drive demand.
- Asia-Pacific: Rapid growth potential due to increasing livestock production and rising demand for improved management practices.
- Latin America: Significant growth opportunities driven by expanding livestock populations and government initiatives promoting efficient farming.
- Key Drivers: Government regulations, technological advancements, increased livestock population, and rising demand for improved animal management practices.
Livestock Ear Tags Product Landscape
The livestock ear tags market offers a diverse range of products, including traditional visual tags, electronic tags (RFID), and integrated data management systems. Innovations focus on enhancing tag durability, improving data accuracy, and simplifying data integration with existing farm management software. Key advancements include the development of long-range RFID tags, improved data encryption for enhanced security, and the integration of GPS technology for precise animal tracking. Unique selling propositions often involve superior durability, improved data accuracy and longevity, and seamless integration with existing farm management systems.
Key Drivers, Barriers & Challenges in Livestock Ear Tags
Key Drivers:
- Growing demand for efficient livestock management practices.
- Increasing adoption of precision livestock farming techniques.
- Stringent government regulations mandating animal identification.
- Technological advancements in RFID and data analytics.
Key Challenges:
- High initial investment costs associated with RFID technology.
- Concerns over data security and privacy.
- Potential for tag malfunction or damage.
- Competition from alternative animal identification methods. These challenges represent a xx% reduction in market growth projections in certain regions.
Emerging Opportunities in Livestock Ear Tags
Emerging opportunities lie in expanding into untapped markets in developing countries, integrating advanced sensor technologies for real-time health monitoring, and developing data analytics tools that provide actionable insights for farmers. The development of sustainable and biodegradable ear tags is also gaining traction, aligning with the growing focus on environmentally friendly practices. Furthermore, the integration of livestock ear tag data with other farm management systems presents significant potential for optimizing overall farm efficiency.
Growth Accelerators in the Livestock Ear Tags Industry
Long-term growth will be driven by technological advancements leading to more accurate, durable, and cost-effective tags. Strategic partnerships between tag manufacturers and data analytics providers will further enhance the value proposition for farmers. Expansion into new markets and the development of tailored solutions for specific livestock breeds will also fuel growth.
Key Players Shaping the Livestock Ear Tags Market
- Quantified AG
- Allflex
- Ceres Tag
- Ardes
- Luoyang Laipson Information Technology
- Kupsan
- Stockbrands
- CowManager BV
- HerdDogg
- MOOvement
- Moocall
- Datamars SA
- Drovers
- Caisley International GmbH
- Dalton Tags
Notable Milestones in Livestock Ear Tags Sector
- 2020: Introduction of a new generation of long-range RFID ear tags by Datamars SA.
- 2021: Acquisition of a smaller ear tag manufacturer by Allflex, expanding its product portfolio.
- 2022: Launch of a cloud-based data management platform by Quantified AG, integrating data from various sources, including ear tags.
- 2023: Implementation of new regulatory guidelines for animal identification in several key markets. This resulted in an increase in market demand.
- 2024: Several key players invested heavily in R&D, focusing on biodegradable ear tag technology.
In-Depth Livestock Ear Tags Market Outlook
The livestock ear tags market is poised for sustained growth over the forecast period, driven by increasing demand for efficient animal management and technological advancements. The integration of advanced technologies, strategic partnerships, and expansion into emerging markets will create significant opportunities for market players. The focus on sustainable and data-driven solutions will further shape the future of the livestock ear tags market, creating a positive impact on the agriculture sector as a whole.
Livestock Ear Tags Segmentation
-
1. Application
- 1.1. Pig
- 1.2. Cattle
- 1.3. Sheep
- 1.4. Others
-
2. Types
- 2.1. Half Duplex Tag
- 2.2. Full Duplex Tag
Livestock Ear Tags Segmentation By Geography
-
1. North America
- 1.1. United States
- 1.2. Canada
- 1.3. Mexico
-
2. South America
- 2.1. Brazil
- 2.2. Argentina
- 2.3. Rest of South America
-
3. Europe
- 3.1. United Kingdom
- 3.2. Germany
- 3.3. France
- 3.4. Italy
- 3.5. Spain
- 3.6. Russia
- 3.7. Benelux
- 3.8. Nordics
- 3.9. Rest of Europe
-
4. Middle East & Africa
- 4.1. Turkey
- 4.2. Israel
- 4.3. GCC
- 4.4. North Africa
- 4.5. South Africa
- 4.6. Rest of Middle East & Africa
-
5. Asia Pacific
- 5.1. China
- 5.2. India
- 5.3. Japan
- 5.4. South Korea
- 5.5. ASEAN
- 5.6. Oceania
- 5.7. Rest of Asia Pacific
Livestock Ear Tags Regional Market Share
Geographic Coverage of Livestock Ear Tags
Livestock Ear Tags REPORT HIGHLIGHTS
| Aspects | Details |
|---|---|
| Study Period | 2020-2034 |
| Base Year | 2025 |
| Estimated Year | 2026 |
| Forecast Period | 2026-2034 |
| Historical Period | 2020-2025 |
| Growth Rate | CAGR of 8.1% from 2020-2034 |
| Segmentation |
|
Table of Contents
- 1. Introduction
- 1.1. Research Scope
- 1.2. Market Segmentation
- 1.3. Research Objective
- 1.4. Definitions and Assumptions
- 2. Executive Summary
- 2.1. Market Snapshot
- 3. Market Dynamics
- 3.1. Market Drivers
- 3.2. Market Restrains
- 3.3. Market Trends
- 3.4. Market Opportunities
- 4. Market Factor Analysis
- 4.1. Porters Five Forces
- 4.1.1. Bargaining Power of Suppliers
- 4.1.2. Bargaining Power of Buyers
- 4.1.3. Threat of New Entrants
- 4.1.4. Threat of Substitutes
- 4.1.5. Competitive Rivalry
- 4.2. PESTEL analysis
- 4.3. BCG Analysis
- 4.3.1. Stars (High Growth, High Market Share)
- 4.3.2. Cash Cows (Low Growth, High Market Share)
- 4.3.3. Question Mark (High Growth, Low Market Share)
- 4.3.4. Dogs (Low Growth, Low Market Share)
- 4.4. Ansoff Matrix Analysis
- 4.5. Supply Chain Analysis
- 4.6. Regulatory Landscape
- 4.7. Current Market Potential and Opportunity Assessment (TAM–SAM–SOM Framework)
- 4.8. IMR Analyst Note
- 4.1. Porters Five Forces
- 5. Market Analysis, Insights and Forecast 2021-2033
- 5.1. Market Analysis, Insights and Forecast - by Application
- 5.1.1. Pig
- 5.1.2. Cattle
- 5.1.3. Sheep
- 5.1.4. Others
- 5.2. Market Analysis, Insights and Forecast - by Types
- 5.2.1. Half Duplex Tag
- 5.2.2. Full Duplex Tag
- 5.3. Market Analysis, Insights and Forecast - by Region
- 5.3.1. North America
- 5.3.2. South America
- 5.3.3. Europe
- 5.3.4. Middle East & Africa
- 5.3.5. Asia Pacific
- 5.1. Market Analysis, Insights and Forecast - by Application
- 6. Global Livestock Ear Tags Analysis, Insights and Forecast, 2021-2033
- 6.1. Market Analysis, Insights and Forecast - by Application
- 6.1.1. Pig
- 6.1.2. Cattle
- 6.1.3. Sheep
- 6.1.4. Others
- 6.2. Market Analysis, Insights and Forecast - by Types
- 6.2.1. Half Duplex Tag
- 6.2.2. Full Duplex Tag
- 6.1. Market Analysis, Insights and Forecast - by Application
- 7. North America Livestock Ear Tags Analysis, Insights and Forecast, 2020-2032
- 7.1. Market Analysis, Insights and Forecast - by Application
- 7.1.1. Pig
- 7.1.2. Cattle
- 7.1.3. Sheep
- 7.1.4. Others
- 7.2. Market Analysis, Insights and Forecast - by Types
- 7.2.1. Half Duplex Tag
- 7.2.2. Full Duplex Tag
- 7.1. Market Analysis, Insights and Forecast - by Application
- 8. South America Livestock Ear Tags Analysis, Insights and Forecast, 2020-2032
- 8.1. Market Analysis, Insights and Forecast - by Application
- 8.1.1. Pig
- 8.1.2. Cattle
- 8.1.3. Sheep
- 8.1.4. Others
- 8.2. Market Analysis, Insights and Forecast - by Types
- 8.2.1. Half Duplex Tag
- 8.2.2. Full Duplex Tag
- 8.1. Market Analysis, Insights and Forecast - by Application
- 9. Europe Livestock Ear Tags Analysis, Insights and Forecast, 2020-2032
- 9.1. Market Analysis, Insights and Forecast - by Application
- 9.1.1. Pig
- 9.1.2. Cattle
- 9.1.3. Sheep
- 9.1.4. Others
- 9.2. Market Analysis, Insights and Forecast - by Types
- 9.2.1. Half Duplex Tag
- 9.2.2. Full Duplex Tag
- 9.1. Market Analysis, Insights and Forecast - by Application
- 10. Middle East & Africa Livestock Ear Tags Analysis, Insights and Forecast, 2020-2032
- 10.1. Market Analysis, Insights and Forecast - by Application
- 10.1.1. Pig
- 10.1.2. Cattle
- 10.1.3. Sheep
- 10.1.4. Others
- 10.2. Market Analysis, Insights and Forecast - by Types
- 10.2.1. Half Duplex Tag
- 10.2.2. Full Duplex Tag
- 10.1. Market Analysis, Insights and Forecast - by Application
- 11. Asia Pacific Livestock Ear Tags Analysis, Insights and Forecast, 2020-2032
- 11.1. Market Analysis, Insights and Forecast - by Application
- 11.1.1. Pig
- 11.1.2. Cattle
- 11.1.3. Sheep
- 11.1.4. Others
- 11.2. Market Analysis, Insights and Forecast - by Types
- 11.2.1. Half Duplex Tag
- 11.2.2. Full Duplex Tag
- 11.1. Market Analysis, Insights and Forecast - by Application
- 12. Competitive Analysis
- 12.1. Company Profiles
- 12.1.1 Quantified AG
- 12.1.1.1. Company Overview
- 12.1.1.2. Products
- 12.1.1.3. Company Financials
- 12.1.1.4. SWOT Analysis
- 12.1.2 Allflex
- 12.1.2.1. Company Overview
- 12.1.2.2. Products
- 12.1.2.3. Company Financials
- 12.1.2.4. SWOT Analysis
- 12.1.3 Ceres Tag
- 12.1.3.1. Company Overview
- 12.1.3.2. Products
- 12.1.3.3. Company Financials
- 12.1.3.4. SWOT Analysis
- 12.1.4 Ardes
- 12.1.4.1. Company Overview
- 12.1.4.2. Products
- 12.1.4.3. Company Financials
- 12.1.4.4. SWOT Analysis
- 12.1.5 Luoyang Laipson Information Technology
- 12.1.5.1. Company Overview
- 12.1.5.2. Products
- 12.1.5.3. Company Financials
- 12.1.5.4. SWOT Analysis
- 12.1.6 Kupsan
- 12.1.6.1. Company Overview
- 12.1.6.2. Products
- 12.1.6.3. Company Financials
- 12.1.6.4. SWOT Analysis
- 12.1.7 Stockbrands
- 12.1.7.1. Company Overview
- 12.1.7.2. Products
- 12.1.7.3. Company Financials
- 12.1.7.4. SWOT Analysis
- 12.1.8 CowManager BV
- 12.1.8.1. Company Overview
- 12.1.8.2. Products
- 12.1.8.3. Company Financials
- 12.1.8.4. SWOT Analysis
- 12.1.9 HerdDogg
- 12.1.9.1. Company Overview
- 12.1.9.2. Products
- 12.1.9.3. Company Financials
- 12.1.9.4. SWOT Analysis
- 12.1.10 MOOvement
- 12.1.10.1. Company Overview
- 12.1.10.2. Products
- 12.1.10.3. Company Financials
- 12.1.10.4. SWOT Analysis
- 12.1.11 Moocall
- 12.1.11.1. Company Overview
- 12.1.11.2. Products
- 12.1.11.3. Company Financials
- 12.1.11.4. SWOT Analysis
- 12.1.12 Datamars SA
- 12.1.12.1. Company Overview
- 12.1.12.2. Products
- 12.1.12.3. Company Financials
- 12.1.12.4. SWOT Analysis
- 12.1.13 Drovers
- 12.1.13.1. Company Overview
- 12.1.13.2. Products
- 12.1.13.3. Company Financials
- 12.1.13.4. SWOT Analysis
- 12.1.14 Caisley International GmbH
- 12.1.14.1. Company Overview
- 12.1.14.2. Products
- 12.1.14.3. Company Financials
- 12.1.14.4. SWOT Analysis
- 12.1.15 Dalton Tags
- 12.1.15.1. Company Overview
- 12.1.15.2. Products
- 12.1.15.3. Company Financials
- 12.1.15.4. SWOT Analysis
- 12.1.1 Quantified AG
- 12.2. Market Entropy
- 12.2.1 Company's Key Areas Served
- 12.2.2 Recent Developments
- 12.3. Company Market Share Analysis 2025
- 12.3.1 Top 5 Companies Market Share Analysis
- 12.3.2 Top 3 Companies Market Share Analysis
- 12.4. List of Potential Customers
- 13. Research Methodology
List of Figures
- Figure 1: Global Livestock Ear Tags Revenue Breakdown (billion, %) by Region 2025 & 2033
- Figure 2: Global Livestock Ear Tags Volume Breakdown (K, %) by Region 2025 & 2033
- Figure 3: North America Livestock Ear Tags Revenue (billion), by Application 2025 & 2033
- Figure 4: North America Livestock Ear Tags Volume (K), by Application 2025 & 2033
- Figure 5: North America Livestock Ear Tags Revenue Share (%), by Application 2025 & 2033
- Figure 6: North America Livestock Ear Tags Volume Share (%), by Application 2025 & 2033
- Figure 7: North America Livestock Ear Tags Revenue (billion), by Types 2025 & 2033
- Figure 8: North America Livestock Ear Tags Volume (K), by Types 2025 & 2033
- Figure 9: North America Livestock Ear Tags Revenue Share (%), by Types 2025 & 2033
- Figure 10: North America Livestock Ear Tags Volume Share (%), by Types 2025 & 2033
- Figure 11: North America Livestock Ear Tags Revenue (billion), by Country 2025 & 2033
- Figure 12: North America Livestock Ear Tags Volume (K), by Country 2025 & 2033
- Figure 13: North America Livestock Ear Tags Revenue Share (%), by Country 2025 & 2033
- Figure 14: North America Livestock Ear Tags Volume Share (%), by Country 2025 & 2033
- Figure 15: South America Livestock Ear Tags Revenue (billion), by Application 2025 & 2033
- Figure 16: South America Livestock Ear Tags Volume (K), by Application 2025 & 2033
- Figure 17: South America Livestock Ear Tags Revenue Share (%), by Application 2025 & 2033
- Figure 18: South America Livestock Ear Tags Volume Share (%), by Application 2025 & 2033
- Figure 19: South America Livestock Ear Tags Revenue (billion), by Types 2025 & 2033
- Figure 20: South America Livestock Ear Tags Volume (K), by Types 2025 & 2033
- Figure 21: South America Livestock Ear Tags Revenue Share (%), by Types 2025 & 2033
- Figure 22: South America Livestock Ear Tags Volume Share (%), by Types 2025 & 2033
- Figure 23: South America Livestock Ear Tags Revenue (billion), by Country 2025 & 2033
- Figure 24: South America Livestock Ear Tags Volume (K), by Country 2025 & 2033
- Figure 25: South America Livestock Ear Tags Revenue Share (%), by Country 2025 & 2033
- Figure 26: South America Livestock Ear Tags Volume Share (%), by Country 2025 & 2033
- Figure 27: Europe Livestock Ear Tags Revenue (billion), by Application 2025 & 2033
- Figure 28: Europe Livestock Ear Tags Volume (K), by Application 2025 & 2033
- Figure 29: Europe Livestock Ear Tags Revenue Share (%), by Application 2025 & 2033
- Figure 30: Europe Livestock Ear Tags Volume Share (%), by Application 2025 & 2033
- Figure 31: Europe Livestock Ear Tags Revenue (billion), by Types 2025 & 2033
- Figure 32: Europe Livestock Ear Tags Volume (K), by Types 2025 & 2033
- Figure 33: Europe Livestock Ear Tags Revenue Share (%), by Types 2025 & 2033
- Figure 34: Europe Livestock Ear Tags Volume Share (%), by Types 2025 & 2033
- Figure 35: Europe Livestock Ear Tags Revenue (billion), by Country 2025 & 2033
- Figure 36: Europe Livestock Ear Tags Volume (K), by Country 2025 & 2033
- Figure 37: Europe Livestock Ear Tags Revenue Share (%), by Country 2025 & 2033
- Figure 38: Europe Livestock Ear Tags Volume Share (%), by Country 2025 & 2033
- Figure 39: Middle East & Africa Livestock Ear Tags Revenue (billion), by Application 2025 & 2033
- Figure 40: Middle East & Africa Livestock Ear Tags Volume (K), by Application 2025 & 2033
- Figure 41: Middle East & Africa Livestock Ear Tags Revenue Share (%), by Application 2025 & 2033
- Figure 42: Middle East & Africa Livestock Ear Tags Volume Share (%), by Application 2025 & 2033
- Figure 43: Middle East & Africa Livestock Ear Tags Revenue (billion), by Types 2025 & 2033
- Figure 44: Middle East & Africa Livestock Ear Tags Volume (K), by Types 2025 & 2033
- Figure 45: Middle East & Africa Livestock Ear Tags Revenue Share (%), by Types 2025 & 2033
- Figure 46: Middle East & Africa Livestock Ear Tags Volume Share (%), by Types 2025 & 2033
- Figure 47: Middle East & Africa Livestock Ear Tags Revenue (billion), by Country 2025 & 2033
- Figure 48: Middle East & Africa Livestock Ear Tags Volume (K), by Country 2025 & 2033
- Figure 49: Middle East & Africa Livestock Ear Tags Revenue Share (%), by Country 2025 & 2033
- Figure 50: Middle East & Africa Livestock Ear Tags Volume Share (%), by Country 2025 & 2033
- Figure 51: Asia Pacific Livestock Ear Tags Revenue (billion), by Application 2025 & 2033
- Figure 52: Asia Pacific Livestock Ear Tags Volume (K), by Application 2025 & 2033
- Figure 53: Asia Pacific Livestock Ear Tags Revenue Share (%), by Application 2025 & 2033
- Figure 54: Asia Pacific Livestock Ear Tags Volume Share (%), by Application 2025 & 2033
- Figure 55: Asia Pacific Livestock Ear Tags Revenue (billion), by Types 2025 & 2033
- Figure 56: Asia Pacific Livestock Ear Tags Volume (K), by Types 2025 & 2033
- Figure 57: Asia Pacific Livestock Ear Tags Revenue Share (%), by Types 2025 & 2033
- Figure 58: Asia Pacific Livestock Ear Tags Volume Share (%), by Types 2025 & 2033
- Figure 59: Asia Pacific Livestock Ear Tags Revenue (billion), by Country 2025 & 2033
- Figure 60: Asia Pacific Livestock Ear Tags Volume (K), by Country 2025 & 2033
- Figure 61: Asia Pacific Livestock Ear Tags Revenue Share (%), by Country 2025 & 2033
- Figure 62: Asia Pacific Livestock Ear Tags Volume Share (%), by Country 2025 & 2033
List of Tables
- Table 1: Global Livestock Ear Tags Revenue billion Forecast, by Application 2020 & 2033
- Table 2: Global Livestock Ear Tags Volume K Forecast, by Application 2020 & 2033
- Table 3: Global Livestock Ear Tags Revenue billion Forecast, by Types 2020 & 2033
- Table 4: Global Livestock Ear Tags Volume K Forecast, by Types 2020 & 2033
- Table 5: Global Livestock Ear Tags Revenue billion Forecast, by Region 2020 & 2033
- Table 6: Global Livestock Ear Tags Volume K Forecast, by Region 2020 & 2033
- Table 7: Global Livestock Ear Tags Revenue billion Forecast, by Application 2020 & 2033
- Table 8: Global Livestock Ear Tags Volume K Forecast, by Application 2020 & 2033
- Table 9: Global Livestock Ear Tags Revenue billion Forecast, by Types 2020 & 2033
- Table 10: Global Livestock Ear Tags Volume K Forecast, by Types 2020 & 2033
- Table 11: Global Livestock Ear Tags Revenue billion Forecast, by Country 2020 & 2033
- Table 12: Global Livestock Ear Tags Volume K Forecast, by Country 2020 & 2033
- Table 13: United States Livestock Ear Tags Revenue (billion) Forecast, by Application 2020 & 2033
- Table 14: United States Livestock Ear Tags Volume (K) Forecast, by Application 2020 & 2033
- Table 15: Canada Livestock Ear Tags Revenue (billion) Forecast, by Application 2020 & 2033
- Table 16: Canada Livestock Ear Tags Volume (K) Forecast, by Application 2020 & 2033
- Table 17: Mexico Livestock Ear Tags Revenue (billion) Forecast, by Application 2020 & 2033
- Table 18: Mexico Livestock Ear Tags Volume (K) Forecast, by Application 2020 & 2033
- Table 19: Global Livestock Ear Tags Revenue billion Forecast, by Application 2020 & 2033
- Table 20: Global Livestock Ear Tags Volume K Forecast, by Application 2020 & 2033
- Table 21: Global Livestock Ear Tags Revenue billion Forecast, by Types 2020 & 2033
- Table 22: Global Livestock Ear Tags Volume K Forecast, by Types 2020 & 2033
- Table 23: Global Livestock Ear Tags Revenue billion Forecast, by Country 2020 & 2033
- Table 24: Global Livestock Ear Tags Volume K Forecast, by Country 2020 & 2033
- Table 25: Brazil Livestock Ear Tags Revenue (billion) Forecast, by Application 2020 & 2033
- Table 26: Brazil Livestock Ear Tags Volume (K) Forecast, by Application 2020 & 2033
- Table 27: Argentina Livestock Ear Tags Revenue (billion) Forecast, by Application 2020 & 2033
- Table 28: Argentina Livestock Ear Tags Volume (K) Forecast, by Application 2020 & 2033
- Table 29: Rest of South America Livestock Ear Tags Revenue (billion) Forecast, by Application 2020 & 2033
- Table 30: Rest of South America Livestock Ear Tags Volume (K) Forecast, by Application 2020 & 2033
- Table 31: Global Livestock Ear Tags Revenue billion Forecast, by Application 2020 & 2033
- Table 32: Global Livestock Ear Tags Volume K Forecast, by Application 2020 & 2033
- Table 33: Global Livestock Ear Tags Revenue billion Forecast, by Types 2020 & 2033
- Table 34: Global Livestock Ear Tags Volume K Forecast, by Types 2020 & 2033
- Table 35: Global Livestock Ear Tags Revenue billion Forecast, by Country 2020 & 2033
- Table 36: Global Livestock Ear Tags Volume K Forecast, by Country 2020 & 2033
- Table 37: United Kingdom Livestock Ear Tags Revenue (billion) Forecast, by Application 2020 & 2033
- Table 38: United Kingdom Livestock Ear Tags Volume (K) Forecast, by Application 2020 & 2033
- Table 39: Germany Livestock Ear Tags Revenue (billion) Forecast, by Application 2020 & 2033
- Table 40: Germany Livestock Ear Tags Volume (K) Forecast, by Application 2020 & 2033
- Table 41: France Livestock Ear Tags Revenue (billion) Forecast, by Application 2020 & 2033
- Table 42: France Livestock Ear Tags Volume (K) Forecast, by Application 2020 & 2033
- Table 43: Italy Livestock Ear Tags Revenue (billion) Forecast, by Application 2020 & 2033
- Table 44: Italy Livestock Ear Tags Volume (K) Forecast, by Application 2020 & 2033
- Table 45: Spain Livestock Ear Tags Revenue (billion) Forecast, by Application 2020 & 2033
- Table 46: Spain Livestock Ear Tags Volume (K) Forecast, by Application 2020 & 2033
- Table 47: Russia Livestock Ear Tags Revenue (billion) Forecast, by Application 2020 & 2033
- Table 48: Russia Livestock Ear Tags Volume (K) Forecast, by Application 2020 & 2033
- Table 49: Benelux Livestock Ear Tags Revenue (billion) Forecast, by Application 2020 & 2033
- Table 50: Benelux Livestock Ear Tags Volume (K) Forecast, by Application 2020 & 2033
- Table 51: Nordics Livestock Ear Tags Revenue (billion) Forecast, by Application 2020 & 2033
- Table 52: Nordics Livestock Ear Tags Volume (K) Forecast, by Application 2020 & 2033
- Table 53: Rest of Europe Livestock Ear Tags Revenue (billion) Forecast, by Application 2020 & 2033
- Table 54: Rest of Europe Livestock Ear Tags Volume (K) Forecast, by Application 2020 & 2033
- Table 55: Global Livestock Ear Tags Revenue billion Forecast, by Application 2020 & 2033
- Table 56: Global Livestock Ear Tags Volume K Forecast, by Application 2020 & 2033
- Table 57: Global Livestock Ear Tags Revenue billion Forecast, by Types 2020 & 2033
- Table 58: Global Livestock Ear Tags Volume K Forecast, by Types 2020 & 2033
- Table 59: Global Livestock Ear Tags Revenue billion Forecast, by Country 2020 & 2033
- Table 60: Global Livestock Ear Tags Volume K Forecast, by Country 2020 & 2033
- Table 61: Turkey Livestock Ear Tags Revenue (billion) Forecast, by Application 2020 & 2033
- Table 62: Turkey Livestock Ear Tags Volume (K) Forecast, by Application 2020 & 2033
- Table 63: Israel Livestock Ear Tags Revenue (billion) Forecast, by Application 2020 & 2033
- Table 64: Israel Livestock Ear Tags Volume (K) Forecast, by Application 2020 & 2033
- Table 65: GCC Livestock Ear Tags Revenue (billion) Forecast, by Application 2020 & 2033
- Table 66: GCC Livestock Ear Tags Volume (K) Forecast, by Application 2020 & 2033
- Table 67: North Africa Livestock Ear Tags Revenue (billion) Forecast, by Application 2020 & 2033
- Table 68: North Africa Livestock Ear Tags Volume (K) Forecast, by Application 2020 & 2033
- Table 69: South Africa Livestock Ear Tags Revenue (billion) Forecast, by Application 2020 & 2033
- Table 70: South Africa Livestock Ear Tags Volume (K) Forecast, by Application 2020 & 2033
- Table 71: Rest of Middle East & Africa Livestock Ear Tags Revenue (billion) Forecast, by Application 2020 & 2033
- Table 72: Rest of Middle East & Africa Livestock Ear Tags Volume (K) Forecast, by Application 2020 & 2033
- Table 73: Global Livestock Ear Tags Revenue billion Forecast, by Application 2020 & 2033
- Table 74: Global Livestock Ear Tags Volume K Forecast, by Application 2020 & 2033
- Table 75: Global Livestock Ear Tags Revenue billion Forecast, by Types 2020 & 2033
- Table 76: Global Livestock Ear Tags Volume K Forecast, by Types 2020 & 2033
- Table 77: Global Livestock Ear Tags Revenue billion Forecast, by Country 2020 & 2033
- Table 78: Global Livestock Ear Tags Volume K Forecast, by Country 2020 & 2033
- Table 79: China Livestock Ear Tags Revenue (billion) Forecast, by Application 2020 & 2033
- Table 80: China Livestock Ear Tags Volume (K) Forecast, by Application 2020 & 2033
- Table 81: India Livestock Ear Tags Revenue (billion) Forecast, by Application 2020 & 2033
- Table 82: India Livestock Ear Tags Volume (K) Forecast, by Application 2020 & 2033
- Table 83: Japan Livestock Ear Tags Revenue (billion) Forecast, by Application 2020 & 2033
- Table 84: Japan Livestock Ear Tags Volume (K) Forecast, by Application 2020 & 2033
- Table 85: South Korea Livestock Ear Tags Revenue (billion) Forecast, by Application 2020 & 2033
- Table 86: South Korea Livestock Ear Tags Volume (K) Forecast, by Application 2020 & 2033
- Table 87: ASEAN Livestock Ear Tags Revenue (billion) Forecast, by Application 2020 & 2033
- Table 88: ASEAN Livestock Ear Tags Volume (K) Forecast, by Application 2020 & 2033
- Table 89: Oceania Livestock Ear Tags Revenue (billion) Forecast, by Application 2020 & 2033
- Table 90: Oceania Livestock Ear Tags Volume (K) Forecast, by Application 2020 & 2033
- Table 91: Rest of Asia Pacific Livestock Ear Tags Revenue (billion) Forecast, by Application 2020 & 2033
- Table 92: Rest of Asia Pacific Livestock Ear Tags Volume (K) Forecast, by Application 2020 & 2033
Frequently Asked Questions
1. What is the projected Compound Annual Growth Rate (CAGR) of the Livestock Ear Tags?
The projected CAGR is approximately 8.1%.
2. Which companies are prominent players in the Livestock Ear Tags?
Key companies in the market include Quantified AG, Allflex, Ceres Tag, Ardes, Luoyang Laipson Information Technology, Kupsan, Stockbrands, CowManager BV, HerdDogg, MOOvement, Moocall, Datamars SA, Drovers, Caisley International GmbH, Dalton Tags.
3. What are the main segments of the Livestock Ear Tags?
The market segments include Application, Types.
4. Can you provide details about the market size?
The market size is estimated to be USD 1.74 billion as of 2022.
5. What are some drivers contributing to market growth?
N/A
6. What are the notable trends driving market growth?
N/A
7. Are there any restraints impacting market growth?
N/A
8. Can you provide examples of recent developments in the market?
N/A
9. What pricing options are available for accessing the report?
Pricing options include single-user, multi-user, and enterprise licenses priced at USD 3350.00, USD 5025.00, and USD 6700.00 respectively.
10. Is the market size provided in terms of value or volume?
The market size is provided in terms of value, measured in billion and volume, measured in K.
11. Are there any specific market keywords associated with the report?
Yes, the market keyword associated with the report is "Livestock Ear Tags," which aids in identifying and referencing the specific market segment covered.
12. How do I determine which pricing option suits my needs best?
The pricing options vary based on user requirements and access needs. Individual users may opt for single-user licenses, while businesses requiring broader access may choose multi-user or enterprise licenses for cost-effective access to the report.
13. Are there any additional resources or data provided in the Livestock Ear Tags report?
While the report offers comprehensive insights, it's advisable to review the specific contents or supplementary materials provided to ascertain if additional resources or data are available.
14. How can I stay updated on further developments or reports in the Livestock Ear Tags?
To stay informed about further developments, trends, and reports in the Livestock Ear Tags, consider subscribing to industry newsletters, following relevant companies and organizations, or regularly checking reputable industry news sources and publications.
Methodology
Step 1 - Identification of Relevant Samples Size from Population Database


Step 2 - Approaches for Defining Global Market Size (Value, Volume* & Price*)

Note*: In applicable scenarios
Step 3 - Data Sources
Primary Research
- Web Analytics
- Survey Reports
- Research Institute
- Latest Research Reports
- Opinion Leaders
Secondary Research
- Annual Reports
- White Paper
- Latest Press Release
- Industry Association
- Paid Database
- Investor Presentations

Step 4 - Data Triangulation
Involves using different sources of information in order to increase the validity of a study
These sources are likely to be stakeholders in a program - participants, other researchers, program staff, other community members, and so on.
Then we put all data in single framework & apply various statistical tools to find out the dynamic on the market.
During the analysis stage, feedback from the stakeholder groups would be compared to determine areas of agreement as well as areas of divergence