

Key Insights
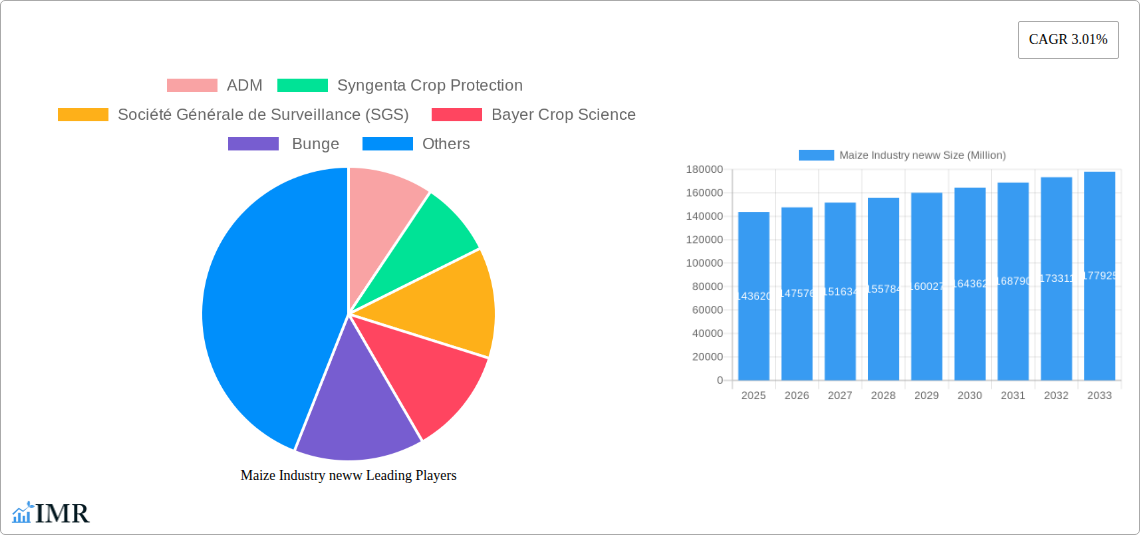
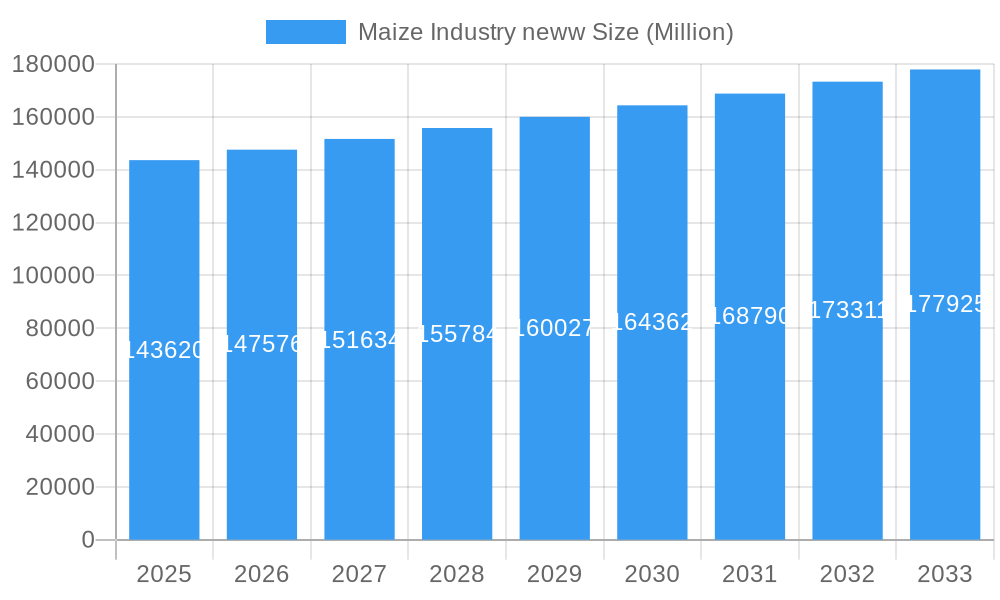
The global maize industry, valued at $143.62 billion in 2025, is projected to experience steady growth, exhibiting a compound annual growth rate (CAGR) of 3.01% from 2025 to 2033. This growth is driven by several key factors. Firstly, increasing demand for maize in the food and beverage sector, particularly for processed foods and sweeteners, fuels market expansion. Secondly, the substantial use of maize as animal feed, driven by the growing global livestock population, contributes significantly to market demand. Finally, the expanding biofuel industry, utilizing maize as a feedstock for ethanol production, presents a significant avenue for growth. While challenges exist, such as fluctuations in agricultural yields due to climate change and price volatility influenced by global trade dynamics, these are largely mitigated by advancements in hybrid seed technology that enhances crop productivity and resilience. The industry's segmentation into product types (hybrid seeds, yellow maize, white maize, sweet corn, popcorn) and end-users (food & beverage, feed, biofuels) provides avenues for targeted market penetration and growth strategies for key players like ADM, Syngenta, Bayer Crop Science, Bunge, Cargill, and Corteva Agriscience. Regional variations in market size and growth rates are expected, with North America and Asia-Pacific likely to remain dominant markets, driven by their established agricultural infrastructure and large consumer bases.
Maize Industry neww Market Size (In Billion)
The competitive landscape is characterized by the presence of major multinational corporations controlling a significant portion of the maize production, processing, and distribution chain. These companies continuously invest in research and development to improve seed varieties, enhance farming practices, and explore new applications for maize products. Strategic alliances, mergers, and acquisitions also shape the industry's competitive dynamics. The forecast period of 2025-2033 will see continued consolidation within the industry, as companies strive to increase efficiency, secure supply chains, and cater to evolving consumer preferences. Government policies promoting sustainable agricultural practices and biofuel production will further influence the trajectory of the maize industry during this period. Furthermore, increasing awareness of food security and the need for resilient agricultural systems will drive innovation and growth within this critical sector.
Maize Industry neww Company Market Share
Maize Industry Market Report: 2019-2033
This comprehensive report provides a detailed analysis of the global maize industry, encompassing market dynamics, growth trends, regional performance, and key players. With a focus on the parent market (agricultural commodities) and child markets (food & beverage, feed, biofuels), this report offers invaluable insights for industry professionals, investors, and stakeholders seeking to navigate this dynamic sector. The study period spans 2019-2033, with a base year of 2025 and a forecast period of 2025-2033. Market values are presented in million units.
Maize Industry Market Dynamics & Structure
The global maize market is characterized by moderate concentration, with key players like ADM, Cargill, and Bunge holding significant market share (estimated at xx% collectively in 2025). Technological innovations, particularly in seed genetics (hybrid seeds) and precision agriculture, are driving productivity gains. Stringent regulatory frameworks concerning GMOs and food safety influence market operations, while the availability of alternative grains creates competitive pressure. Mergers and acquisitions (M&A) activity remains robust, with xx M&A deals recorded between 2019-2024, primarily focused on consolidating supply chains and expanding geographic reach. End-user demographics are shifting towards increased demand from the feed and biofuels sectors, driven by growing livestock populations and biofuel mandates.
- Market Concentration: Moderately concentrated, with top 3 players holding xx% market share (2025).
- Technological Innovation: Focus on hybrid seeds, precision agriculture, and improved processing technologies.
- Regulatory Framework: Stringent regulations on GMOs and food safety standards.
- Competitive Substitutes: Other grains like sorghum and barley pose competitive pressure.
- End-User Demographics: Growing demand from feed and biofuels sectors.
- M&A Trends: xx M&A deals (2019-2024), focusing on supply chain consolidation and geographic expansion.
Maize Industry Growth Trends & Insights
The global maize market exhibited a CAGR of xx% during the historical period (2019-2024), driven by rising global demand and increased acreage. This growth trajectory is projected to continue during the forecast period (2025-2033), with a projected CAGR of xx%. Factors driving this growth include increasing consumption in developing economies, rising livestock populations fueling feed demand, and growing adoption of maize in biofuel production. Technological disruptions like precision agriculture and improved seed varieties are enhancing yields and contributing to efficiency gains. Consumer behavior shifts towards healthier food options are influencing demand for specific maize varieties like sweet corn and popcorn. Market penetration in key emerging markets remains significant potential for future growth.
Dominant Regions, Countries, or Segments in Maize Industry
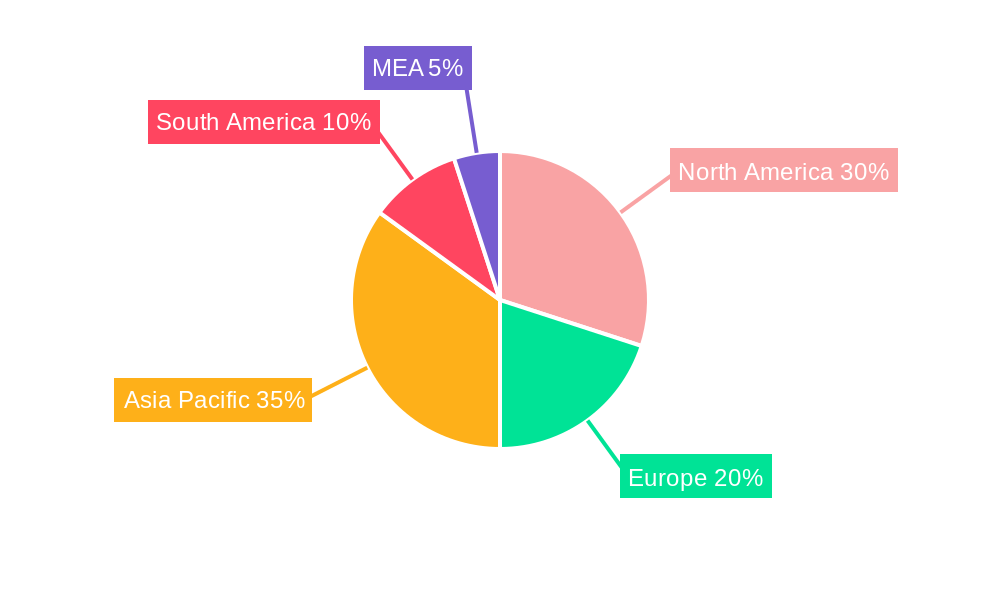
The North American region dominates the global maize market, accounting for xx% of global production in 2025, followed by South America and Asia. Within product types, Yellow Maize holds the largest market share (xx%), driven by its widespread use in feed and food applications. The Feed sector is the leading end-user segment, accounting for xx% of total maize consumption. Key drivers for regional dominance include favorable climatic conditions, advanced agricultural practices, and supportive government policies.
- Leading Region: North America (xx% market share in 2025).
- Leading Product Type: Yellow Maize (xx% market share in 2025).
- Leading End-User: Feed sector (xx% market share in 2025).
- Key Drivers: Favorable climate, advanced agricultural practices, supportive government policies.
Maize Industry Product Landscape
The maize industry offers a diverse product portfolio including hybrid seeds engineered for enhanced yields and pest resistance, yellow maize for various applications, white maize primarily used in food, sweet corn for direct consumption, and popcorn for snacking. Technological advancements focus on improving nutritional content, enhancing shelf life, and developing drought-resistant varieties. Unique selling propositions revolve around yield optimization, disease resistance, and superior processing qualities.
Key Drivers, Barriers & Challenges in Maize Industry
Key Drivers: Rising global population driving food and feed demand, increasing biofuel mandates, technological advancements in seed genetics and farming techniques, and supportive government policies promoting agricultural growth.
Key Challenges: Climate change impacting crop yields, fluctuating commodity prices, pest and disease outbreaks, and trade restrictions impacting global supply chains. These factors collectively resulted in a xx% decrease in maize production in [Specific region/year, if data available, otherwise use predicted value or xx] due to [Specific cause, e.g., drought].
Emerging Opportunities in Maize Industry
Emerging opportunities lie in the development of high-value maize products like bio-based plastics and specialty starches, expanding into untapped markets in Africa and Asia, and catering to the growing demand for organic and non-GMO maize. Further opportunities exist in developing drought-resistant and climate-resilient varieties to address the challenges posed by climate change.
Growth Accelerators in the Maize Industry
Strategic partnerships between seed companies, agricultural technology providers, and food processors are accelerating innovation and market expansion. Investments in precision agriculture, including the adoption of IoT and AI technologies, are enhancing efficiency and optimizing yields. Expanding into new markets and diversifying product offerings are key strategies for long-term growth.
Key Players Shaping the Maize Industry Market
Notable Milestones in Maize Industry Sector
- November 2021: Fufeng Group's plan to build a USD 700 million corn wet milling plant in China signals significant investment in maize processing.
- May 2022: The Indian government's initiative to boost maize production through MSP (Minimum Support Price) demonstrates policy support for the sector.
- October 2022: Inauguration of an ultramodern maize processing factory in Ghana highlights growing investment in maize processing infrastructure in Africa.
In-Depth Maize Industry Market Outlook
The maize industry is poised for continued growth, driven by robust demand from food, feed, and biofuel sectors. Strategic investments in technological advancements, coupled with supportive government policies and increasing consumer awareness, will further enhance market expansion. Companies focusing on sustainable and efficient agricultural practices, while adapting to climate change challenges, will be well-positioned to capture significant market share in the years to come.
Maize Industry neww Segmentation
- 1. Production Analysis
- 2. Consumption Analysis
- 3. Import Market Analysis (Value & Volume)
- 4. Export Market Analysis (Value & Volume)
- 5. Price Trend Analysis
Maize Industry neww Segmentation By Geography
-
1. North America
- 1.1. United States
- 1.2. Canada
- 1.3. Mexico
-
2. Europe
- 2.1. Spain
- 2.2. Italy
- 2.3. France
- 2.4. Germany
- 2.5. Russia
-
3. Asia Pacific
- 3.1. India
- 3.2. China
- 3.3. Vietnam
-
4. South America
- 4.1. Brazil
- 4.2. Argentina
-
5. Africa
- 5.1. South Africa
- 5.2. Nigeria
Maize Industry neww Regional Market Share
Geographic Coverage of Maize Industry neww
Maize Industry neww REPORT HIGHLIGHTS
| Aspects | Details |
|---|---|
| Study Period | 2020-2034 |
| Base Year | 2025 |
| Estimated Year | 2026 |
| Forecast Period | 2026-2034 |
| Historical Period | 2020-2025 |
| Growth Rate | CAGR of 3.01% from 2020-2034 |
| Segmentation |
|
Table of Contents
- 1. Introduction
- 1.1. Research Scope
- 1.2. Market Segmentation
- 1.3. Research Objective
- 1.4. Definitions and Assumptions
- 2. Executive Summary
- 2.1. Market Snapshot
- 3. Market Dynamics
- 3.1. Market Drivers
- 3.2. Market Restrains
- 3.3. Market Trends
- 3.4. Market Opportunities
- 4. Market Factor Analysis
- 4.1. Porters Five Forces
- 4.1.1. Bargaining Power of Suppliers
- 4.1.2. Bargaining Power of Buyers
- 4.1.3. Threat of New Entrants
- 4.1.4. Threat of Substitutes
- 4.1.5. Competitive Rivalry
- 4.2. PESTEL analysis
- 4.3. BCG Analysis
- 4.3.1. Stars (High Growth, High Market Share)
- 4.3.2. Cash Cows (Low Growth, High Market Share)
- 4.3.3. Question Mark (High Growth, Low Market Share)
- 4.3.4. Dogs (Low Growth, Low Market Share)
- 4.4. Ansoff Matrix Analysis
- 4.5. Supply Chain Analysis
- 4.6. Regulatory Landscape
- 4.7. Current Market Potential and Opportunity Assessment (TAM–SAM–SOM Framework)
- 4.8. IMR Analyst Note
- 4.1. Porters Five Forces
- 5. Market Analysis, Insights and Forecast 2021-2033
- 5.1. Market Analysis, Insights and Forecast - by Production Analysis
- 5.2. Market Analysis, Insights and Forecast - by Consumption Analysis
- 5.3. Market Analysis, Insights and Forecast - by Import Market Analysis (Value & Volume)
- 5.4. Market Analysis, Insights and Forecast - by Export Market Analysis (Value & Volume)
- 5.5. Market Analysis, Insights and Forecast - by Price Trend Analysis
- 5.6. Market Analysis, Insights and Forecast - by Region
- 5.6.1. North America
- 5.6.2. Europe
- 5.6.3. Asia Pacific
- 5.6.4. South America
- 5.6.5. Africa
- 6. Global Maize Industry neww Analysis, Insights and Forecast, 2021-2033
- 6.1. Market Analysis, Insights and Forecast - by Production Analysis
- 6.2. Market Analysis, Insights and Forecast - by Consumption Analysis
- 6.3. Market Analysis, Insights and Forecast - by Import Market Analysis (Value & Volume)
- 6.4. Market Analysis, Insights and Forecast - by Export Market Analysis (Value & Volume)
- 6.5. Market Analysis, Insights and Forecast - by Price Trend Analysis
- 7. North America Maize Industry neww Analysis, Insights and Forecast, 2020-2032
- 7.1. Market Analysis, Insights and Forecast - by Production Analysis
- 7.2. Market Analysis, Insights and Forecast - by Consumption Analysis
- 7.3. Market Analysis, Insights and Forecast - by Import Market Analysis (Value & Volume)
- 7.4. Market Analysis, Insights and Forecast - by Export Market Analysis (Value & Volume)
- 7.5. Market Analysis, Insights and Forecast - by Price Trend Analysis
- 8. Europe Maize Industry neww Analysis, Insights and Forecast, 2020-2032
- 8.1. Market Analysis, Insights and Forecast - by Production Analysis
- 8.2. Market Analysis, Insights and Forecast - by Consumption Analysis
- 8.3. Market Analysis, Insights and Forecast - by Import Market Analysis (Value & Volume)
- 8.4. Market Analysis, Insights and Forecast - by Export Market Analysis (Value & Volume)
- 8.5. Market Analysis, Insights and Forecast - by Price Trend Analysis
- 9. Asia Pacific Maize Industry neww Analysis, Insights and Forecast, 2020-2032
- 9.1. Market Analysis, Insights and Forecast - by Production Analysis
- 9.2. Market Analysis, Insights and Forecast - by Consumption Analysis
- 9.3. Market Analysis, Insights and Forecast - by Import Market Analysis (Value & Volume)
- 9.4. Market Analysis, Insights and Forecast - by Export Market Analysis (Value & Volume)
- 9.5. Market Analysis, Insights and Forecast - by Price Trend Analysis
- 10. South America Maize Industry neww Analysis, Insights and Forecast, 2020-2032
- 10.1. Market Analysis, Insights and Forecast - by Production Analysis
- 10.2. Market Analysis, Insights and Forecast - by Consumption Analysis
- 10.3. Market Analysis, Insights and Forecast - by Import Market Analysis (Value & Volume)
- 10.4. Market Analysis, Insights and Forecast - by Export Market Analysis (Value & Volume)
- 10.5. Market Analysis, Insights and Forecast - by Price Trend Analysis
- 11. Africa Maize Industry neww Analysis, Insights and Forecast, 2020-2032
- 11.1. Market Analysis, Insights and Forecast - by Production Analysis
- 11.2. Market Analysis, Insights and Forecast - by Consumption Analysis
- 11.3. Market Analysis, Insights and Forecast - by Import Market Analysis (Value & Volume)
- 11.4. Market Analysis, Insights and Forecast - by Export Market Analysis (Value & Volume)
- 11.5. Market Analysis, Insights and Forecast - by Price Trend Analysis
- 12. Competitive Analysis
- 12.1. Company Profiles
- 12.1.1 ADM
- 12.1.1.1. Company Overview
- 12.1.1.2. Products
- 12.1.1.3. Company Financials
- 12.1.1.4. SWOT Analysis
- 12.1.2 Syngenta Crop Protection
- 12.1.2.1. Company Overview
- 12.1.2.2. Products
- 12.1.2.3. Company Financials
- 12.1.2.4. SWOT Analysis
- 12.1.3 Société Générale de Surveillance (SGS)
- 12.1.3.1. Company Overview
- 12.1.3.2. Products
- 12.1.3.3. Company Financials
- 12.1.3.4. SWOT Analysis
- 12.1.4 Bayer Crop Science
- 12.1.4.1. Company Overview
- 12.1.4.2. Products
- 12.1.4.3. Company Financials
- 12.1.4.4. SWOT Analysis
- 12.1.5 Bunge
- 12.1.5.1. Company Overview
- 12.1.5.2. Products
- 12.1.5.3. Company Financials
- 12.1.5.4. SWOT Analysis
- 12.1.6 Bunge Limited
- 12.1.6.1. Company Overview
- 12.1.6.2. Products
- 12.1.6.3. Company Financials
- 12.1.6.4. SWOT Analysis
- 12.1.7 Cargill Incorporated
- 12.1.7.1. Company Overview
- 12.1.7.2. Products
- 12.1.7.3. Company Financials
- 12.1.7.4. SWOT Analysis
- 12.1.8 Corteva Agriscience
- 12.1.8.1. Company Overview
- 12.1.8.2. Products
- 12.1.8.3. Company Financials
- 12.1.8.4. SWOT Analysis
- 12.1.9 ADM
- 12.1.9.1. Company Overview
- 12.1.9.2. Products
- 12.1.9.3. Company Financials
- 12.1.9.4. SWOT Analysis
- 12.1.10 Olam Group
- 12.1.10.1. Company Overview
- 12.1.10.2. Products
- 12.1.10.3. Company Financials
- 12.1.10.4. SWOT Analysis
- 12.1.1 ADM
- 12.2. Market Entropy
- 12.2.1 Company's Key Areas Served
- 12.2.2 Recent Developments
- 12.3. Company Market Share Analysis 2025
- 12.3.1 Top 5 Companies Market Share Analysis
- 12.3.2 Top 3 Companies Market Share Analysis
- 12.4. List of Potential Customers
- 13. Research Methodology
List of Figures
- Figure 1: Global Maize Industry neww Revenue Breakdown (Million, %) by Region 2025 & 2033
- Figure 2: Global Maize Industry neww Volume Breakdown (Kiloton, %) by Region 2025 & 2033
- Figure 3: North America Maize Industry neww Revenue (Million), by Production Analysis 2025 & 2033
- Figure 4: North America Maize Industry neww Volume (Kiloton), by Production Analysis 2025 & 2033
- Figure 5: North America Maize Industry neww Revenue Share (%), by Production Analysis 2025 & 2033
- Figure 6: North America Maize Industry neww Volume Share (%), by Production Analysis 2025 & 2033
- Figure 7: North America Maize Industry neww Revenue (Million), by Consumption Analysis 2025 & 2033
- Figure 8: North America Maize Industry neww Volume (Kiloton), by Consumption Analysis 2025 & 2033
- Figure 9: North America Maize Industry neww Revenue Share (%), by Consumption Analysis 2025 & 2033
- Figure 10: North America Maize Industry neww Volume Share (%), by Consumption Analysis 2025 & 2033
- Figure 11: North America Maize Industry neww Revenue (Million), by Import Market Analysis (Value & Volume) 2025 & 2033
- Figure 12: North America Maize Industry neww Volume (Kiloton), by Import Market Analysis (Value & Volume) 2025 & 2033
- Figure 13: North America Maize Industry neww Revenue Share (%), by Import Market Analysis (Value & Volume) 2025 & 2033
- Figure 14: North America Maize Industry neww Volume Share (%), by Import Market Analysis (Value & Volume) 2025 & 2033
- Figure 15: North America Maize Industry neww Revenue (Million), by Export Market Analysis (Value & Volume) 2025 & 2033
- Figure 16: North America Maize Industry neww Volume (Kiloton), by Export Market Analysis (Value & Volume) 2025 & 2033
- Figure 17: North America Maize Industry neww Revenue Share (%), by Export Market Analysis (Value & Volume) 2025 & 2033
- Figure 18: North America Maize Industry neww Volume Share (%), by Export Market Analysis (Value & Volume) 2025 & 2033
- Figure 19: North America Maize Industry neww Revenue (Million), by Price Trend Analysis 2025 & 2033
- Figure 20: North America Maize Industry neww Volume (Kiloton), by Price Trend Analysis 2025 & 2033
- Figure 21: North America Maize Industry neww Revenue Share (%), by Price Trend Analysis 2025 & 2033
- Figure 22: North America Maize Industry neww Volume Share (%), by Price Trend Analysis 2025 & 2033
- Figure 23: North America Maize Industry neww Revenue (Million), by Country 2025 & 2033
- Figure 24: North America Maize Industry neww Volume (Kiloton), by Country 2025 & 2033
- Figure 25: North America Maize Industry neww Revenue Share (%), by Country 2025 & 2033
- Figure 26: North America Maize Industry neww Volume Share (%), by Country 2025 & 2033
- Figure 27: Europe Maize Industry neww Revenue (Million), by Production Analysis 2025 & 2033
- Figure 28: Europe Maize Industry neww Volume (Kiloton), by Production Analysis 2025 & 2033
- Figure 29: Europe Maize Industry neww Revenue Share (%), by Production Analysis 2025 & 2033
- Figure 30: Europe Maize Industry neww Volume Share (%), by Production Analysis 2025 & 2033
- Figure 31: Europe Maize Industry neww Revenue (Million), by Consumption Analysis 2025 & 2033
- Figure 32: Europe Maize Industry neww Volume (Kiloton), by Consumption Analysis 2025 & 2033
- Figure 33: Europe Maize Industry neww Revenue Share (%), by Consumption Analysis 2025 & 2033
- Figure 34: Europe Maize Industry neww Volume Share (%), by Consumption Analysis 2025 & 2033
- Figure 35: Europe Maize Industry neww Revenue (Million), by Import Market Analysis (Value & Volume) 2025 & 2033
- Figure 36: Europe Maize Industry neww Volume (Kiloton), by Import Market Analysis (Value & Volume) 2025 & 2033
- Figure 37: Europe Maize Industry neww Revenue Share (%), by Import Market Analysis (Value & Volume) 2025 & 2033
- Figure 38: Europe Maize Industry neww Volume Share (%), by Import Market Analysis (Value & Volume) 2025 & 2033
- Figure 39: Europe Maize Industry neww Revenue (Million), by Export Market Analysis (Value & Volume) 2025 & 2033
- Figure 40: Europe Maize Industry neww Volume (Kiloton), by Export Market Analysis (Value & Volume) 2025 & 2033
- Figure 41: Europe Maize Industry neww Revenue Share (%), by Export Market Analysis (Value & Volume) 2025 & 2033
- Figure 42: Europe Maize Industry neww Volume Share (%), by Export Market Analysis (Value & Volume) 2025 & 2033
- Figure 43: Europe Maize Industry neww Revenue (Million), by Price Trend Analysis 2025 & 2033
- Figure 44: Europe Maize Industry neww Volume (Kiloton), by Price Trend Analysis 2025 & 2033
- Figure 45: Europe Maize Industry neww Revenue Share (%), by Price Trend Analysis 2025 & 2033
- Figure 46: Europe Maize Industry neww Volume Share (%), by Price Trend Analysis 2025 & 2033
- Figure 47: Europe Maize Industry neww Revenue (Million), by Country 2025 & 2033
- Figure 48: Europe Maize Industry neww Volume (Kiloton), by Country 2025 & 2033
- Figure 49: Europe Maize Industry neww Revenue Share (%), by Country 2025 & 2033
- Figure 50: Europe Maize Industry neww Volume Share (%), by Country 2025 & 2033
- Figure 51: Asia Pacific Maize Industry neww Revenue (Million), by Production Analysis 2025 & 2033
- Figure 52: Asia Pacific Maize Industry neww Volume (Kiloton), by Production Analysis 2025 & 2033
- Figure 53: Asia Pacific Maize Industry neww Revenue Share (%), by Production Analysis 2025 & 2033
- Figure 54: Asia Pacific Maize Industry neww Volume Share (%), by Production Analysis 2025 & 2033
- Figure 55: Asia Pacific Maize Industry neww Revenue (Million), by Consumption Analysis 2025 & 2033
- Figure 56: Asia Pacific Maize Industry neww Volume (Kiloton), by Consumption Analysis 2025 & 2033
- Figure 57: Asia Pacific Maize Industry neww Revenue Share (%), by Consumption Analysis 2025 & 2033
- Figure 58: Asia Pacific Maize Industry neww Volume Share (%), by Consumption Analysis 2025 & 2033
- Figure 59: Asia Pacific Maize Industry neww Revenue (Million), by Import Market Analysis (Value & Volume) 2025 & 2033
- Figure 60: Asia Pacific Maize Industry neww Volume (Kiloton), by Import Market Analysis (Value & Volume) 2025 & 2033
- Figure 61: Asia Pacific Maize Industry neww Revenue Share (%), by Import Market Analysis (Value & Volume) 2025 & 2033
- Figure 62: Asia Pacific Maize Industry neww Volume Share (%), by Import Market Analysis (Value & Volume) 2025 & 2033
- Figure 63: Asia Pacific Maize Industry neww Revenue (Million), by Export Market Analysis (Value & Volume) 2025 & 2033
- Figure 64: Asia Pacific Maize Industry neww Volume (Kiloton), by Export Market Analysis (Value & Volume) 2025 & 2033
- Figure 65: Asia Pacific Maize Industry neww Revenue Share (%), by Export Market Analysis (Value & Volume) 2025 & 2033
- Figure 66: Asia Pacific Maize Industry neww Volume Share (%), by Export Market Analysis (Value & Volume) 2025 & 2033
- Figure 67: Asia Pacific Maize Industry neww Revenue (Million), by Price Trend Analysis 2025 & 2033
- Figure 68: Asia Pacific Maize Industry neww Volume (Kiloton), by Price Trend Analysis 2025 & 2033
- Figure 69: Asia Pacific Maize Industry neww Revenue Share (%), by Price Trend Analysis 2025 & 2033
- Figure 70: Asia Pacific Maize Industry neww Volume Share (%), by Price Trend Analysis 2025 & 2033
- Figure 71: Asia Pacific Maize Industry neww Revenue (Million), by Country 2025 & 2033
- Figure 72: Asia Pacific Maize Industry neww Volume (Kiloton), by Country 2025 & 2033
- Figure 73: Asia Pacific Maize Industry neww Revenue Share (%), by Country 2025 & 2033
- Figure 74: Asia Pacific Maize Industry neww Volume Share (%), by Country 2025 & 2033
- Figure 75: South America Maize Industry neww Revenue (Million), by Production Analysis 2025 & 2033
- Figure 76: South America Maize Industry neww Volume (Kiloton), by Production Analysis 2025 & 2033
- Figure 77: South America Maize Industry neww Revenue Share (%), by Production Analysis 2025 & 2033
- Figure 78: South America Maize Industry neww Volume Share (%), by Production Analysis 2025 & 2033
- Figure 79: South America Maize Industry neww Revenue (Million), by Consumption Analysis 2025 & 2033
- Figure 80: South America Maize Industry neww Volume (Kiloton), by Consumption Analysis 2025 & 2033
- Figure 81: South America Maize Industry neww Revenue Share (%), by Consumption Analysis 2025 & 2033
- Figure 82: South America Maize Industry neww Volume Share (%), by Consumption Analysis 2025 & 2033
- Figure 83: South America Maize Industry neww Revenue (Million), by Import Market Analysis (Value & Volume) 2025 & 2033
- Figure 84: South America Maize Industry neww Volume (Kiloton), by Import Market Analysis (Value & Volume) 2025 & 2033
- Figure 85: South America Maize Industry neww Revenue Share (%), by Import Market Analysis (Value & Volume) 2025 & 2033
- Figure 86: South America Maize Industry neww Volume Share (%), by Import Market Analysis (Value & Volume) 2025 & 2033
- Figure 87: South America Maize Industry neww Revenue (Million), by Export Market Analysis (Value & Volume) 2025 & 2033
- Figure 88: South America Maize Industry neww Volume (Kiloton), by Export Market Analysis (Value & Volume) 2025 & 2033
- Figure 89: South America Maize Industry neww Revenue Share (%), by Export Market Analysis (Value & Volume) 2025 & 2033
- Figure 90: South America Maize Industry neww Volume Share (%), by Export Market Analysis (Value & Volume) 2025 & 2033
- Figure 91: South America Maize Industry neww Revenue (Million), by Price Trend Analysis 2025 & 2033
- Figure 92: South America Maize Industry neww Volume (Kiloton), by Price Trend Analysis 2025 & 2033
- Figure 93: South America Maize Industry neww Revenue Share (%), by Price Trend Analysis 2025 & 2033
- Figure 94: South America Maize Industry neww Volume Share (%), by Price Trend Analysis 2025 & 2033
- Figure 95: South America Maize Industry neww Revenue (Million), by Country 2025 & 2033
- Figure 96: South America Maize Industry neww Volume (Kiloton), by Country 2025 & 2033
- Figure 97: South America Maize Industry neww Revenue Share (%), by Country 2025 & 2033
- Figure 98: South America Maize Industry neww Volume Share (%), by Country 2025 & 2033
- Figure 99: Africa Maize Industry neww Revenue (Million), by Production Analysis 2025 & 2033
- Figure 100: Africa Maize Industry neww Volume (Kiloton), by Production Analysis 2025 & 2033
- Figure 101: Africa Maize Industry neww Revenue Share (%), by Production Analysis 2025 & 2033
- Figure 102: Africa Maize Industry neww Volume Share (%), by Production Analysis 2025 & 2033
- Figure 103: Africa Maize Industry neww Revenue (Million), by Consumption Analysis 2025 & 2033
- Figure 104: Africa Maize Industry neww Volume (Kiloton), by Consumption Analysis 2025 & 2033
- Figure 105: Africa Maize Industry neww Revenue Share (%), by Consumption Analysis 2025 & 2033
- Figure 106: Africa Maize Industry neww Volume Share (%), by Consumption Analysis 2025 & 2033
- Figure 107: Africa Maize Industry neww Revenue (Million), by Import Market Analysis (Value & Volume) 2025 & 2033
- Figure 108: Africa Maize Industry neww Volume (Kiloton), by Import Market Analysis (Value & Volume) 2025 & 2033
- Figure 109: Africa Maize Industry neww Revenue Share (%), by Import Market Analysis (Value & Volume) 2025 & 2033
- Figure 110: Africa Maize Industry neww Volume Share (%), by Import Market Analysis (Value & Volume) 2025 & 2033
- Figure 111: Africa Maize Industry neww Revenue (Million), by Export Market Analysis (Value & Volume) 2025 & 2033
- Figure 112: Africa Maize Industry neww Volume (Kiloton), by Export Market Analysis (Value & Volume) 2025 & 2033
- Figure 113: Africa Maize Industry neww Revenue Share (%), by Export Market Analysis (Value & Volume) 2025 & 2033
- Figure 114: Africa Maize Industry neww Volume Share (%), by Export Market Analysis (Value & Volume) 2025 & 2033
- Figure 115: Africa Maize Industry neww Revenue (Million), by Price Trend Analysis 2025 & 2033
- Figure 116: Africa Maize Industry neww Volume (Kiloton), by Price Trend Analysis 2025 & 2033
- Figure 117: Africa Maize Industry neww Revenue Share (%), by Price Trend Analysis 2025 & 2033
- Figure 118: Africa Maize Industry neww Volume Share (%), by Price Trend Analysis 2025 & 2033
- Figure 119: Africa Maize Industry neww Revenue (Million), by Country 2025 & 2033
- Figure 120: Africa Maize Industry neww Volume (Kiloton), by Country 2025 & 2033
- Figure 121: Africa Maize Industry neww Revenue Share (%), by Country 2025 & 2033
- Figure 122: Africa Maize Industry neww Volume Share (%), by Country 2025 & 2033
List of Tables
- Table 1: Global Maize Industry neww Revenue Million Forecast, by Production Analysis 2020 & 2033
- Table 2: Global Maize Industry neww Volume Kiloton Forecast, by Production Analysis 2020 & 2033
- Table 3: Global Maize Industry neww Revenue Million Forecast, by Consumption Analysis 2020 & 2033
- Table 4: Global Maize Industry neww Volume Kiloton Forecast, by Consumption Analysis 2020 & 2033
- Table 5: Global Maize Industry neww Revenue Million Forecast, by Import Market Analysis (Value & Volume) 2020 & 2033
- Table 6: Global Maize Industry neww Volume Kiloton Forecast, by Import Market Analysis (Value & Volume) 2020 & 2033
- Table 7: Global Maize Industry neww Revenue Million Forecast, by Export Market Analysis (Value & Volume) 2020 & 2033
- Table 8: Global Maize Industry neww Volume Kiloton Forecast, by Export Market Analysis (Value & Volume) 2020 & 2033
- Table 9: Global Maize Industry neww Revenue Million Forecast, by Price Trend Analysis 2020 & 2033
- Table 10: Global Maize Industry neww Volume Kiloton Forecast, by Price Trend Analysis 2020 & 2033
- Table 11: Global Maize Industry neww Revenue Million Forecast, by Region 2020 & 2033
- Table 12: Global Maize Industry neww Volume Kiloton Forecast, by Region 2020 & 2033
- Table 13: Global Maize Industry neww Revenue Million Forecast, by Production Analysis 2020 & 2033
- Table 14: Global Maize Industry neww Volume Kiloton Forecast, by Production Analysis 2020 & 2033
- Table 15: Global Maize Industry neww Revenue Million Forecast, by Consumption Analysis 2020 & 2033
- Table 16: Global Maize Industry neww Volume Kiloton Forecast, by Consumption Analysis 2020 & 2033
- Table 17: Global Maize Industry neww Revenue Million Forecast, by Import Market Analysis (Value & Volume) 2020 & 2033
- Table 18: Global Maize Industry neww Volume Kiloton Forecast, by Import Market Analysis (Value & Volume) 2020 & 2033
- Table 19: Global Maize Industry neww Revenue Million Forecast, by Export Market Analysis (Value & Volume) 2020 & 2033
- Table 20: Global Maize Industry neww Volume Kiloton Forecast, by Export Market Analysis (Value & Volume) 2020 & 2033
- Table 21: Global Maize Industry neww Revenue Million Forecast, by Price Trend Analysis 2020 & 2033
- Table 22: Global Maize Industry neww Volume Kiloton Forecast, by Price Trend Analysis 2020 & 2033
- Table 23: Global Maize Industry neww Revenue Million Forecast, by Country 2020 & 2033
- Table 24: Global Maize Industry neww Volume Kiloton Forecast, by Country 2020 & 2033
- Table 25: United States Maize Industry neww Revenue (Million) Forecast, by Application 2020 & 2033
- Table 26: United States Maize Industry neww Volume (Kiloton) Forecast, by Application 2020 & 2033
- Table 27: Canada Maize Industry neww Revenue (Million) Forecast, by Application 2020 & 2033
- Table 28: Canada Maize Industry neww Volume (Kiloton) Forecast, by Application 2020 & 2033
- Table 29: Mexico Maize Industry neww Revenue (Million) Forecast, by Application 2020 & 2033
- Table 30: Mexico Maize Industry neww Volume (Kiloton) Forecast, by Application 2020 & 2033
- Table 31: Global Maize Industry neww Revenue Million Forecast, by Production Analysis 2020 & 2033
- Table 32: Global Maize Industry neww Volume Kiloton Forecast, by Production Analysis 2020 & 2033
- Table 33: Global Maize Industry neww Revenue Million Forecast, by Consumption Analysis 2020 & 2033
- Table 34: Global Maize Industry neww Volume Kiloton Forecast, by Consumption Analysis 2020 & 2033
- Table 35: Global Maize Industry neww Revenue Million Forecast, by Import Market Analysis (Value & Volume) 2020 & 2033
- Table 36: Global Maize Industry neww Volume Kiloton Forecast, by Import Market Analysis (Value & Volume) 2020 & 2033
- Table 37: Global Maize Industry neww Revenue Million Forecast, by Export Market Analysis (Value & Volume) 2020 & 2033
- Table 38: Global Maize Industry neww Volume Kiloton Forecast, by Export Market Analysis (Value & Volume) 2020 & 2033
- Table 39: Global Maize Industry neww Revenue Million Forecast, by Price Trend Analysis 2020 & 2033
- Table 40: Global Maize Industry neww Volume Kiloton Forecast, by Price Trend Analysis 2020 & 2033
- Table 41: Global Maize Industry neww Revenue Million Forecast, by Country 2020 & 2033
- Table 42: Global Maize Industry neww Volume Kiloton Forecast, by Country 2020 & 2033
- Table 43: Spain Maize Industry neww Revenue (Million) Forecast, by Application 2020 & 2033
- Table 44: Spain Maize Industry neww Volume (Kiloton) Forecast, by Application 2020 & 2033
- Table 45: Italy Maize Industry neww Revenue (Million) Forecast, by Application 2020 & 2033
- Table 46: Italy Maize Industry neww Volume (Kiloton) Forecast, by Application 2020 & 2033
- Table 47: France Maize Industry neww Revenue (Million) Forecast, by Application 2020 & 2033
- Table 48: France Maize Industry neww Volume (Kiloton) Forecast, by Application 2020 & 2033
- Table 49: Germany Maize Industry neww Revenue (Million) Forecast, by Application 2020 & 2033
- Table 50: Germany Maize Industry neww Volume (Kiloton) Forecast, by Application 2020 & 2033
- Table 51: Russia Maize Industry neww Revenue (Million) Forecast, by Application 2020 & 2033
- Table 52: Russia Maize Industry neww Volume (Kiloton) Forecast, by Application 2020 & 2033
- Table 53: Global Maize Industry neww Revenue Million Forecast, by Production Analysis 2020 & 2033
- Table 54: Global Maize Industry neww Volume Kiloton Forecast, by Production Analysis 2020 & 2033
- Table 55: Global Maize Industry neww Revenue Million Forecast, by Consumption Analysis 2020 & 2033
- Table 56: Global Maize Industry neww Volume Kiloton Forecast, by Consumption Analysis 2020 & 2033
- Table 57: Global Maize Industry neww Revenue Million Forecast, by Import Market Analysis (Value & Volume) 2020 & 2033
- Table 58: Global Maize Industry neww Volume Kiloton Forecast, by Import Market Analysis (Value & Volume) 2020 & 2033
- Table 59: Global Maize Industry neww Revenue Million Forecast, by Export Market Analysis (Value & Volume) 2020 & 2033
- Table 60: Global Maize Industry neww Volume Kiloton Forecast, by Export Market Analysis (Value & Volume) 2020 & 2033
- Table 61: Global Maize Industry neww Revenue Million Forecast, by Price Trend Analysis 2020 & 2033
- Table 62: Global Maize Industry neww Volume Kiloton Forecast, by Price Trend Analysis 2020 & 2033
- Table 63: Global Maize Industry neww Revenue Million Forecast, by Country 2020 & 2033
- Table 64: Global Maize Industry neww Volume Kiloton Forecast, by Country 2020 & 2033
- Table 65: India Maize Industry neww Revenue (Million) Forecast, by Application 2020 & 2033
- Table 66: India Maize Industry neww Volume (Kiloton) Forecast, by Application 2020 & 2033
- Table 67: China Maize Industry neww Revenue (Million) Forecast, by Application 2020 & 2033
- Table 68: China Maize Industry neww Volume (Kiloton) Forecast, by Application 2020 & 2033
- Table 69: Vietnam Maize Industry neww Revenue (Million) Forecast, by Application 2020 & 2033
- Table 70: Vietnam Maize Industry neww Volume (Kiloton) Forecast, by Application 2020 & 2033
- Table 71: Global Maize Industry neww Revenue Million Forecast, by Production Analysis 2020 & 2033
- Table 72: Global Maize Industry neww Volume Kiloton Forecast, by Production Analysis 2020 & 2033
- Table 73: Global Maize Industry neww Revenue Million Forecast, by Consumption Analysis 2020 & 2033
- Table 74: Global Maize Industry neww Volume Kiloton Forecast, by Consumption Analysis 2020 & 2033
- Table 75: Global Maize Industry neww Revenue Million Forecast, by Import Market Analysis (Value & Volume) 2020 & 2033
- Table 76: Global Maize Industry neww Volume Kiloton Forecast, by Import Market Analysis (Value & Volume) 2020 & 2033
- Table 77: Global Maize Industry neww Revenue Million Forecast, by Export Market Analysis (Value & Volume) 2020 & 2033
- Table 78: Global Maize Industry neww Volume Kiloton Forecast, by Export Market Analysis (Value & Volume) 2020 & 2033
- Table 79: Global Maize Industry neww Revenue Million Forecast, by Price Trend Analysis 2020 & 2033
- Table 80: Global Maize Industry neww Volume Kiloton Forecast, by Price Trend Analysis 2020 & 2033
- Table 81: Global Maize Industry neww Revenue Million Forecast, by Country 2020 & 2033
- Table 82: Global Maize Industry neww Volume Kiloton Forecast, by Country 2020 & 2033
- Table 83: Brazil Maize Industry neww Revenue (Million) Forecast, by Application 2020 & 2033
- Table 84: Brazil Maize Industry neww Volume (Kiloton) Forecast, by Application 2020 & 2033
- Table 85: Argentina Maize Industry neww Revenue (Million) Forecast, by Application 2020 & 2033
- Table 86: Argentina Maize Industry neww Volume (Kiloton) Forecast, by Application 2020 & 2033
- Table 87: Global Maize Industry neww Revenue Million Forecast, by Production Analysis 2020 & 2033
- Table 88: Global Maize Industry neww Volume Kiloton Forecast, by Production Analysis 2020 & 2033
- Table 89: Global Maize Industry neww Revenue Million Forecast, by Consumption Analysis 2020 & 2033
- Table 90: Global Maize Industry neww Volume Kiloton Forecast, by Consumption Analysis 2020 & 2033
- Table 91: Global Maize Industry neww Revenue Million Forecast, by Import Market Analysis (Value & Volume) 2020 & 2033
- Table 92: Global Maize Industry neww Volume Kiloton Forecast, by Import Market Analysis (Value & Volume) 2020 & 2033
- Table 93: Global Maize Industry neww Revenue Million Forecast, by Export Market Analysis (Value & Volume) 2020 & 2033
- Table 94: Global Maize Industry neww Volume Kiloton Forecast, by Export Market Analysis (Value & Volume) 2020 & 2033
- Table 95: Global Maize Industry neww Revenue Million Forecast, by Price Trend Analysis 2020 & 2033
- Table 96: Global Maize Industry neww Volume Kiloton Forecast, by Price Trend Analysis 2020 & 2033
- Table 97: Global Maize Industry neww Revenue Million Forecast, by Country 2020 & 2033
- Table 98: Global Maize Industry neww Volume Kiloton Forecast, by Country 2020 & 2033
- Table 99: South Africa Maize Industry neww Revenue (Million) Forecast, by Application 2020 & 2033
- Table 100: South Africa Maize Industry neww Volume (Kiloton) Forecast, by Application 2020 & 2033
- Table 101: Nigeria Maize Industry neww Revenue (Million) Forecast, by Application 2020 & 2033
- Table 102: Nigeria Maize Industry neww Volume (Kiloton) Forecast, by Application 2020 & 2033
Frequently Asked Questions
1. What is the projected Compound Annual Growth Rate (CAGR) of the Maize Industry neww?
The projected CAGR is approximately 3.01%.
2. Which companies are prominent players in the Maize Industry neww?
Key companies in the market include ADM, Syngenta Crop Protection , Société Générale de Surveillance (SGS) , Bayer Crop Science , Bunge , Bunge Limited , Cargill, Incorporated , Corteva Agriscience , ADM , Olam Group .
3. What are the main segments of the Maize Industry neww?
The market segments include Production Analysis, Consumption Analysis, Import Market Analysis (Value & Volume), Export Market Analysis (Value & Volume), Price Trend Analysis.
4. Can you provide details about the market size?
The market size is estimated to be USD 143.62 Million as of 2022.
5. What are some drivers contributing to market growth?
N/A
6. What are the notable trends driving market growth?
Increase in Demand for Animal-based Protein Sources.
7. Are there any restraints impacting market growth?
N/A
8. Can you provide examples of recent developments in the market?
October 2022: Ghana's President, Nana Addo Dankwa Akufo-Addo, inaugurated an ultramodern maize processing factory at Nsuta-Kwagye in the Sekyere-Central District of the Ashanti Region, as part of the "One District, One Factory" initiative. The facility is equipped with cutting-edge processing equipment, such as a maize drying plant, a grit milling machine, and many more.
9. What pricing options are available for accessing the report?
Pricing options include single-user, multi-user, and enterprise licenses priced at USD 4750, USD 5250, and USD 8750 respectively.
10. Is the market size provided in terms of value or volume?
The market size is provided in terms of value, measured in Million and volume, measured in Kiloton.
11. Are there any specific market keywords associated with the report?
Yes, the market keyword associated with the report is "Maize Industry neww," which aids in identifying and referencing the specific market segment covered.
12. How do I determine which pricing option suits my needs best?
The pricing options vary based on user requirements and access needs. Individual users may opt for single-user licenses, while businesses requiring broader access may choose multi-user or enterprise licenses for cost-effective access to the report.
13. Are there any additional resources or data provided in the Maize Industry neww report?
While the report offers comprehensive insights, it's advisable to review the specific contents or supplementary materials provided to ascertain if additional resources or data are available.
14. How can I stay updated on further developments or reports in the Maize Industry neww?
To stay informed about further developments, trends, and reports in the Maize Industry neww, consider subscribing to industry newsletters, following relevant companies and organizations, or regularly checking reputable industry news sources and publications.
Methodology
Step 1 - Identification of Relevant Samples Size from Population Database


Step 2 - Approaches for Defining Global Market Size (Value, Volume* & Price*)

Note*: In applicable scenarios
Step 3 - Data Sources
Primary Research
- Web Analytics
- Survey Reports
- Research Institute
- Latest Research Reports
- Opinion Leaders
Secondary Research
- Annual Reports
- White Paper
- Latest Press Release
- Industry Association
- Paid Database
- Investor Presentations

Step 4 - Data Triangulation
Involves using different sources of information in order to increase the validity of a study
These sources are likely to be stakeholders in a program - participants, other researchers, program staff, other community members, and so on.
Then we put all data in single framework & apply various statistical tools to find out the dynamic on the market.
During the analysis stage, feedback from the stakeholder groups would be compared to determine areas of agreement as well as areas of divergence