

Key Insights
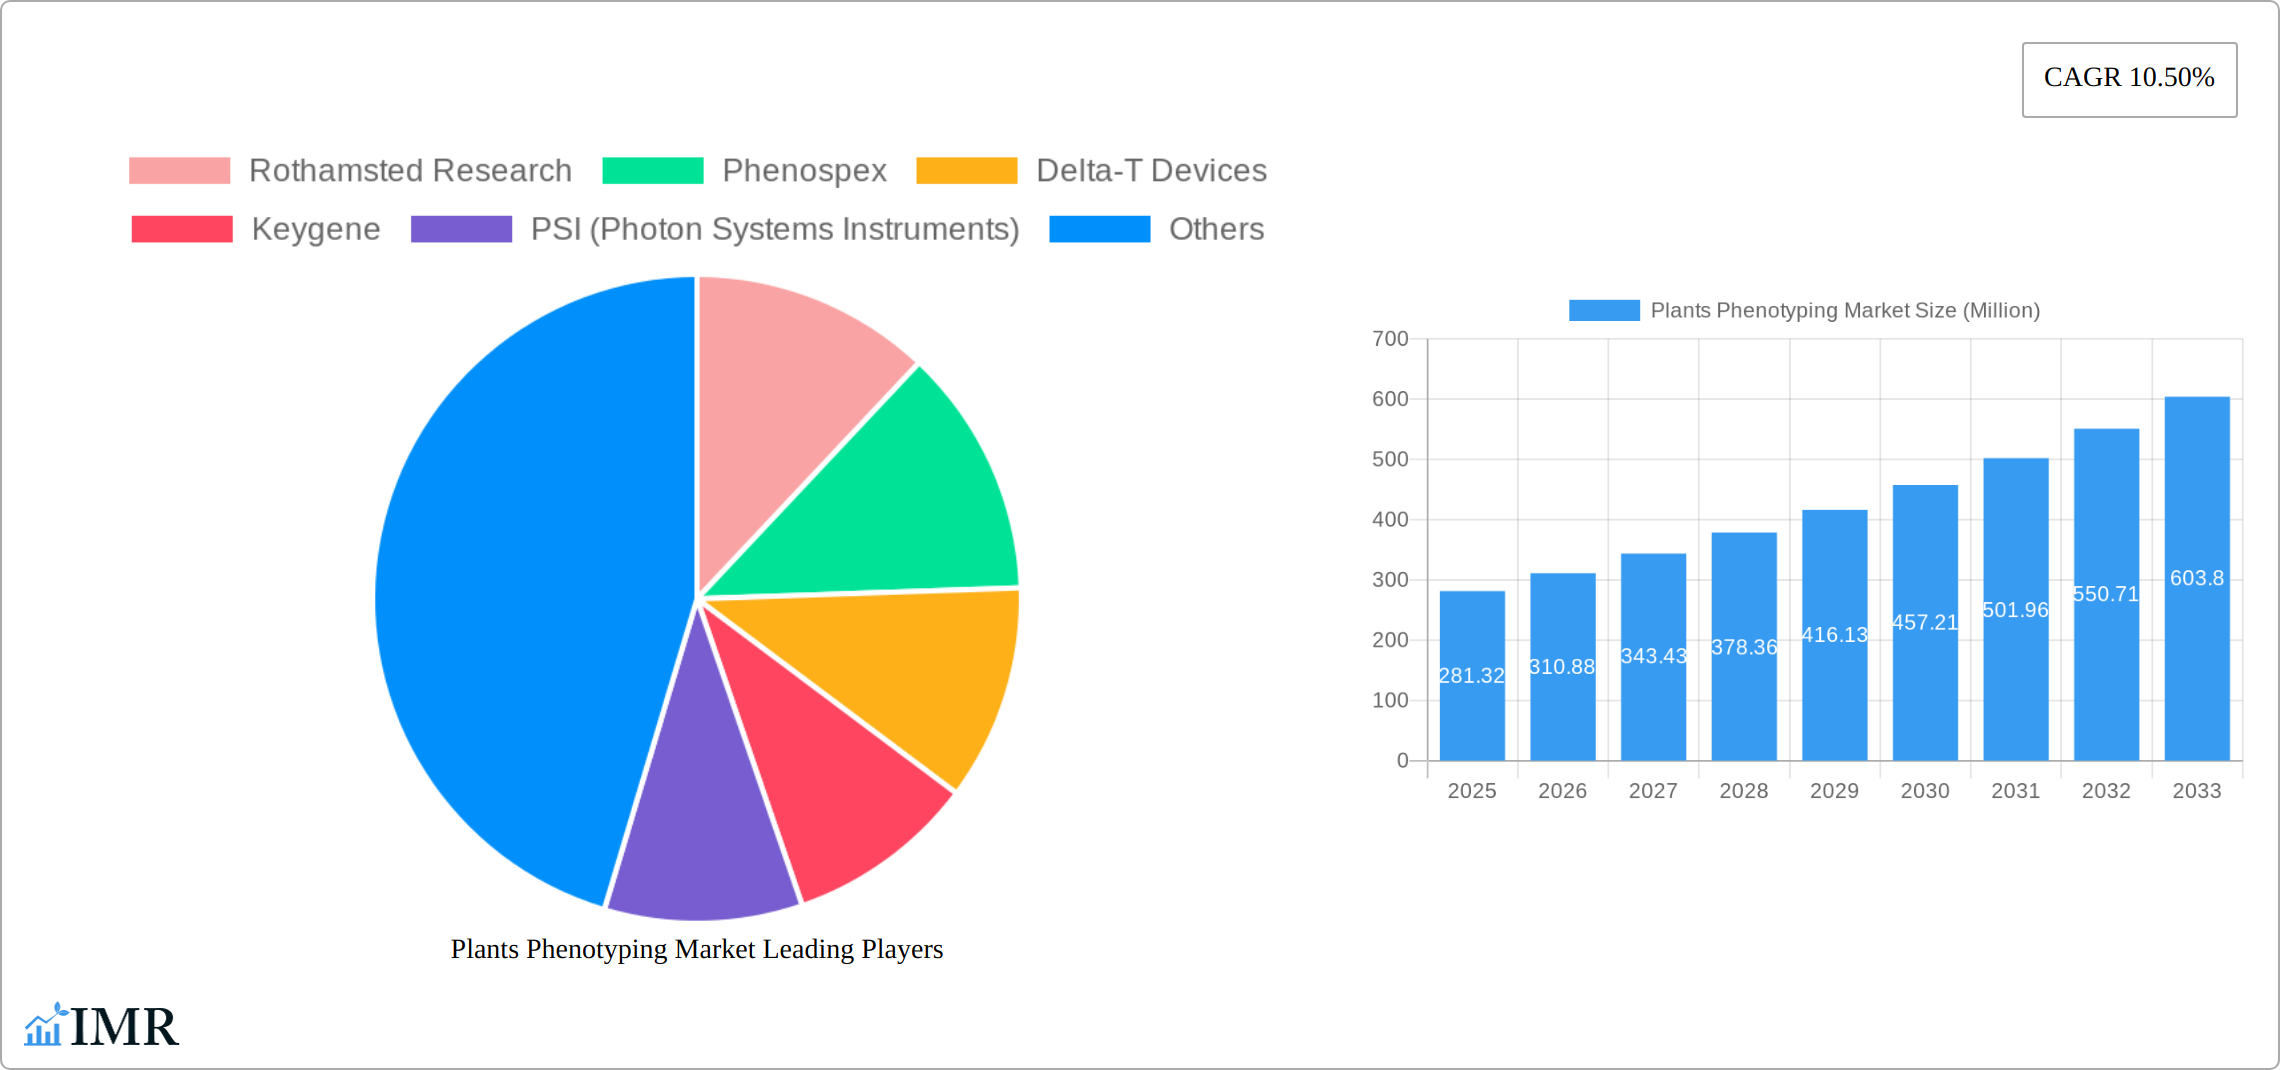
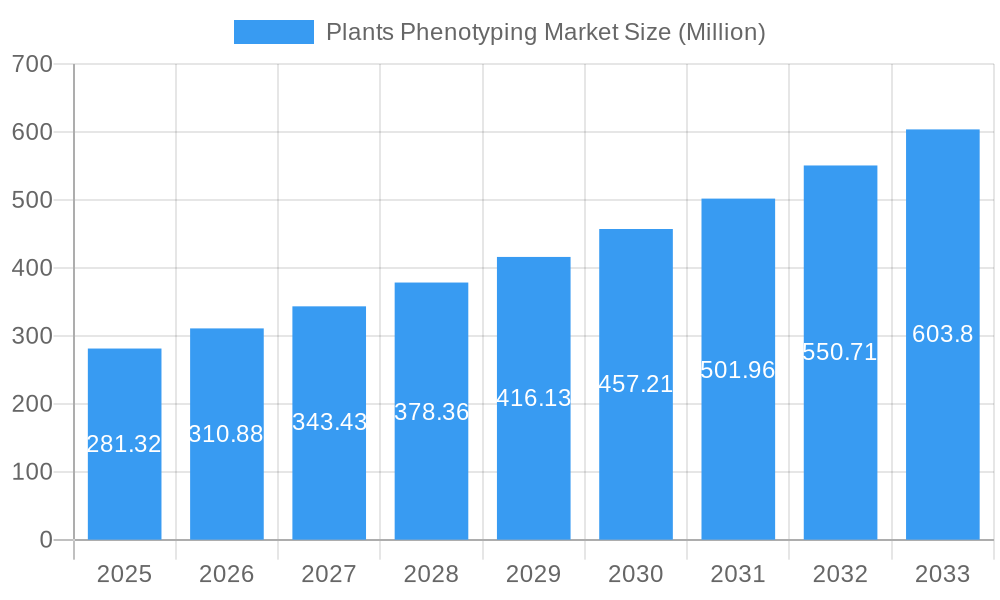
The Plants Phenotyping market, valued at $281.32 million in 2025, is projected to experience robust growth, driven by a Compound Annual Growth Rate (CAGR) of 10.50% from 2025 to 2033. This expansion is fueled by several key factors. Increased demand for high-throughput screening in agricultural research and development is a significant driver, enabling faster and more efficient crop improvement. Advances in imaging technologies, such as multispectral cameras and image analysis systems, are enhancing the accuracy and detail of phenotypic data, leading to better breeding strategies and improved crop yields. Furthermore, the growing adoption of automation in plant phenotyping, particularly fully automated systems, is streamlining workflows and reducing labor costs, thereby increasing market appeal. The market segmentation reveals significant opportunities across various application areas, including trait identification, photosynthetic performance analysis, and morphology assessment. Different platforms, from conveyor-based systems to handheld devices and drones, cater to diverse research needs and budgets. Geographic expansion is also contributing to market growth, with North America and Europe currently holding the largest market shares, followed by the rapidly developing Asia-Pacific region.
Plants Phenotyping Market Market Size (In Million)
However, challenges remain. High initial investment costs associated with advanced phenotyping equipment can be a barrier to entry for smaller research institutions and agricultural businesses. The complexity of data analysis and the need for specialized software and expertise also present hurdles to widespread adoption. Overcoming these challenges through the development of more affordable and user-friendly technologies, coupled with accessible training and support, will be crucial for future market growth. The increasing availability of cloud-based data analysis platforms and the integration of artificial intelligence (AI) and machine learning (ML) are likely to address some of these issues and further drive market expansion in the coming years. The diverse range of applications, coupled with continuous technological innovation, positions the Plants Phenotyping market for sustained and significant growth throughout the forecast period.
Plants Phenotyping Market Company Market Share
Plants Phenotyping Market: A Comprehensive Market Report (2019-2033)
This comprehensive report provides a detailed analysis of the Plants Phenotyping Market, encompassing its dynamics, growth trends, key players, and future outlook. The study period covers 2019-2033, with 2025 as the base and estimated year, and a forecast period of 2025-2033. The report segments the market by product (Equipment, Other Softwares: Sensors, Services: Measurement Acquisition & Data Analysis, Statistical Analysis), automation type (Manual, Semi-Automated, Fully Automated), application (High-Throughput Screening, Trait Identification, Photosynthetic Performance, Morphology and Growth Assessment, Other Applications), analysis system (Image Analysis Systems, Multispectral Scientific Cameras, Canopy Analysis Systems, Fluorometers, Others), site (Laboratory, Greenhouse, Field), and platform (Conveyor-Based/Modular Systems, Bench-Based Systems, Handheld/Portable Systems, Drones, Softwares). The parent market is the agricultural technology sector, while the child markets include precision agriculture and plant breeding.
Plants Phenotyping Market Dynamics & Structure
The Plants Phenotyping Market is characterized by a moderately concentrated landscape with several established players and emerging innovative companies. Market growth is driven by technological advancements in sensor technology, image analysis, and data analytics, enabling higher throughput and more sophisticated phenotyping capabilities. Regulatory frameworks, particularly those related to data privacy and agricultural practices, influence market adoption. The emergence of alternative methods for plant analysis presents competitive substitution, while the increasing demand for high-yielding and climate-resilient crops fuels market expansion. Mergers and acquisitions (M&A) activity within the sector remains moderate, with a focus on consolidating expertise and expanding market reach. Between 2019 and 2024, approximately xx M&A deals were recorded, resulting in a xx% market share consolidation among the top 5 players. Innovation barriers include the high cost of developing and deploying advanced phenotyping systems, the need for specialized expertise in data analysis, and the complexity of integrating different technologies.
- Market Concentration: Moderately concentrated, with top 5 players holding xx% market share in 2024.
- Technological Innovation: Driving force, focusing on AI, machine learning, and high-throughput systems.
- Regulatory Frameworks: Impacting data privacy, environmental compliance, and product approvals.
- Competitive Substitutes: Traditional plant breeding methods and less sophisticated analytical techniques.
- End-User Demographics: Primarily research institutions, agricultural companies, and breeding programs.
- M&A Trends: Moderate activity driven by expansion strategies and technology acquisition.
Plants Phenotyping Market Growth Trends & Insights
The Plants Phenotyping Market has experienced significant growth over the past five years, driven by increasing demand for enhanced crop productivity and efficiency. The market size expanded from xx Million in 2019 to xx Million in 2024, reflecting a CAGR of xx%. This growth is attributed to several factors including increasing adoption of precision agriculture techniques, the rising prevalence of high-throughput screening, and the growing need for accurate and timely phenotypic data. Technological advancements, particularly in sensor technology and data analytics, have facilitated the development of more sophisticated phenotyping systems, leading to higher adoption rates and improved market penetration. Consumer behavior shifts toward sustainable and efficient agriculture practices further bolster market expansion. Technological disruptions, such as the integration of AI and machine learning into phenotyping platforms, are expected to accelerate growth in the forecast period. We project the market to reach xx Million by 2033, representing a CAGR of xx% during the forecast period.
Dominant Regions, Countries, or Segments in Plants Phenotyping Market
North America currently holds a leading position in the Plants Phenotyping Market, driven by substantial investments in agricultural research and development, a strong presence of key players, and the early adoption of cutting-edge technologies. Europe follows closely, boasting a robust research infrastructure and significant government support for agricultural innovation. The Asia-Pacific region demonstrates the most rapid growth, fueled by a surge in agricultural output and government initiatives promoting technological advancements. This growth is particularly noticeable in emerging economies experiencing rapid agricultural expansion and modernization.
Analyzing market segments reveals that the Equipment segment commands the largest market share due to the high demand for sophisticated phenotyping systems capable of handling large datasets and providing detailed analysis. Concurrently, the Services segment, particularly Measurement Acquisition & Data Analysis, is experiencing rapid expansion, reflecting the increasing need for specialized expertise in data management, interpretation, and the extraction of actionable insights. The demand for Fully Automated systems is also growing rapidly, driven by their increased efficiency and high throughput capabilities, enabling researchers to process significantly larger sample sizes within shorter timeframes. High-Throughput Screening remains the dominant application, closely followed by Trait Identification and other advanced applications such as disease resistance screening and stress response analysis. Image Analysis Systems continue to dominate the analysis sector due to their versatility and capacity for extracting detailed phenotypic information. The Laboratory setting currently represents the largest share of the market; however, the Field segment is poised for significant growth propelled by the development and adoption of portable and drone-based phenotyping platforms, which are increasingly enabling researchers to collect data in diverse and remote environments.
- Key Drivers (North America): Strong R&D investments, robust technology adoption, and a well-established market presence of both established companies and innovative startups.
- Key Drivers (Europe): Government funding and support for agricultural research, a strong research infrastructure, and the presence of major agricultural companies actively involved in the development and deployment of new phenotyping technologies.
- Key Drivers (Asia-Pacific): Rapid economic growth, increasing agricultural production to meet growing food demands, and targeted government initiatives promoting technological advancements in agriculture.
- Segment Dominance: Equipment (largest market share), Services (rapid growth), Fully Automated systems (fastest-growing automation type), High-Throughput Screening (dominant application).
Plants Phenotyping Market Product Landscape
The Plants Phenotyping Market showcases a diverse range of products, from basic handheld sensors to advanced, fully automated systems incorporating AI-powered image analysis. Recent innovations include miniaturized sensors, improved spectral resolution cameras, and advanced data analytics software. These advancements enhance measurement accuracy, data processing speed, and overall efficiency. The unique selling propositions of various products focus on aspects such as high throughput, ease of use, specific applications (e.g., photosynthesis, morphology), and seamless data integration. The overall trend is towards greater integration, automation, and sophistication in both hardware and software components.
Key Drivers, Barriers & Challenges in Plants Phenotyping Market
Key Drivers: The increasing global demand for high-yielding and resilient crops, the imperative for efficient resource utilization in agriculture, continuous advancements in sensor and imaging technologies, and the growing adoption of precision agriculture practices are all major drivers of market growth. Supportive government initiatives and policies promoting agricultural technology adoption also play a crucial role.
Challenges: High initial investment costs associated with advanced phenotyping systems, a shortage of skilled personnel proficient in data analysis and interpretation, and the complexity of integrating diverse data sources from various sensors and platforms represent significant barriers. Furthermore, regulatory hurdles related to data privacy, intellectual property rights, and the need for standardized data formats and interoperability between different systems pose challenges to broader market expansion and collaboration.
Emerging Opportunities in Plants Phenotyping Market
The increasing adoption of remote sensing technologies, such as drones and satellites, presents a significant opportunity for market expansion. The integration of AI and machine learning for automated data analysis and decision support is another major area of growth. Furthermore, there is substantial untapped potential in developing phenotyping solutions for specific crops and applications, especially in emerging economies. The increasing demand for sustainable agriculture further expands the market potential.
Growth Accelerators in the Plants Phenotyping Market Industry
Technological advancements continue to drive market expansion, particularly in areas such as hyperspectral imaging, 3D imaging, and AI-driven analysis. Strategic partnerships between technology providers, agricultural companies, and research institutions are fostering innovation and accelerating market growth. Expansion into new geographical markets, particularly in developing countries, presents a significant opportunity.
Key Players Shaping the Plants Phenotyping Market Market
- Rothamsted Research
- Phenospex
- Delta-T Devices
- Keygene
- PSI (Photon Systems Instruments)
- BASF SE (Crop Design)
- Heinz Walz GmbH
- The Vienna Biocenter Core Facilities
- LemnaTec GmbH
- Phenomix
- WP
- Qubit Systems
- [Add other relevant key players here]
Notable Milestones in Plants Phenotyping Market Sector
- 2020: LemnaTec launched a new high-throughput phenotyping platform, significantly increasing throughput and efficiency.
- 2021: PSI introduced advanced multispectral imaging capabilities, expanding the range of phenotypic traits that could be measured and analyzed.
- 2022: A major merger between two key players [Specify the companies if known] resulted in an expanded market share and a broader portfolio of products and services.
- 2023: The release of several new software solutions incorporating AI-driven data analysis capabilities improved data processing speeds and analytical accuracy.
- 2024: Significant investment in drone-based phenotyping technology accelerated the adoption of remote sensing for large-scale field phenotyping.
- [Add other relevant milestones here, including specific product launches, partnerships, or significant research breakthroughs]
In-Depth Plants Phenotyping Market Market Outlook
The Plants Phenotyping Market is poised for sustained growth, driven by technological innovation, increasing demand for enhanced agricultural efficiency, and expanding adoption of precision agriculture techniques. The continued integration of AI and machine learning, alongside the development of more affordable and accessible phenotyping systems, will further fuel market expansion. Strategic partnerships and collaborations within the industry will be instrumental in unlocking new opportunities and accelerating market growth over the forecast period. The market is expected to witness a significant rise in the adoption of advanced phenotyping solutions in the coming years, leading to a substantial increase in market size and revenue.
Plants Phenotyping Market Segmentation
- 1. Production Analysis
- 2. Consumption Analysis
- 3. Import Market Analysis (Value & Volume)
- 4. Export Market Analysis (Value & Volume)
- 5. Price Trend Analysis
Plants Phenotyping Market Segmentation By Geography
-
1. North America
- 1.1. United States
- 1.2. Canada
- 1.3. Mexico
-
2. South America
- 2.1. Brazil
- 2.2. Argentina
- 2.3. Rest of South America
-
3. Europe
- 3.1. United Kingdom
- 3.2. Germany
- 3.3. France
- 3.4. Italy
- 3.5. Spain
- 3.6. Russia
- 3.7. Benelux
- 3.8. Nordics
- 3.9. Rest of Europe
-
4. Middle East & Africa
- 4.1. Turkey
- 4.2. Israel
- 4.3. GCC
- 4.4. North Africa
- 4.5. South Africa
- 4.6. Rest of Middle East & Africa
-
5. Asia Pacific
- 5.1. China
- 5.2. India
- 5.3. Japan
- 5.4. South Korea
- 5.5. ASEAN
- 5.6. Oceania
- 5.7. Rest of Asia Pacific
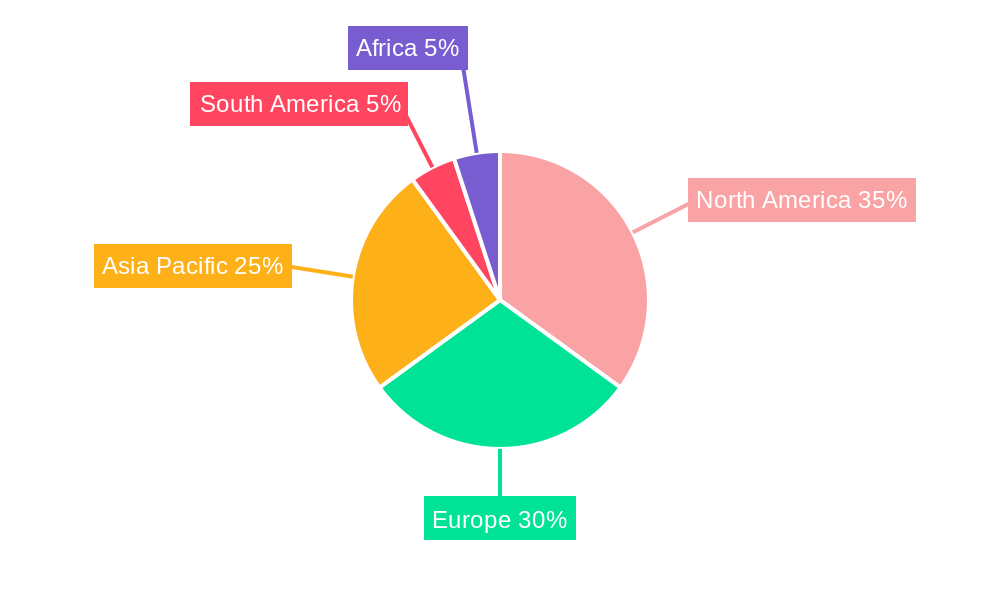
Plants Phenotyping Market Regional Market Share
Geographic Coverage of Plants Phenotyping Market
Plants Phenotyping Market REPORT HIGHLIGHTS
| Aspects | Details |
|---|---|
| Study Period | 2020-2034 |
| Base Year | 2025 |
| Estimated Year | 2026 |
| Forecast Period | 2026-2034 |
| Historical Period | 2020-2025 |
| Growth Rate | CAGR of 10.50% from 2020-2034 |
| Segmentation |
|
Table of Contents
- 1. Introduction
- 1.1. Research Scope
- 1.2. Market Segmentation
- 1.3. Research Objective
- 1.4. Definitions and Assumptions
- 2. Executive Summary
- 2.1. Market Snapshot
- 3. Market Dynamics
- 3.1. Market Drivers
- 3.2. Market Restrains
- 3.3. Market Trends
- 3.4. Market Opportunities
- 4. Market Factor Analysis
- 4.1. Porters Five Forces
- 4.1.1. Bargaining Power of Suppliers
- 4.1.2. Bargaining Power of Buyers
- 4.1.3. Threat of New Entrants
- 4.1.4. Threat of Substitutes
- 4.1.5. Competitive Rivalry
- 4.2. PESTEL analysis
- 4.3. BCG Analysis
- 4.3.1. Stars (High Growth, High Market Share)
- 4.3.2. Cash Cows (Low Growth, High Market Share)
- 4.3.3. Question Mark (High Growth, Low Market Share)
- 4.3.4. Dogs (Low Growth, Low Market Share)
- 4.4. Ansoff Matrix Analysis
- 4.5. Supply Chain Analysis
- 4.6. Regulatory Landscape
- 4.7. Current Market Potential and Opportunity Assessment (TAM–SAM–SOM Framework)
- 4.8. IMR Analyst Note
- 4.1. Porters Five Forces
- 5. Market Analysis, Insights and Forecast 2021-2033
- 5.1. Market Analysis, Insights and Forecast - by Production Analysis
- 5.2. Market Analysis, Insights and Forecast - by Consumption Analysis
- 5.3. Market Analysis, Insights and Forecast - by Import Market Analysis (Value & Volume)
- 5.4. Market Analysis, Insights and Forecast - by Export Market Analysis (Value & Volume)
- 5.5. Market Analysis, Insights and Forecast - by Price Trend Analysis
- 5.6. Market Analysis, Insights and Forecast - by Region
- 5.6.1. North America
- 5.6.2. South America
- 5.6.3. Europe
- 5.6.4. Middle East & Africa
- 5.6.5. Asia Pacific
- 6. Global Plants Phenotyping Market Analysis, Insights and Forecast, 2021-2033
- 6.1. Market Analysis, Insights and Forecast - by Production Analysis
- 6.2. Market Analysis, Insights and Forecast - by Consumption Analysis
- 6.3. Market Analysis, Insights and Forecast - by Import Market Analysis (Value & Volume)
- 6.4. Market Analysis, Insights and Forecast - by Export Market Analysis (Value & Volume)
- 6.5. Market Analysis, Insights and Forecast - by Price Trend Analysis
- 7. North America Plants Phenotyping Market Analysis, Insights and Forecast, 2020-2032
- 7.1. Market Analysis, Insights and Forecast - by Production Analysis
- 7.2. Market Analysis, Insights and Forecast - by Consumption Analysis
- 7.3. Market Analysis, Insights and Forecast - by Import Market Analysis (Value & Volume)
- 7.4. Market Analysis, Insights and Forecast - by Export Market Analysis (Value & Volume)
- 7.5. Market Analysis, Insights and Forecast - by Price Trend Analysis
- 8. South America Plants Phenotyping Market Analysis, Insights and Forecast, 2020-2032
- 8.1. Market Analysis, Insights and Forecast - by Production Analysis
- 8.2. Market Analysis, Insights and Forecast - by Consumption Analysis
- 8.3. Market Analysis, Insights and Forecast - by Import Market Analysis (Value & Volume)
- 8.4. Market Analysis, Insights and Forecast - by Export Market Analysis (Value & Volume)
- 8.5. Market Analysis, Insights and Forecast - by Price Trend Analysis
- 9. Europe Plants Phenotyping Market Analysis, Insights and Forecast, 2020-2032
- 9.1. Market Analysis, Insights and Forecast - by Production Analysis
- 9.2. Market Analysis, Insights and Forecast - by Consumption Analysis
- 9.3. Market Analysis, Insights and Forecast - by Import Market Analysis (Value & Volume)
- 9.4. Market Analysis, Insights and Forecast - by Export Market Analysis (Value & Volume)
- 9.5. Market Analysis, Insights and Forecast - by Price Trend Analysis
- 10. Middle East & Africa Plants Phenotyping Market Analysis, Insights and Forecast, 2020-2032
- 10.1. Market Analysis, Insights and Forecast - by Production Analysis
- 10.2. Market Analysis, Insights and Forecast - by Consumption Analysis
- 10.3. Market Analysis, Insights and Forecast - by Import Market Analysis (Value & Volume)
- 10.4. Market Analysis, Insights and Forecast - by Export Market Analysis (Value & Volume)
- 10.5. Market Analysis, Insights and Forecast - by Price Trend Analysis
- 11. Asia Pacific Plants Phenotyping Market Analysis, Insights and Forecast, 2020-2032
- 11.1. Market Analysis, Insights and Forecast - by Production Analysis
- 11.2. Market Analysis, Insights and Forecast - by Consumption Analysis
- 11.3. Market Analysis, Insights and Forecast - by Import Market Analysis (Value & Volume)
- 11.4. Market Analysis, Insights and Forecast - by Export Market Analysis (Value & Volume)
- 11.5. Market Analysis, Insights and Forecast - by Price Trend Analysis
- 12. Competitive Analysis
- 12.1. Company Profiles
- 12.1.1 Rothamsted Research
- 12.1.1.1. Company Overview
- 12.1.1.2. Products
- 12.1.1.3. Company Financials
- 12.1.1.4. SWOT Analysis
- 12.1.2 Phenospex
- 12.1.2.1. Company Overview
- 12.1.2.2. Products
- 12.1.2.3. Company Financials
- 12.1.2.4. SWOT Analysis
- 12.1.3 Delta-T Devices
- 12.1.3.1. Company Overview
- 12.1.3.2. Products
- 12.1.3.3. Company Financials
- 12.1.3.4. SWOT Analysis
- 12.1.4 Keygene
- 12.1.4.1. Company Overview
- 12.1.4.2. Products
- 12.1.4.3. Company Financials
- 12.1.4.4. SWOT Analysis
- 12.1.5 PSI (Photon Systems Instruments)
- 12.1.5.1. Company Overview
- 12.1.5.2. Products
- 12.1.5.3. Company Financials
- 12.1.5.4. SWOT Analysis
- 12.1.6 BASF SE (Crop Design)
- 12.1.6.1. Company Overview
- 12.1.6.2. Products
- 12.1.6.3. Company Financials
- 12.1.6.4. SWOT Analysis
- 12.1.7 Heinz Walz GmbH
- 12.1.7.1. Company Overview
- 12.1.7.2. Products
- 12.1.7.3. Company Financials
- 12.1.7.4. SWOT Analysis
- 12.1.8 The Vienna Biocenter Core Facilities
- 12.1.8.1. Company Overview
- 12.1.8.2. Products
- 12.1.8.3. Company Financials
- 12.1.8.4. SWOT Analysis
- 12.1.9 LemnaTec GmbH
- 12.1.9.1. Company Overview
- 12.1.9.2. Products
- 12.1.9.3. Company Financials
- 12.1.9.4. SWOT Analysis
- 12.1.10 Phenomix
- 12.1.10.1. Company Overview
- 12.1.10.2. Products
- 12.1.10.3. Company Financials
- 12.1.10.4. SWOT Analysis
- 12.1.11 WP
- 12.1.11.1. Company Overview
- 12.1.11.2. Products
- 12.1.11.3. Company Financials
- 12.1.11.4. SWOT Analysis
- 12.1.12 Qubit Systems
- 12.1.12.1. Company Overview
- 12.1.12.2. Products
- 12.1.12.3. Company Financials
- 12.1.12.4. SWOT Analysis
- 12.1.1 Rothamsted Research
- 12.2. Market Entropy
- 12.2.1 Company's Key Areas Served
- 12.2.2 Recent Developments
- 12.3. Company Market Share Analysis 2025
- 12.3.1 Top 5 Companies Market Share Analysis
- 12.3.2 Top 3 Companies Market Share Analysis
- 12.4. List of Potential Customers
- 13. Research Methodology
List of Figures
- Figure 1: Global Plants Phenotyping Market Revenue Breakdown (Million, %) by Region 2025 & 2033
- Figure 2: North America Plants Phenotyping Market Revenue (Million), by Production Analysis 2025 & 2033
- Figure 3: North America Plants Phenotyping Market Revenue Share (%), by Production Analysis 2025 & 2033
- Figure 4: North America Plants Phenotyping Market Revenue (Million), by Consumption Analysis 2025 & 2033
- Figure 5: North America Plants Phenotyping Market Revenue Share (%), by Consumption Analysis 2025 & 2033
- Figure 6: North America Plants Phenotyping Market Revenue (Million), by Import Market Analysis (Value & Volume) 2025 & 2033
- Figure 7: North America Plants Phenotyping Market Revenue Share (%), by Import Market Analysis (Value & Volume) 2025 & 2033
- Figure 8: North America Plants Phenotyping Market Revenue (Million), by Export Market Analysis (Value & Volume) 2025 & 2033
- Figure 9: North America Plants Phenotyping Market Revenue Share (%), by Export Market Analysis (Value & Volume) 2025 & 2033
- Figure 10: North America Plants Phenotyping Market Revenue (Million), by Price Trend Analysis 2025 & 2033
- Figure 11: North America Plants Phenotyping Market Revenue Share (%), by Price Trend Analysis 2025 & 2033
- Figure 12: North America Plants Phenotyping Market Revenue (Million), by Country 2025 & 2033
- Figure 13: North America Plants Phenotyping Market Revenue Share (%), by Country 2025 & 2033
- Figure 14: South America Plants Phenotyping Market Revenue (Million), by Production Analysis 2025 & 2033
- Figure 15: South America Plants Phenotyping Market Revenue Share (%), by Production Analysis 2025 & 2033
- Figure 16: South America Plants Phenotyping Market Revenue (Million), by Consumption Analysis 2025 & 2033
- Figure 17: South America Plants Phenotyping Market Revenue Share (%), by Consumption Analysis 2025 & 2033
- Figure 18: South America Plants Phenotyping Market Revenue (Million), by Import Market Analysis (Value & Volume) 2025 & 2033
- Figure 19: South America Plants Phenotyping Market Revenue Share (%), by Import Market Analysis (Value & Volume) 2025 & 2033
- Figure 20: South America Plants Phenotyping Market Revenue (Million), by Export Market Analysis (Value & Volume) 2025 & 2033
- Figure 21: South America Plants Phenotyping Market Revenue Share (%), by Export Market Analysis (Value & Volume) 2025 & 2033
- Figure 22: South America Plants Phenotyping Market Revenue (Million), by Price Trend Analysis 2025 & 2033
- Figure 23: South America Plants Phenotyping Market Revenue Share (%), by Price Trend Analysis 2025 & 2033
- Figure 24: South America Plants Phenotyping Market Revenue (Million), by Country 2025 & 2033
- Figure 25: South America Plants Phenotyping Market Revenue Share (%), by Country 2025 & 2033
- Figure 26: Europe Plants Phenotyping Market Revenue (Million), by Production Analysis 2025 & 2033
- Figure 27: Europe Plants Phenotyping Market Revenue Share (%), by Production Analysis 2025 & 2033
- Figure 28: Europe Plants Phenotyping Market Revenue (Million), by Consumption Analysis 2025 & 2033
- Figure 29: Europe Plants Phenotyping Market Revenue Share (%), by Consumption Analysis 2025 & 2033
- Figure 30: Europe Plants Phenotyping Market Revenue (Million), by Import Market Analysis (Value & Volume) 2025 & 2033
- Figure 31: Europe Plants Phenotyping Market Revenue Share (%), by Import Market Analysis (Value & Volume) 2025 & 2033
- Figure 32: Europe Plants Phenotyping Market Revenue (Million), by Export Market Analysis (Value & Volume) 2025 & 2033
- Figure 33: Europe Plants Phenotyping Market Revenue Share (%), by Export Market Analysis (Value & Volume) 2025 & 2033
- Figure 34: Europe Plants Phenotyping Market Revenue (Million), by Price Trend Analysis 2025 & 2033
- Figure 35: Europe Plants Phenotyping Market Revenue Share (%), by Price Trend Analysis 2025 & 2033
- Figure 36: Europe Plants Phenotyping Market Revenue (Million), by Country 2025 & 2033
- Figure 37: Europe Plants Phenotyping Market Revenue Share (%), by Country 2025 & 2033
- Figure 38: Middle East & Africa Plants Phenotyping Market Revenue (Million), by Production Analysis 2025 & 2033
- Figure 39: Middle East & Africa Plants Phenotyping Market Revenue Share (%), by Production Analysis 2025 & 2033
- Figure 40: Middle East & Africa Plants Phenotyping Market Revenue (Million), by Consumption Analysis 2025 & 2033
- Figure 41: Middle East & Africa Plants Phenotyping Market Revenue Share (%), by Consumption Analysis 2025 & 2033
- Figure 42: Middle East & Africa Plants Phenotyping Market Revenue (Million), by Import Market Analysis (Value & Volume) 2025 & 2033
- Figure 43: Middle East & Africa Plants Phenotyping Market Revenue Share (%), by Import Market Analysis (Value & Volume) 2025 & 2033
- Figure 44: Middle East & Africa Plants Phenotyping Market Revenue (Million), by Export Market Analysis (Value & Volume) 2025 & 2033
- Figure 45: Middle East & Africa Plants Phenotyping Market Revenue Share (%), by Export Market Analysis (Value & Volume) 2025 & 2033
- Figure 46: Middle East & Africa Plants Phenotyping Market Revenue (Million), by Price Trend Analysis 2025 & 2033
- Figure 47: Middle East & Africa Plants Phenotyping Market Revenue Share (%), by Price Trend Analysis 2025 & 2033
- Figure 48: Middle East & Africa Plants Phenotyping Market Revenue (Million), by Country 2025 & 2033
- Figure 49: Middle East & Africa Plants Phenotyping Market Revenue Share (%), by Country 2025 & 2033
- Figure 50: Asia Pacific Plants Phenotyping Market Revenue (Million), by Production Analysis 2025 & 2033
- Figure 51: Asia Pacific Plants Phenotyping Market Revenue Share (%), by Production Analysis 2025 & 2033
- Figure 52: Asia Pacific Plants Phenotyping Market Revenue (Million), by Consumption Analysis 2025 & 2033
- Figure 53: Asia Pacific Plants Phenotyping Market Revenue Share (%), by Consumption Analysis 2025 & 2033
- Figure 54: Asia Pacific Plants Phenotyping Market Revenue (Million), by Import Market Analysis (Value & Volume) 2025 & 2033
- Figure 55: Asia Pacific Plants Phenotyping Market Revenue Share (%), by Import Market Analysis (Value & Volume) 2025 & 2033
- Figure 56: Asia Pacific Plants Phenotyping Market Revenue (Million), by Export Market Analysis (Value & Volume) 2025 & 2033
- Figure 57: Asia Pacific Plants Phenotyping Market Revenue Share (%), by Export Market Analysis (Value & Volume) 2025 & 2033
- Figure 58: Asia Pacific Plants Phenotyping Market Revenue (Million), by Price Trend Analysis 2025 & 2033
- Figure 59: Asia Pacific Plants Phenotyping Market Revenue Share (%), by Price Trend Analysis 2025 & 2033
- Figure 60: Asia Pacific Plants Phenotyping Market Revenue (Million), by Country 2025 & 2033
- Figure 61: Asia Pacific Plants Phenotyping Market Revenue Share (%), by Country 2025 & 2033
List of Tables
- Table 1: Global Plants Phenotyping Market Revenue Million Forecast, by Production Analysis 2020 & 2033
- Table 2: Global Plants Phenotyping Market Revenue Million Forecast, by Consumption Analysis 2020 & 2033
- Table 3: Global Plants Phenotyping Market Revenue Million Forecast, by Import Market Analysis (Value & Volume) 2020 & 2033
- Table 4: Global Plants Phenotyping Market Revenue Million Forecast, by Export Market Analysis (Value & Volume) 2020 & 2033
- Table 5: Global Plants Phenotyping Market Revenue Million Forecast, by Price Trend Analysis 2020 & 2033
- Table 6: Global Plants Phenotyping Market Revenue Million Forecast, by Region 2020 & 2033
- Table 7: Global Plants Phenotyping Market Revenue Million Forecast, by Production Analysis 2020 & 2033
- Table 8: Global Plants Phenotyping Market Revenue Million Forecast, by Consumption Analysis 2020 & 2033
- Table 9: Global Plants Phenotyping Market Revenue Million Forecast, by Import Market Analysis (Value & Volume) 2020 & 2033
- Table 10: Global Plants Phenotyping Market Revenue Million Forecast, by Export Market Analysis (Value & Volume) 2020 & 2033
- Table 11: Global Plants Phenotyping Market Revenue Million Forecast, by Price Trend Analysis 2020 & 2033
- Table 12: Global Plants Phenotyping Market Revenue Million Forecast, by Country 2020 & 2033
- Table 13: United States Plants Phenotyping Market Revenue (Million) Forecast, by Application 2020 & 2033
- Table 14: Canada Plants Phenotyping Market Revenue (Million) Forecast, by Application 2020 & 2033
- Table 15: Mexico Plants Phenotyping Market Revenue (Million) Forecast, by Application 2020 & 2033
- Table 16: Global Plants Phenotyping Market Revenue Million Forecast, by Production Analysis 2020 & 2033
- Table 17: Global Plants Phenotyping Market Revenue Million Forecast, by Consumption Analysis 2020 & 2033
- Table 18: Global Plants Phenotyping Market Revenue Million Forecast, by Import Market Analysis (Value & Volume) 2020 & 2033
- Table 19: Global Plants Phenotyping Market Revenue Million Forecast, by Export Market Analysis (Value & Volume) 2020 & 2033
- Table 20: Global Plants Phenotyping Market Revenue Million Forecast, by Price Trend Analysis 2020 & 2033
- Table 21: Global Plants Phenotyping Market Revenue Million Forecast, by Country 2020 & 2033
- Table 22: Brazil Plants Phenotyping Market Revenue (Million) Forecast, by Application 2020 & 2033
- Table 23: Argentina Plants Phenotyping Market Revenue (Million) Forecast, by Application 2020 & 2033
- Table 24: Rest of South America Plants Phenotyping Market Revenue (Million) Forecast, by Application 2020 & 2033
- Table 25: Global Plants Phenotyping Market Revenue Million Forecast, by Production Analysis 2020 & 2033
- Table 26: Global Plants Phenotyping Market Revenue Million Forecast, by Consumption Analysis 2020 & 2033
- Table 27: Global Plants Phenotyping Market Revenue Million Forecast, by Import Market Analysis (Value & Volume) 2020 & 2033
- Table 28: Global Plants Phenotyping Market Revenue Million Forecast, by Export Market Analysis (Value & Volume) 2020 & 2033
- Table 29: Global Plants Phenotyping Market Revenue Million Forecast, by Price Trend Analysis 2020 & 2033
- Table 30: Global Plants Phenotyping Market Revenue Million Forecast, by Country 2020 & 2033
- Table 31: United Kingdom Plants Phenotyping Market Revenue (Million) Forecast, by Application 2020 & 2033
- Table 32: Germany Plants Phenotyping Market Revenue (Million) Forecast, by Application 2020 & 2033
- Table 33: France Plants Phenotyping Market Revenue (Million) Forecast, by Application 2020 & 2033
- Table 34: Italy Plants Phenotyping Market Revenue (Million) Forecast, by Application 2020 & 2033
- Table 35: Spain Plants Phenotyping Market Revenue (Million) Forecast, by Application 2020 & 2033
- Table 36: Russia Plants Phenotyping Market Revenue (Million) Forecast, by Application 2020 & 2033
- Table 37: Benelux Plants Phenotyping Market Revenue (Million) Forecast, by Application 2020 & 2033
- Table 38: Nordics Plants Phenotyping Market Revenue (Million) Forecast, by Application 2020 & 2033
- Table 39: Rest of Europe Plants Phenotyping Market Revenue (Million) Forecast, by Application 2020 & 2033
- Table 40: Global Plants Phenotyping Market Revenue Million Forecast, by Production Analysis 2020 & 2033
- Table 41: Global Plants Phenotyping Market Revenue Million Forecast, by Consumption Analysis 2020 & 2033
- Table 42: Global Plants Phenotyping Market Revenue Million Forecast, by Import Market Analysis (Value & Volume) 2020 & 2033
- Table 43: Global Plants Phenotyping Market Revenue Million Forecast, by Export Market Analysis (Value & Volume) 2020 & 2033
- Table 44: Global Plants Phenotyping Market Revenue Million Forecast, by Price Trend Analysis 2020 & 2033
- Table 45: Global Plants Phenotyping Market Revenue Million Forecast, by Country 2020 & 2033
- Table 46: Turkey Plants Phenotyping Market Revenue (Million) Forecast, by Application 2020 & 2033
- Table 47: Israel Plants Phenotyping Market Revenue (Million) Forecast, by Application 2020 & 2033
- Table 48: GCC Plants Phenotyping Market Revenue (Million) Forecast, by Application 2020 & 2033
- Table 49: North Africa Plants Phenotyping Market Revenue (Million) Forecast, by Application 2020 & 2033
- Table 50: South Africa Plants Phenotyping Market Revenue (Million) Forecast, by Application 2020 & 2033
- Table 51: Rest of Middle East & Africa Plants Phenotyping Market Revenue (Million) Forecast, by Application 2020 & 2033
- Table 52: Global Plants Phenotyping Market Revenue Million Forecast, by Production Analysis 2020 & 2033
- Table 53: Global Plants Phenotyping Market Revenue Million Forecast, by Consumption Analysis 2020 & 2033
- Table 54: Global Plants Phenotyping Market Revenue Million Forecast, by Import Market Analysis (Value & Volume) 2020 & 2033
- Table 55: Global Plants Phenotyping Market Revenue Million Forecast, by Export Market Analysis (Value & Volume) 2020 & 2033
- Table 56: Global Plants Phenotyping Market Revenue Million Forecast, by Price Trend Analysis 2020 & 2033
- Table 57: Global Plants Phenotyping Market Revenue Million Forecast, by Country 2020 & 2033
- Table 58: China Plants Phenotyping Market Revenue (Million) Forecast, by Application 2020 & 2033
- Table 59: India Plants Phenotyping Market Revenue (Million) Forecast, by Application 2020 & 2033
- Table 60: Japan Plants Phenotyping Market Revenue (Million) Forecast, by Application 2020 & 2033
- Table 61: South Korea Plants Phenotyping Market Revenue (Million) Forecast, by Application 2020 & 2033
- Table 62: ASEAN Plants Phenotyping Market Revenue (Million) Forecast, by Application 2020 & 2033
- Table 63: Oceania Plants Phenotyping Market Revenue (Million) Forecast, by Application 2020 & 2033
- Table 64: Rest of Asia Pacific Plants Phenotyping Market Revenue (Million) Forecast, by Application 2020 & 2033
Frequently Asked Questions
1. What is the projected Compound Annual Growth Rate (CAGR) of the Plants Phenotyping Market?
The projected CAGR is approximately 10.50%.
2. Which companies are prominent players in the Plants Phenotyping Market?
Key companies in the market include Rothamsted Research, Phenospex, Delta-T Devices, Keygene, PSI (Photon Systems Instruments), BASF SE (Crop Design), Heinz Walz GmbH, The Vienna Biocenter Core Facilities, LemnaTec GmbH, Phenomix, WP, Qubit Systems.
3. What are the main segments of the Plants Phenotyping Market?
The market segments include Production Analysis, Consumption Analysis, Import Market Analysis (Value & Volume), Export Market Analysis (Value & Volume), Price Trend Analysis.
4. Can you provide details about the market size?
The market size is estimated to be USD 281.32 Million as of 2022.
5. What are some drivers contributing to market growth?
Demand For Landscaping Maintenance; Adoption of Green Spaces and Green Roofs.
6. What are the notable trends driving market growth?
Increasing Number of Seed Borne Diseases is Driving the Market.
7. Are there any restraints impacting market growth?
Shortage of Labor In Landscaping; High Maintenance Cost of Lawn Mowers.
8. Can you provide examples of recent developments in the market?
N/A
9. What pricing options are available for accessing the report?
Pricing options include single-user, multi-user, and enterprise licenses priced at USD 4750, USD 5250, and USD 8750 respectively.
10. Is the market size provided in terms of value or volume?
The market size is provided in terms of value, measured in Million.
11. Are there any specific market keywords associated with the report?
Yes, the market keyword associated with the report is "Plants Phenotyping Market," which aids in identifying and referencing the specific market segment covered.
12. How do I determine which pricing option suits my needs best?
The pricing options vary based on user requirements and access needs. Individual users may opt for single-user licenses, while businesses requiring broader access may choose multi-user or enterprise licenses for cost-effective access to the report.
13. Are there any additional resources or data provided in the Plants Phenotyping Market report?
While the report offers comprehensive insights, it's advisable to review the specific contents or supplementary materials provided to ascertain if additional resources or data are available.
14. How can I stay updated on further developments or reports in the Plants Phenotyping Market?
To stay informed about further developments, trends, and reports in the Plants Phenotyping Market, consider subscribing to industry newsletters, following relevant companies and organizations, or regularly checking reputable industry news sources and publications.
Methodology
Step 1 - Identification of Relevant Samples Size from Population Database


Step 2 - Approaches for Defining Global Market Size (Value, Volume* & Price*)

Note*: In applicable scenarios
Step 3 - Data Sources
Primary Research
- Web Analytics
- Survey Reports
- Research Institute
- Latest Research Reports
- Opinion Leaders
Secondary Research
- Annual Reports
- White Paper
- Latest Press Release
- Industry Association
- Paid Database
- Investor Presentations

Step 4 - Data Triangulation
Involves using different sources of information in order to increase the validity of a study
These sources are likely to be stakeholders in a program - participants, other researchers, program staff, other community members, and so on.
Then we put all data in single framework & apply various statistical tools to find out the dynamic on the market.
During the analysis stage, feedback from the stakeholder groups would be compared to determine areas of agreement as well as areas of divergence