

Key Insights
The global poultry market is experiencing robust expansion, projected to reach approximately USD 57,639 million by 2025, driven by a CAGR of 3.5% over the forecast period of 2025-2033. This growth is primarily fueled by the increasing global demand for protein, particularly among a growing population with rising disposable incomes and a greater awareness of the health benefits associated with poultry consumption, such as its lean protein content and lower fat profile compared to red meats. Furthermore, the growing preference for convenient and affordable food options contributes significantly to the market's upward trajectory. Key applications within the market include layers, fattened poultry, and reproduction segments, with chicks and eggs representing critical components of the supply chain. The industrialization of poultry farming, coupled with advancements in breeding, nutrition, and disease management, has led to enhanced production efficiency and a more consistent supply, further bolstering market growth.
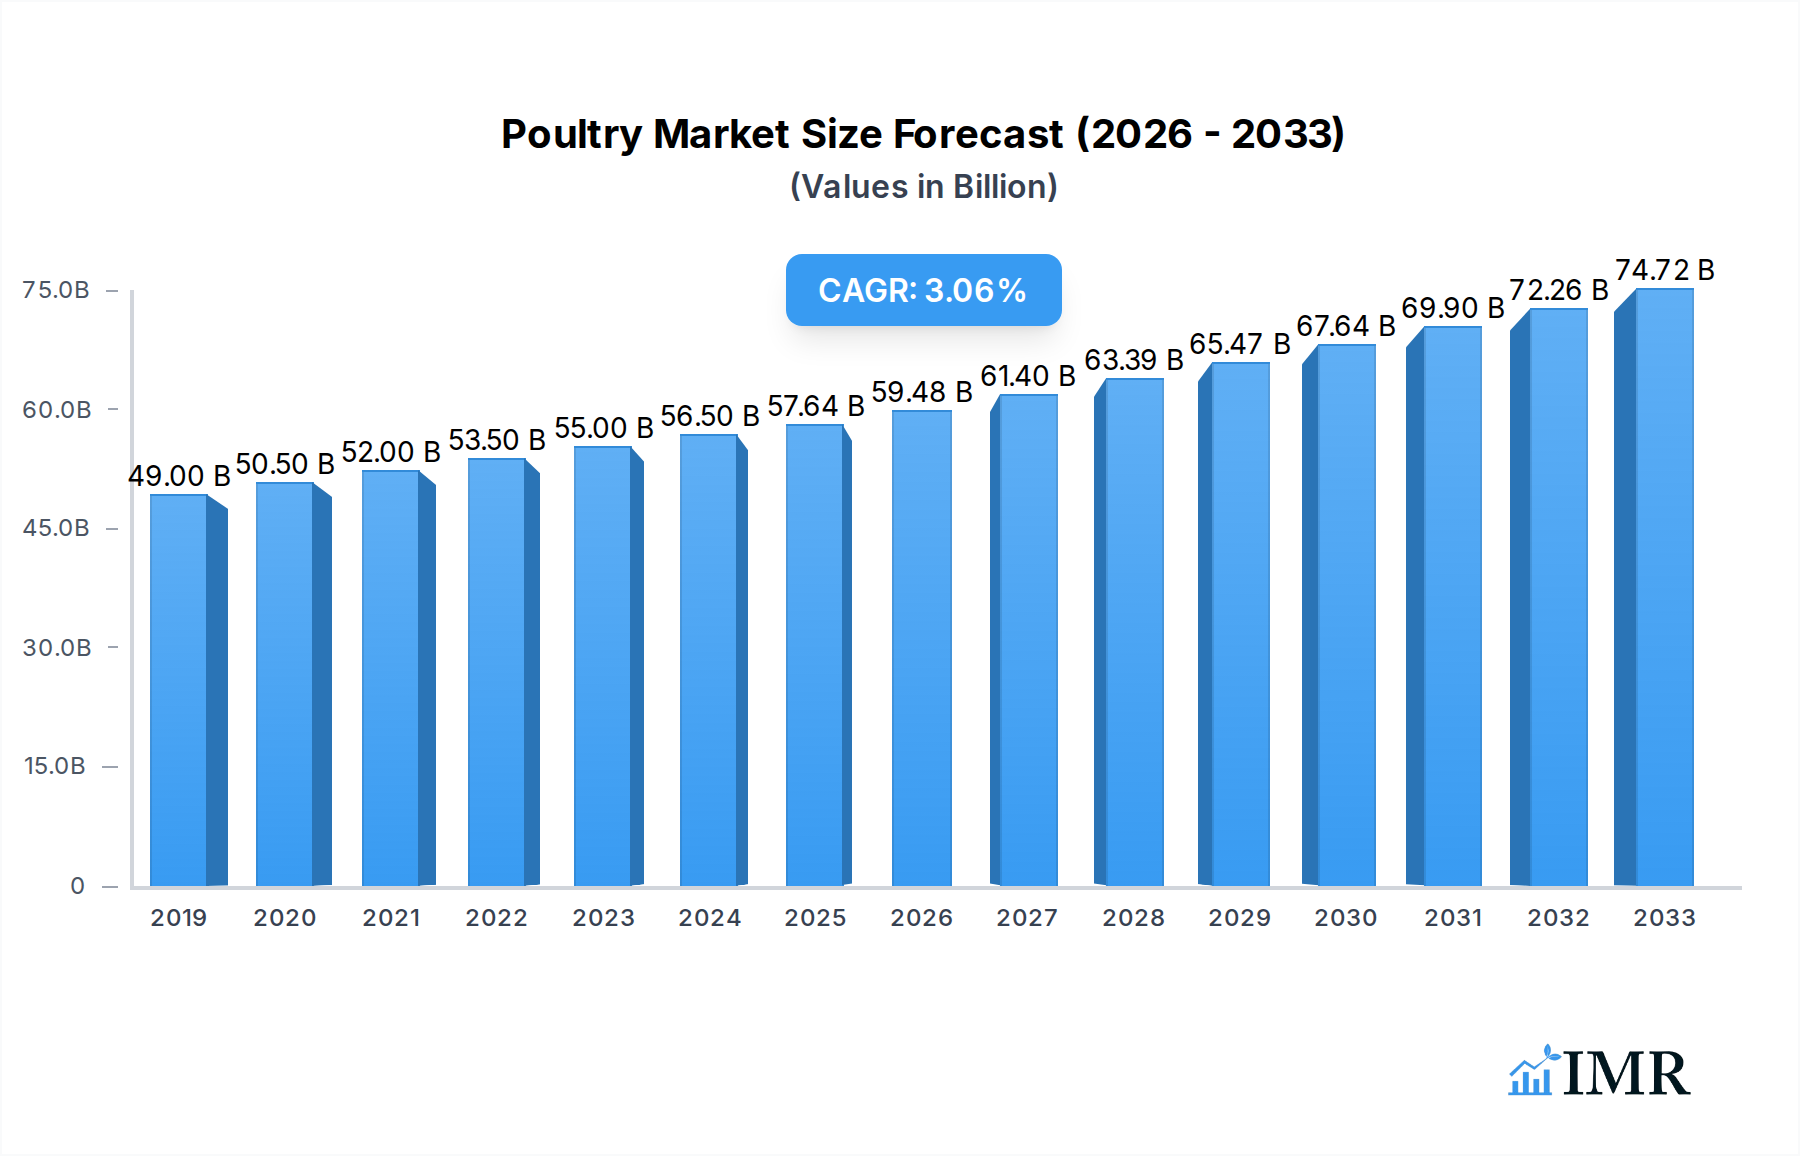
Poultry Market Size (In Billion)
The poultry market is characterized by a dynamic competitive landscape with major players like JBS, Tyson Foods, and CP Group leading the charge. Emerging economies, particularly in the Asia Pacific region, are expected to be significant growth engines due to rapid urbanization, changing dietary patterns, and increasing investments in poultry infrastructure. However, the market faces certain restraints, including the potential for avian influenza outbreaks, which can disrupt supply chains and consumer confidence, as well as growing concerns regarding animal welfare and the environmental impact of large-scale poultry operations. Regulatory frameworks and consumer demand for sustainable and ethically produced poultry are also becoming increasingly influential. Despite these challenges, the market is poised for continued growth, with ongoing innovation in feed efficiency, disease prevention, and value-added poultry products expected to shape its future.

Poultry Company Market Share
This comprehensive report offers an in-depth analysis of the global poultry market, a dynamic sector vital to food security and agricultural economies. Covering the period from 2019 to 2033, with a base year of 2025, this study provides critical insights into market structure, growth trajectories, regional dominance, product innovation, and the strategic landscapes of key players. It delves into parent and child market dynamics, essential for understanding the intricate value chain, from breeding and feed to processing and retail.
Poultry Market Dynamics & Structure
The global poultry market, valued at an estimated $270,000 million in 2025, is characterized by a moderately concentrated structure. Major players like JBS, Tyson Foods, and CP Group hold significant market shares, driving innovation and setting industry standards. Technological advancements, particularly in breeding genetics, feed efficiency, and disease prevention, are pivotal drivers of market growth. The increasing adoption of AI-powered monitoring systems and automated processing lines is further enhancing operational efficiency and product quality.
- Market Concentration: The top ten companies account for approximately 65% of the global market share.
- Technological Innovation Drivers: Advancements in genomics for enhanced bird performance, precision feeding systems, and advanced biosecurity measures are key.
- Regulatory Frameworks: Stringent food safety regulations, animal welfare standards, and import/export policies significantly influence market operations and international trade.
- Competitive Product Substitutes: While poultry remains a primary protein source, competition exists from red meat, fish, and plant-based protein alternatives.
- End-User Demographics: Growing global populations, increasing disposable incomes, and a rising demand for protein-rich diets are favorable demographic trends.
- M&A Trends: The sector has witnessed strategic mergers and acquisitions aimed at expanding geographical reach, consolidating supply chains, and gaining access to new technologies. In the historical period (2019-2024), an estimated 35 major M&A deals were completed, involving transactions totaling over $15,000 million.
Poultry Growth Trends & Insights
The global poultry market is projected for robust expansion, exhibiting a Compound Annual Growth Rate (CAGR) of approximately 4.5% from 2025 to 2033. This growth is underpinned by fundamental shifts in global dietary patterns and sustained economic development in emerging economies. The rising consumer preference for lean protein sources, coupled with the relatively lower cost and widespread availability of poultry products compared to other meats, continues to fuel demand. Technological disruptions are playing a crucial role in shaping market evolution. Innovations in vertical farming and controlled environment agriculture for feed production are enhancing sustainability and cost-effectiveness.
The adoption rates of advanced farming techniques, such as automated climate control, real-time health monitoring, and data analytics for optimizing flock management, are steadily increasing across major producing regions. These technologies not only improve bird welfare and productivity but also contribute to reducing the environmental footprint of poultry farming. Consumer behavior is increasingly influenced by factors such as perceived health benefits, convenience, and ethical sourcing. There is a growing demand for organic, free-range, and antibiotic-free poultry products, creating niche market opportunities and driving product differentiation.
The market penetration of processed poultry products, including ready-to-cook meals and value-added snacks, is also on the rise, catering to the convenience-seeking urban populations. The impact of digitalization and e-commerce platforms is further democratizing access to poultry products, allowing smaller producers to reach wider consumer bases. Furthermore, government initiatives promoting domestic poultry production and food security in developing nations are expected to be significant growth catalysts. The increasing awareness of the nutritional advantages of poultry, such as high protein content and lower fat profiles, continues to solidify its position as a preferred protein choice globally.
Dominant Regions, Countries, or Segments in Poultry
The Fattened segment, particularly broiler production for meat, currently dominates the global poultry market, driven by its significant contribution to the overall food supply and consistent consumer demand. This segment is projected to maintain its leading position throughout the forecast period. Asia-Pacific, led by China and India, is the largest and fastest-growing regional market. The region's dominance is attributed to its massive population, increasing urbanization, rising disposable incomes, and a growing preference for protein-rich diets.
- Key Drivers in Asia-Pacific:
- Economic Policies: Proactive government support for the agricultural sector, including subsidies and investment in infrastructure, fosters growth.
- Infrastructure Development: Enhanced logistics and cold chain facilities are improving the distribution and availability of poultry products.
- Consumer Demand: The sheer volume of consumers and their increasing purchasing power translate into substantial demand for affordable protein.
- Technological Adoption: The region is rapidly adopting modern poultry farming technologies to improve efficiency and output.
- Market Share: Asia-Pacific is estimated to hold over 40% of the global poultry market share, with a projected CAGR of 5.0% during the forecast period.
North America, specifically the United States, remains a significant player due to the presence of major poultry producers and advanced farming practices. Europe, while mature, shows steady demand, particularly for premium and sustainably produced poultry. Latin America is emerging as a strong growth region, driven by increasing production capabilities and export potential.
The Layers segment, focused on egg production, also represents a substantial portion of the market, vital for both direct consumption and as an ingredient in various food industries. The Reproduction segment, encompassing breeding stock and associated services, forms the foundational child market, enabling the scalability and genetic improvement of the broader poultry industry. Innovations in breeding programs and artificial insemination technologies are crucial for enhancing the efficiency and output of this segment.
Poultry Product Landscape
The poultry product landscape is evolving rapidly, driven by continuous innovation and a strong focus on consumer preferences. Products are becoming increasingly diversified, ranging from whole birds and pre-cut portions to ready-to-cook meals, processed snacks, and plant-based poultry alternatives. Technological advancements are enabling the development of products with enhanced shelf life, improved nutritional profiles, and novel flavor enhancements. Unique selling propositions often revolve around sustainability, animal welfare, and health benefits, such as "antibiotic-free" or "ethically raised" labels.
Key Drivers, Barriers & Challenges in Poultry
Key Drivers:
- Growing Global Population: Increasing demand for protein worldwide.
- Affordability and Availability: Poultry's cost-effectiveness and widespread accessibility.
- Nutritional Benefits: High protein content and perceived health advantages.
- Technological Advancements: Improved breeding, feed, and disease management techniques boosting efficiency.
- Government Support: Policies promoting domestic production and food security initiatives.
Barriers & Challenges:
- Disease Outbreaks: Avian influenza and other diseases pose significant threats to flocks and market stability, with past outbreaks causing billions in economic losses.
- Environmental Concerns: Waste management and greenhouse gas emissions are under increasing scrutiny, leading to stricter regulations.
- Feed Price Volatility: Fluctuations in the cost of feed grains significantly impact profitability.
- Regulatory Compliance: Adhering to evolving food safety, animal welfare, and environmental standards requires substantial investment.
- Consumer Perception and Ethics: Growing consumer interest in animal welfare and ethical farming practices can create market pressures.
- Supply Chain Disruptions: Global events can impact the availability and cost of inputs and the distribution of finished products.
Emerging Opportunities in Poultry
Emerging opportunities lie in the development of advanced feed formulations utilizing alternative protein sources, reducing reliance on traditional grains and mitigating price volatility. The burgeoning market for plant-based poultry alternatives, leveraging innovative protein extraction and texturization technologies, presents a significant growth avenue. Further opportunities exist in precision agriculture and data analytics for optimizing flock health and resource utilization, alongside the expansion of traceable and transparent supply chains that appeal to ethically conscious consumers. The development of specialized poultry products for specific dietary needs, such as high-protein, low-fat options, also holds promise.
Growth Accelerators in the Poultry Industry
Several catalysts are accelerating growth in the poultry industry. Technological breakthroughs in genetic selection are yielding birds with superior feed conversion ratios and faster growth rates. Strategic partnerships between feed manufacturers, technology providers, and poultry integrators are driving efficiency and innovation across the value chain. Market expansion strategies, particularly into underserved developing economies with rising protein demand, are opening new revenue streams. Furthermore, continuous investment in research and development for disease prevention and vaccine technologies is enhancing flock resilience and reducing economic losses.
Key Players Shaping the Poultry Market
- JBS
- Tyson Foods
- CP Group
- Wens Foodstuff Group
- Sanderson Farms
- Industrias Bachoco
- Koch Foods
- BRF
- New Hope Liuhe
- Perdue Farms
- Cargill
- Hormel Foods
- PHW
- Cal-Maine Foods
- OSI Group
- Rose Acre Farms
- Hendrix Genetics
- Grimaud
- Nutreco
- Hunan Xiangjia
- Wellhope
- Sunner
Notable Milestones in Poultry Sector
- 2019: Introduction of advanced AI-driven health monitoring systems in large-scale broiler farms.
- 2020: Increased investment in R&D for antibiotic-free production methods by major companies.
- 2021: Significant mergers and acquisitions aimed at consolidating market share and expanding global reach.
- 2022: Enhanced focus on sustainable feed ingredients and circular economy practices in poultry farming.
- 2023: Development and wider adoption of advanced biosecurity protocols to combat disease outbreaks.
- 2024: Growth in demand for plant-based poultry alternatives and innovative processing technologies.
In-Depth Poultry Market Outlook
The poultry market is poised for sustained and significant growth, driven by its fundamental role in global food security and evolving consumer demands. The confluence of technological innovation, a growing global population, and increasing disposable incomes in emerging markets will act as powerful growth accelerators. Strategic investments in sustainable practices, advanced genetics, and efficient supply chains will be crucial for companies to maintain a competitive edge. The industry's ability to adapt to evolving regulatory landscapes and consumer preferences for ethical and healthy products will further shape its future trajectory, presenting substantial opportunities for market expansion and value creation.
Poultry Segmentation
-
1. Application
- 1.1. Layers
- 1.2. Fattened
- 1.3. Reproduction
-
2. Type
- 2.1. Chicks
- 2.2. Eggs
Poultry Segmentation By Geography
-
1. North America
- 1.1. United States
- 1.2. Canada
- 1.3. Mexico
-
2. South America
- 2.1. Brazil
- 2.2. Argentina
- 2.3. Rest of South America
-
3. Europe
- 3.1. United Kingdom
- 3.2. Germany
- 3.3. France
- 3.4. Italy
- 3.5. Spain
- 3.6. Russia
- 3.7. Benelux
- 3.8. Nordics
- 3.9. Rest of Europe
-
4. Middle East & Africa
- 4.1. Turkey
- 4.2. Israel
- 4.3. GCC
- 4.4. North Africa
- 4.5. South Africa
- 4.6. Rest of Middle East & Africa
-
5. Asia Pacific
- 5.1. China
- 5.2. India
- 5.3. Japan
- 5.4. South Korea
- 5.5. ASEAN
- 5.6. Oceania
- 5.7. Rest of Asia Pacific
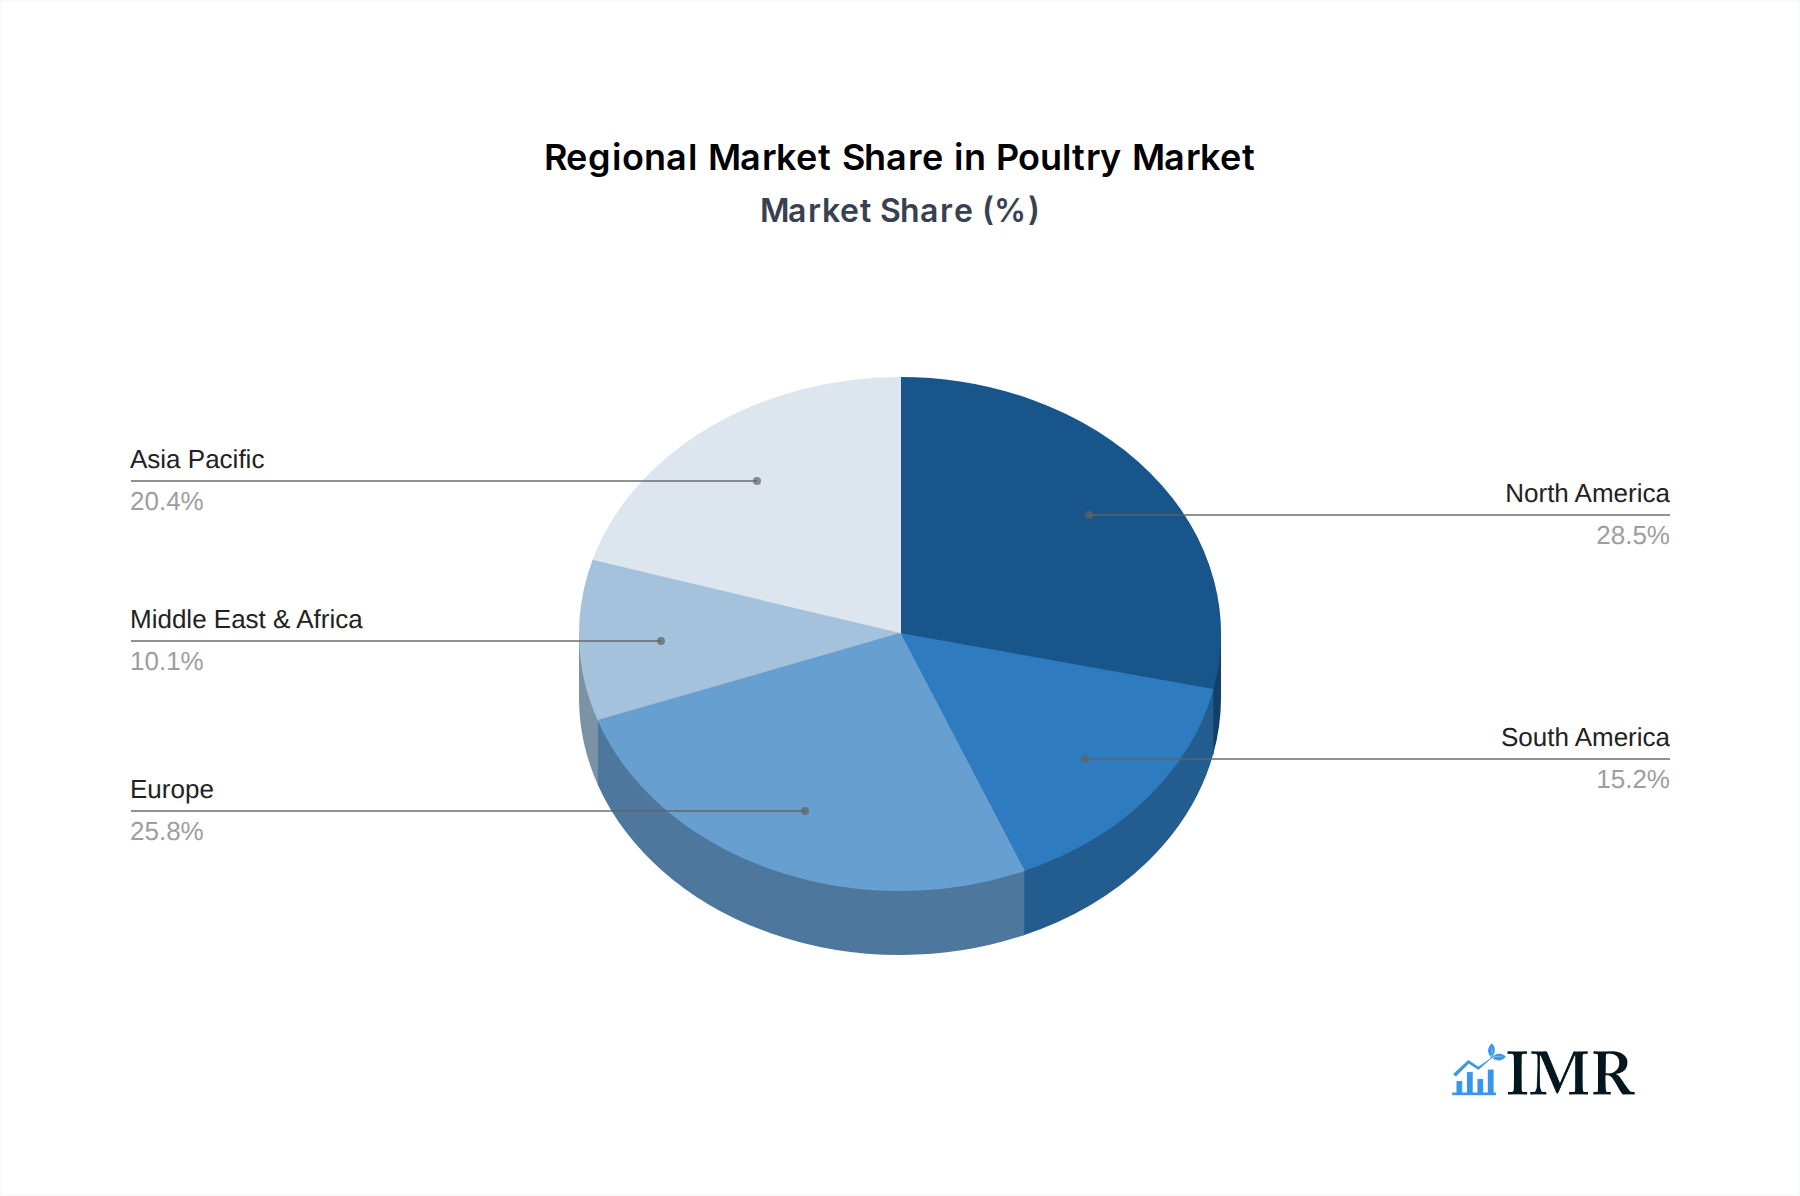
Poultry Regional Market Share
Geographic Coverage of Poultry
Poultry REPORT HIGHLIGHTS
| Aspects | Details |
|---|---|
| Study Period | 2020-2034 |
| Base Year | 2025 |
| Estimated Year | 2026 |
| Forecast Period | 2026-2034 |
| Historical Period | 2020-2025 |
| Growth Rate | CAGR of 13.8% from 2020-2034 |
| Segmentation |
|
Table of Contents
- 1. Introduction
- 1.1. Research Scope
- 1.2. Market Segmentation
- 1.3. Research Objective
- 1.4. Definitions and Assumptions
- 2. Executive Summary
- 2.1. Market Snapshot
- 3. Market Dynamics
- 3.1. Market Drivers
- 3.2. Market Restrains
- 3.3. Market Trends
- 3.4. Market Opportunities
- 4. Market Factor Analysis
- 4.1. Porters Five Forces
- 4.1.1. Bargaining Power of Suppliers
- 4.1.2. Bargaining Power of Buyers
- 4.1.3. Threat of New Entrants
- 4.1.4. Threat of Substitutes
- 4.1.5. Competitive Rivalry
- 4.2. PESTEL analysis
- 4.3. BCG Analysis
- 4.3.1. Stars (High Growth, High Market Share)
- 4.3.2. Cash Cows (Low Growth, High Market Share)
- 4.3.3. Question Mark (High Growth, Low Market Share)
- 4.3.4. Dogs (Low Growth, Low Market Share)
- 4.4. Ansoff Matrix Analysis
- 4.5. Supply Chain Analysis
- 4.6. Regulatory Landscape
- 4.7. Current Market Potential and Opportunity Assessment (TAM–SAM–SOM Framework)
- 4.8. IMR Analyst Note
- 4.1. Porters Five Forces
- 5. Market Analysis, Insights and Forecast 2021-2033
- 5.1. Market Analysis, Insights and Forecast - by Application
- 5.1.1. Layers
- 5.1.2. Fattened
- 5.1.3. Reproduction
- 5.2. Market Analysis, Insights and Forecast - by Type
- 5.2.1. Chicks
- 5.2.2. Eggs
- 5.3. Market Analysis, Insights and Forecast - by Region
- 5.3.1. North America
- 5.3.2. South America
- 5.3.3. Europe
- 5.3.4. Middle East & Africa
- 5.3.5. Asia Pacific
- 5.1. Market Analysis, Insights and Forecast - by Application
- 6. Global Poultry Analysis, Insights and Forecast, 2021-2033
- 6.1. Market Analysis, Insights and Forecast - by Application
- 6.1.1. Layers
- 6.1.2. Fattened
- 6.1.3. Reproduction
- 6.2. Market Analysis, Insights and Forecast - by Type
- 6.2.1. Chicks
- 6.2.2. Eggs
- 6.1. Market Analysis, Insights and Forecast - by Application
- 7. North America Poultry Analysis, Insights and Forecast, 2020-2032
- 7.1. Market Analysis, Insights and Forecast - by Application
- 7.1.1. Layers
- 7.1.2. Fattened
- 7.1.3. Reproduction
- 7.2. Market Analysis, Insights and Forecast - by Type
- 7.2.1. Chicks
- 7.2.2. Eggs
- 7.1. Market Analysis, Insights and Forecast - by Application
- 8. South America Poultry Analysis, Insights and Forecast, 2020-2032
- 8.1. Market Analysis, Insights and Forecast - by Application
- 8.1.1. Layers
- 8.1.2. Fattened
- 8.1.3. Reproduction
- 8.2. Market Analysis, Insights and Forecast - by Type
- 8.2.1. Chicks
- 8.2.2. Eggs
- 8.1. Market Analysis, Insights and Forecast - by Application
- 9. Europe Poultry Analysis, Insights and Forecast, 2020-2032
- 9.1. Market Analysis, Insights and Forecast - by Application
- 9.1.1. Layers
- 9.1.2. Fattened
- 9.1.3. Reproduction
- 9.2. Market Analysis, Insights and Forecast - by Type
- 9.2.1. Chicks
- 9.2.2. Eggs
- 9.1. Market Analysis, Insights and Forecast - by Application
- 10. Middle East & Africa Poultry Analysis, Insights and Forecast, 2020-2032
- 10.1. Market Analysis, Insights and Forecast - by Application
- 10.1.1. Layers
- 10.1.2. Fattened
- 10.1.3. Reproduction
- 10.2. Market Analysis, Insights and Forecast - by Type
- 10.2.1. Chicks
- 10.2.2. Eggs
- 10.1. Market Analysis, Insights and Forecast - by Application
- 11. Asia Pacific Poultry Analysis, Insights and Forecast, 2020-2032
- 11.1. Market Analysis, Insights and Forecast - by Application
- 11.1.1. Layers
- 11.1.2. Fattened
- 11.1.3. Reproduction
- 11.2. Market Analysis, Insights and Forecast - by Type
- 11.2.1. Chicks
- 11.2.2. Eggs
- 11.1. Market Analysis, Insights and Forecast - by Application
- 12. Competitive Analysis
- 12.1. Company Profiles
- 12.1.1 JBS
- 12.1.1.1. Company Overview
- 12.1.1.2. Products
- 12.1.1.3. Company Financials
- 12.1.1.4. SWOT Analysis
- 12.1.2 Tyson Foods
- 12.1.2.1. Company Overview
- 12.1.2.2. Products
- 12.1.2.3. Company Financials
- 12.1.2.4. SWOT Analysis
- 12.1.3 CP Group
- 12.1.3.1. Company Overview
- 12.1.3.2. Products
- 12.1.3.3. Company Financials
- 12.1.3.4. SWOT Analysis
- 12.1.4 Wens Foodstuff Group
- 12.1.4.1. Company Overview
- 12.1.4.2. Products
- 12.1.4.3. Company Financials
- 12.1.4.4. SWOT Analysis
- 12.1.5 Sanderson Farms
- 12.1.5.1. Company Overview
- 12.1.5.2. Products
- 12.1.5.3. Company Financials
- 12.1.5.4. SWOT Analysis
- 12.1.6 Industrias Bachoco
- 12.1.6.1. Company Overview
- 12.1.6.2. Products
- 12.1.6.3. Company Financials
- 12.1.6.4. SWOT Analysis
- 12.1.7 Koch Foods
- 12.1.7.1. Company Overview
- 12.1.7.2. Products
- 12.1.7.3. Company Financials
- 12.1.7.4. SWOT Analysis
- 12.1.8 BRF
- 12.1.8.1. Company Overview
- 12.1.8.2. Products
- 12.1.8.3. Company Financials
- 12.1.8.4. SWOT Analysis
- 12.1.9 New Hope Liuhe
- 12.1.9.1. Company Overview
- 12.1.9.2. Products
- 12.1.9.3. Company Financials
- 12.1.9.4. SWOT Analysis
- 12.1.10 Perdue Farms
- 12.1.10.1. Company Overview
- 12.1.10.2. Products
- 12.1.10.3. Company Financials
- 12.1.10.4. SWOT Analysis
- 12.1.11 Cargill
- 12.1.11.1. Company Overview
- 12.1.11.2. Products
- 12.1.11.3. Company Financials
- 12.1.11.4. SWOT Analysis
- 12.1.12 Hormel Foods
- 12.1.12.1. Company Overview
- 12.1.12.2. Products
- 12.1.12.3. Company Financials
- 12.1.12.4. SWOT Analysis
- 12.1.13 PHW
- 12.1.13.1. Company Overview
- 12.1.13.2. Products
- 12.1.13.3. Company Financials
- 12.1.13.4. SWOT Analysis
- 12.1.14 Cal-Maine Foods
- 12.1.14.1. Company Overview
- 12.1.14.2. Products
- 12.1.14.3. Company Financials
- 12.1.14.4. SWOT Analysis
- 12.1.15 OSI Group
- 12.1.15.1. Company Overview
- 12.1.15.2. Products
- 12.1.15.3. Company Financials
- 12.1.15.4. SWOT Analysis
- 12.1.16 Rose Acre Farms
- 12.1.16.1. Company Overview
- 12.1.16.2. Products
- 12.1.16.3. Company Financials
- 12.1.16.4. SWOT Analysis
- 12.1.17 Hendrix Genetics
- 12.1.17.1. Company Overview
- 12.1.17.2. Products
- 12.1.17.3. Company Financials
- 12.1.17.4. SWOT Analysis
- 12.1.18 Grimaud
- 12.1.18.1. Company Overview
- 12.1.18.2. Products
- 12.1.18.3. Company Financials
- 12.1.18.4. SWOT Analysis
- 12.1.19 Nutreco
- 12.1.19.1. Company Overview
- 12.1.19.2. Products
- 12.1.19.3. Company Financials
- 12.1.19.4. SWOT Analysis
- 12.1.20 Hunan Xiangjia
- 12.1.20.1. Company Overview
- 12.1.20.2. Products
- 12.1.20.3. Company Financials
- 12.1.20.4. SWOT Analysis
- 12.1.21 Wellhope
- 12.1.21.1. Company Overview
- 12.1.21.2. Products
- 12.1.21.3. Company Financials
- 12.1.21.4. SWOT Analysis
- 12.1.22 Sunner
- 12.1.22.1. Company Overview
- 12.1.22.2. Products
- 12.1.22.3. Company Financials
- 12.1.22.4. SWOT Analysis
- 12.1.1 JBS
- 12.2. Market Entropy
- 12.2.1 Company's Key Areas Served
- 12.2.2 Recent Developments
- 12.3. Company Market Share Analysis 2025
- 12.3.1 Top 5 Companies Market Share Analysis
- 12.3.2 Top 3 Companies Market Share Analysis
- 12.4. List of Potential Customers
- 13. Research Methodology
List of Figures
- Figure 1: Global Poultry Revenue Breakdown (billion, %) by Region 2025 & 2033
- Figure 2: Global Poultry Volume Breakdown (K, %) by Region 2025 & 2033
- Figure 3: North America Poultry Revenue (billion), by Application 2025 & 2033
- Figure 4: North America Poultry Volume (K), by Application 2025 & 2033
- Figure 5: North America Poultry Revenue Share (%), by Application 2025 & 2033
- Figure 6: North America Poultry Volume Share (%), by Application 2025 & 2033
- Figure 7: North America Poultry Revenue (billion), by Type 2025 & 2033
- Figure 8: North America Poultry Volume (K), by Type 2025 & 2033
- Figure 9: North America Poultry Revenue Share (%), by Type 2025 & 2033
- Figure 10: North America Poultry Volume Share (%), by Type 2025 & 2033
- Figure 11: North America Poultry Revenue (billion), by Country 2025 & 2033
- Figure 12: North America Poultry Volume (K), by Country 2025 & 2033
- Figure 13: North America Poultry Revenue Share (%), by Country 2025 & 2033
- Figure 14: North America Poultry Volume Share (%), by Country 2025 & 2033
- Figure 15: South America Poultry Revenue (billion), by Application 2025 & 2033
- Figure 16: South America Poultry Volume (K), by Application 2025 & 2033
- Figure 17: South America Poultry Revenue Share (%), by Application 2025 & 2033
- Figure 18: South America Poultry Volume Share (%), by Application 2025 & 2033
- Figure 19: South America Poultry Revenue (billion), by Type 2025 & 2033
- Figure 20: South America Poultry Volume (K), by Type 2025 & 2033
- Figure 21: South America Poultry Revenue Share (%), by Type 2025 & 2033
- Figure 22: South America Poultry Volume Share (%), by Type 2025 & 2033
- Figure 23: South America Poultry Revenue (billion), by Country 2025 & 2033
- Figure 24: South America Poultry Volume (K), by Country 2025 & 2033
- Figure 25: South America Poultry Revenue Share (%), by Country 2025 & 2033
- Figure 26: South America Poultry Volume Share (%), by Country 2025 & 2033
- Figure 27: Europe Poultry Revenue (billion), by Application 2025 & 2033
- Figure 28: Europe Poultry Volume (K), by Application 2025 & 2033
- Figure 29: Europe Poultry Revenue Share (%), by Application 2025 & 2033
- Figure 30: Europe Poultry Volume Share (%), by Application 2025 & 2033
- Figure 31: Europe Poultry Revenue (billion), by Type 2025 & 2033
- Figure 32: Europe Poultry Volume (K), by Type 2025 & 2033
- Figure 33: Europe Poultry Revenue Share (%), by Type 2025 & 2033
- Figure 34: Europe Poultry Volume Share (%), by Type 2025 & 2033
- Figure 35: Europe Poultry Revenue (billion), by Country 2025 & 2033
- Figure 36: Europe Poultry Volume (K), by Country 2025 & 2033
- Figure 37: Europe Poultry Revenue Share (%), by Country 2025 & 2033
- Figure 38: Europe Poultry Volume Share (%), by Country 2025 & 2033
- Figure 39: Middle East & Africa Poultry Revenue (billion), by Application 2025 & 2033
- Figure 40: Middle East & Africa Poultry Volume (K), by Application 2025 & 2033
- Figure 41: Middle East & Africa Poultry Revenue Share (%), by Application 2025 & 2033
- Figure 42: Middle East & Africa Poultry Volume Share (%), by Application 2025 & 2033
- Figure 43: Middle East & Africa Poultry Revenue (billion), by Type 2025 & 2033
- Figure 44: Middle East & Africa Poultry Volume (K), by Type 2025 & 2033
- Figure 45: Middle East & Africa Poultry Revenue Share (%), by Type 2025 & 2033
- Figure 46: Middle East & Africa Poultry Volume Share (%), by Type 2025 & 2033
- Figure 47: Middle East & Africa Poultry Revenue (billion), by Country 2025 & 2033
- Figure 48: Middle East & Africa Poultry Volume (K), by Country 2025 & 2033
- Figure 49: Middle East & Africa Poultry Revenue Share (%), by Country 2025 & 2033
- Figure 50: Middle East & Africa Poultry Volume Share (%), by Country 2025 & 2033
- Figure 51: Asia Pacific Poultry Revenue (billion), by Application 2025 & 2033
- Figure 52: Asia Pacific Poultry Volume (K), by Application 2025 & 2033
- Figure 53: Asia Pacific Poultry Revenue Share (%), by Application 2025 & 2033
- Figure 54: Asia Pacific Poultry Volume Share (%), by Application 2025 & 2033
- Figure 55: Asia Pacific Poultry Revenue (billion), by Type 2025 & 2033
- Figure 56: Asia Pacific Poultry Volume (K), by Type 2025 & 2033
- Figure 57: Asia Pacific Poultry Revenue Share (%), by Type 2025 & 2033
- Figure 58: Asia Pacific Poultry Volume Share (%), by Type 2025 & 2033
- Figure 59: Asia Pacific Poultry Revenue (billion), by Country 2025 & 2033
- Figure 60: Asia Pacific Poultry Volume (K), by Country 2025 & 2033
- Figure 61: Asia Pacific Poultry Revenue Share (%), by Country 2025 & 2033
- Figure 62: Asia Pacific Poultry Volume Share (%), by Country 2025 & 2033
List of Tables
- Table 1: Global Poultry Revenue billion Forecast, by Application 2020 & 2033
- Table 2: Global Poultry Volume K Forecast, by Application 2020 & 2033
- Table 3: Global Poultry Revenue billion Forecast, by Type 2020 & 2033
- Table 4: Global Poultry Volume K Forecast, by Type 2020 & 2033
- Table 5: Global Poultry Revenue billion Forecast, by Region 2020 & 2033
- Table 6: Global Poultry Volume K Forecast, by Region 2020 & 2033
- Table 7: Global Poultry Revenue billion Forecast, by Application 2020 & 2033
- Table 8: Global Poultry Volume K Forecast, by Application 2020 & 2033
- Table 9: Global Poultry Revenue billion Forecast, by Type 2020 & 2033
- Table 10: Global Poultry Volume K Forecast, by Type 2020 & 2033
- Table 11: Global Poultry Revenue billion Forecast, by Country 2020 & 2033
- Table 12: Global Poultry Volume K Forecast, by Country 2020 & 2033
- Table 13: United States Poultry Revenue (billion) Forecast, by Application 2020 & 2033
- Table 14: United States Poultry Volume (K) Forecast, by Application 2020 & 2033
- Table 15: Canada Poultry Revenue (billion) Forecast, by Application 2020 & 2033
- Table 16: Canada Poultry Volume (K) Forecast, by Application 2020 & 2033
- Table 17: Mexico Poultry Revenue (billion) Forecast, by Application 2020 & 2033
- Table 18: Mexico Poultry Volume (K) Forecast, by Application 2020 & 2033
- Table 19: Global Poultry Revenue billion Forecast, by Application 2020 & 2033
- Table 20: Global Poultry Volume K Forecast, by Application 2020 & 2033
- Table 21: Global Poultry Revenue billion Forecast, by Type 2020 & 2033
- Table 22: Global Poultry Volume K Forecast, by Type 2020 & 2033
- Table 23: Global Poultry Revenue billion Forecast, by Country 2020 & 2033
- Table 24: Global Poultry Volume K Forecast, by Country 2020 & 2033
- Table 25: Brazil Poultry Revenue (billion) Forecast, by Application 2020 & 2033
- Table 26: Brazil Poultry Volume (K) Forecast, by Application 2020 & 2033
- Table 27: Argentina Poultry Revenue (billion) Forecast, by Application 2020 & 2033
- Table 28: Argentina Poultry Volume (K) Forecast, by Application 2020 & 2033
- Table 29: Rest of South America Poultry Revenue (billion) Forecast, by Application 2020 & 2033
- Table 30: Rest of South America Poultry Volume (K) Forecast, by Application 2020 & 2033
- Table 31: Global Poultry Revenue billion Forecast, by Application 2020 & 2033
- Table 32: Global Poultry Volume K Forecast, by Application 2020 & 2033
- Table 33: Global Poultry Revenue billion Forecast, by Type 2020 & 2033
- Table 34: Global Poultry Volume K Forecast, by Type 2020 & 2033
- Table 35: Global Poultry Revenue billion Forecast, by Country 2020 & 2033
- Table 36: Global Poultry Volume K Forecast, by Country 2020 & 2033
- Table 37: United Kingdom Poultry Revenue (billion) Forecast, by Application 2020 & 2033
- Table 38: United Kingdom Poultry Volume (K) Forecast, by Application 2020 & 2033
- Table 39: Germany Poultry Revenue (billion) Forecast, by Application 2020 & 2033
- Table 40: Germany Poultry Volume (K) Forecast, by Application 2020 & 2033
- Table 41: France Poultry Revenue (billion) Forecast, by Application 2020 & 2033
- Table 42: France Poultry Volume (K) Forecast, by Application 2020 & 2033
- Table 43: Italy Poultry Revenue (billion) Forecast, by Application 2020 & 2033
- Table 44: Italy Poultry Volume (K) Forecast, by Application 2020 & 2033
- Table 45: Spain Poultry Revenue (billion) Forecast, by Application 2020 & 2033
- Table 46: Spain Poultry Volume (K) Forecast, by Application 2020 & 2033
- Table 47: Russia Poultry Revenue (billion) Forecast, by Application 2020 & 2033
- Table 48: Russia Poultry Volume (K) Forecast, by Application 2020 & 2033
- Table 49: Benelux Poultry Revenue (billion) Forecast, by Application 2020 & 2033
- Table 50: Benelux Poultry Volume (K) Forecast, by Application 2020 & 2033
- Table 51: Nordics Poultry Revenue (billion) Forecast, by Application 2020 & 2033
- Table 52: Nordics Poultry Volume (K) Forecast, by Application 2020 & 2033
- Table 53: Rest of Europe Poultry Revenue (billion) Forecast, by Application 2020 & 2033
- Table 54: Rest of Europe Poultry Volume (K) Forecast, by Application 2020 & 2033
- Table 55: Global Poultry Revenue billion Forecast, by Application 2020 & 2033
- Table 56: Global Poultry Volume K Forecast, by Application 2020 & 2033
- Table 57: Global Poultry Revenue billion Forecast, by Type 2020 & 2033
- Table 58: Global Poultry Volume K Forecast, by Type 2020 & 2033
- Table 59: Global Poultry Revenue billion Forecast, by Country 2020 & 2033
- Table 60: Global Poultry Volume K Forecast, by Country 2020 & 2033
- Table 61: Turkey Poultry Revenue (billion) Forecast, by Application 2020 & 2033
- Table 62: Turkey Poultry Volume (K) Forecast, by Application 2020 & 2033
- Table 63: Israel Poultry Revenue (billion) Forecast, by Application 2020 & 2033
- Table 64: Israel Poultry Volume (K) Forecast, by Application 2020 & 2033
- Table 65: GCC Poultry Revenue (billion) Forecast, by Application 2020 & 2033
- Table 66: GCC Poultry Volume (K) Forecast, by Application 2020 & 2033
- Table 67: North Africa Poultry Revenue (billion) Forecast, by Application 2020 & 2033
- Table 68: North Africa Poultry Volume (K) Forecast, by Application 2020 & 2033
- Table 69: South Africa Poultry Revenue (billion) Forecast, by Application 2020 & 2033
- Table 70: South Africa Poultry Volume (K) Forecast, by Application 2020 & 2033
- Table 71: Rest of Middle East & Africa Poultry Revenue (billion) Forecast, by Application 2020 & 2033
- Table 72: Rest of Middle East & Africa Poultry Volume (K) Forecast, by Application 2020 & 2033
- Table 73: Global Poultry Revenue billion Forecast, by Application 2020 & 2033
- Table 74: Global Poultry Volume K Forecast, by Application 2020 & 2033
- Table 75: Global Poultry Revenue billion Forecast, by Type 2020 & 2033
- Table 76: Global Poultry Volume K Forecast, by Type 2020 & 2033
- Table 77: Global Poultry Revenue billion Forecast, by Country 2020 & 2033
- Table 78: Global Poultry Volume K Forecast, by Country 2020 & 2033
- Table 79: China Poultry Revenue (billion) Forecast, by Application 2020 & 2033
- Table 80: China Poultry Volume (K) Forecast, by Application 2020 & 2033
- Table 81: India Poultry Revenue (billion) Forecast, by Application 2020 & 2033
- Table 82: India Poultry Volume (K) Forecast, by Application 2020 & 2033
- Table 83: Japan Poultry Revenue (billion) Forecast, by Application 2020 & 2033
- Table 84: Japan Poultry Volume (K) Forecast, by Application 2020 & 2033
- Table 85: South Korea Poultry Revenue (billion) Forecast, by Application 2020 & 2033
- Table 86: South Korea Poultry Volume (K) Forecast, by Application 2020 & 2033
- Table 87: ASEAN Poultry Revenue (billion) Forecast, by Application 2020 & 2033
- Table 88: ASEAN Poultry Volume (K) Forecast, by Application 2020 & 2033
- Table 89: Oceania Poultry Revenue (billion) Forecast, by Application 2020 & 2033
- Table 90: Oceania Poultry Volume (K) Forecast, by Application 2020 & 2033
- Table 91: Rest of Asia Pacific Poultry Revenue (billion) Forecast, by Application 2020 & 2033
- Table 92: Rest of Asia Pacific Poultry Volume (K) Forecast, by Application 2020 & 2033
Frequently Asked Questions
1. What is the projected Compound Annual Growth Rate (CAGR) of the Poultry?
The projected CAGR is approximately 13.8%.
2. Which companies are prominent players in the Poultry?
Key companies in the market include JBS, Tyson Foods, CP Group, Wens Foodstuff Group, Sanderson Farms, Industrias Bachoco, Koch Foods, BRF, New Hope Liuhe, Perdue Farms, Cargill, Hormel Foods, PHW, Cal-Maine Foods, OSI Group, Rose Acre Farms, Hendrix Genetics, Grimaud, Nutreco, Hunan Xiangjia, Wellhope, Sunner.
3. What are the main segments of the Poultry?
The market segments include Application, Type.
4. Can you provide details about the market size?
The market size is estimated to be USD 4.29 billion as of 2022.
5. What are some drivers contributing to market growth?
N/A
6. What are the notable trends driving market growth?
N/A
7. Are there any restraints impacting market growth?
N/A
8. Can you provide examples of recent developments in the market?
N/A
9. What pricing options are available for accessing the report?
Pricing options include single-user, multi-user, and enterprise licenses priced at USD 3950.00, USD 5925.00, and USD 7900.00 respectively.
10. Is the market size provided in terms of value or volume?
The market size is provided in terms of value, measured in billion and volume, measured in K.
11. Are there any specific market keywords associated with the report?
Yes, the market keyword associated with the report is "Poultry," which aids in identifying and referencing the specific market segment covered.
12. How do I determine which pricing option suits my needs best?
The pricing options vary based on user requirements and access needs. Individual users may opt for single-user licenses, while businesses requiring broader access may choose multi-user or enterprise licenses for cost-effective access to the report.
13. Are there any additional resources or data provided in the Poultry report?
While the report offers comprehensive insights, it's advisable to review the specific contents or supplementary materials provided to ascertain if additional resources or data are available.
14. How can I stay updated on further developments or reports in the Poultry?
To stay informed about further developments, trends, and reports in the Poultry, consider subscribing to industry newsletters, following relevant companies and organizations, or regularly checking reputable industry news sources and publications.
Methodology
Step 1 - Identification of Relevant Samples Size from Population Database


Step 2 - Approaches for Defining Global Market Size (Value, Volume* & Price*)

Note*: In applicable scenarios
Step 3 - Data Sources
Primary Research
- Web Analytics
- Survey Reports
- Research Institute
- Latest Research Reports
- Opinion Leaders
Secondary Research
- Annual Reports
- White Paper
- Latest Press Release
- Industry Association
- Paid Database
- Investor Presentations

Step 4 - Data Triangulation
Involves using different sources of information in order to increase the validity of a study
These sources are likely to be stakeholders in a program - participants, other researchers, program staff, other community members, and so on.
Then we put all data in single framework & apply various statistical tools to find out the dynamic on the market.
During the analysis stage, feedback from the stakeholder groups would be compared to determine areas of agreement as well as areas of divergence