

Key Insights
The global Precision Agriculture Systems market is poised for significant expansion, projected to reach an estimated market size of USD 12,270 million by 2025 and grow at a robust Compound Annual Growth Rate (CAGR) of 11.9% through 2033. This impressive trajectory is fueled by an increasing global demand for food production, coupled with the critical need for optimizing agricultural resource utilization and minimizing environmental impact. Farmers worldwide are increasingly recognizing the substantial benefits offered by precision agriculture, including enhanced crop yields, reduced input costs for water, fertilizers, and pesticides, and improved overall farm management efficiency. The drive towards sustainable farming practices and the growing adoption of smart farming technologies are key catalysts propelling this market forward. Furthermore, government initiatives promoting modern agricultural practices and technological advancements in areas like IoT, AI, and cloud computing are creating a fertile ground for the widespread adoption of precision agriculture solutions.
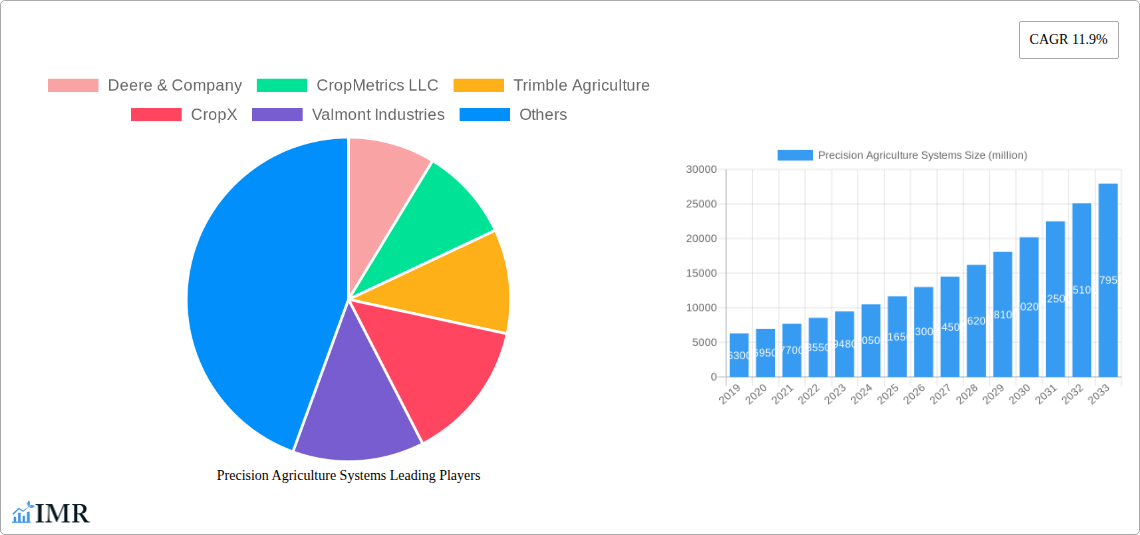
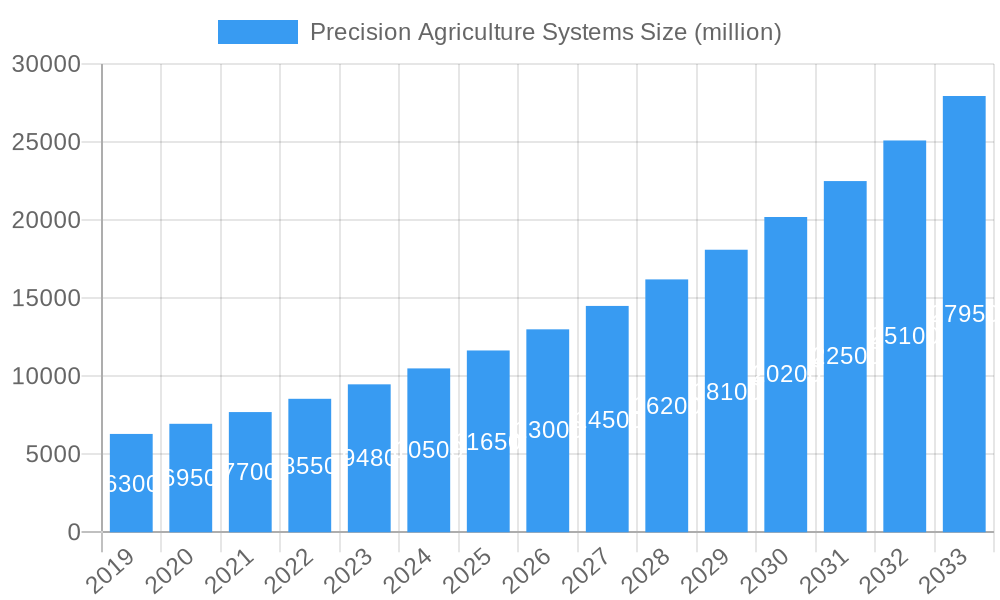
Precision Agriculture Systems Market Size (In Billion)
The market is segmented into key applications, with Farmland & Farms representing a dominant segment due to its direct application in day-to-day farming operations. Agricultural Cooperatives also present a significant growth avenue as they increasingly invest in collective technological solutions to benefit their members. Within the technology types, Guidance Systems are widely adopted for their ability to optimize field operations and reduce overlaps, leading to significant cost savings. Remote Sensing technologies are gaining traction for their capacity to provide valuable insights into crop health and soil conditions, enabling data-driven decision-making. Variable-Rate Technology (VRT) is also a crucial component, allowing for precise application of inputs based on site-specific needs. Key industry players like Deere & Company, Trimble Agriculture, and AGCO Corporation are at the forefront, continuously innovating and expanding their product portfolios to cater to the evolving needs of the agricultural sector. The market's growth is further supported by the strategic collaborations and acquisitions undertaken by these companies to enhance their market presence and technological capabilities across diverse geographical regions.
Precision Agriculture Systems Company Market Share
Precision Agriculture Systems Market Dynamics & Structure
The global Precision Agriculture Systems market exhibits a moderately concentrated structure, with key players like Deere & Company, Trimble Agriculture, and CNH Industrial holding significant influence. Technological innovation serves as a primary driver, fueled by advancements in IoT, AI, machine learning, and satellite imagery. Regulatory frameworks, particularly those promoting sustainable farming practices and data privacy, are shaping adoption. Competitive product substitutes are emerging from traditional agricultural equipment manufacturers integrating smart technologies and specialized tech startups. End-user demographics are shifting towards tech-savvy farmers and large agricultural cooperatives seeking to optimize yields, reduce input costs, and enhance environmental stewardship. Mergers and acquisitions (M&A) are moderately active, with companies acquiring innovative technologies or expanding their market reach. For instance, the M&A deal volume averaged approximately 12 deals per year between 2019 and 2024, with an estimated deal value of $150 million annually. Key innovation barriers include the high upfront cost of some systems and the need for farmer education and training.
- Market Concentration: Moderate, with dominant players and emerging innovative startups.
- Technological Innovation Drivers: IoT, AI, Machine Learning, Satellite Imagery, Drones, Sensor Technology.
- Regulatory Frameworks: Environmental regulations, data ownership policies, and subsidies for sustainable agriculture.
- Competitive Product Substitutes: Integrated smart farming solutions from traditional manufacturers, DIY sensor networks.
- End-User Demographics: Progressive farmers, large commercial farms, agricultural cooperatives, government agricultural agencies.
- M&A Trends: Strategic acquisitions of technology companies, consolidation for market share.
Precision Agriculture Systems Growth Trends & Insights
The Precision Agriculture Systems market is poised for robust growth, driven by an escalating global demand for food security and the imperative for sustainable agricultural practices. Market size evolution is projected to be significant, with the global precision agriculture market estimated to reach approximately $25,000 million in 2025 and expand at a Compound Annual Growth Rate (CAGR) of 12.5% during the forecast period of 2025–2033. Adoption rates are accelerating, particularly in developed agricultural economies, as farmers recognize the tangible benefits of data-driven decision-making. Technological disruptions, including the proliferation of autonomous farming equipment, advanced drone-based monitoring, and sophisticated AI-powered analytics platforms, are fundamentally transforming farming operations. Consumer behavior shifts are also influencing the market, with increasing demand for ethically and sustainably produced food products, pushing farmers towards more efficient and environmentally conscious methods. The penetration of Variable-Rate Technology (VRT) is expected to cross 40% by 2030, a testament to its growing acceptance.
The integration of remote sensing technologies, such as satellite imagery and LiDAR, allows for real-time monitoring of crop health, soil conditions, and pest infestations, enabling precise interventions and minimizing resource wastage. This translates directly into reduced application of fertilizers, pesticides, and water, leading to significant cost savings for farmers and a minimized environmental footprint. Guidance systems are becoming increasingly sophisticated, offering sub-centimeter accuracy for planting, spraying, and harvesting, thereby optimizing operational efficiency and reducing overlaps or skips. The increasing affordability and accessibility of these technologies, coupled with supportive government initiatives and financial incentives, are further fueling market penetration. The younger generation of farmers, often more digitally native and open to adopting new technologies, is also playing a crucial role in driving adoption. The development of user-friendly interfaces and comprehensive support services is addressing previous adoption barriers related to complexity and technical expertise. The predicted market size for guidance systems alone is expected to exceed $8,000 million by 2030.
Dominant Regions, Countries, or Segments in Precision Agriculture Systems
The Farmland & Farms segment, under the Application classification, is the dominant force driving the global Precision Agriculture Systems market. This dominance is attributed to the sheer scale of agricultural operations worldwide, where the need for optimizing yields, managing resources efficiently, and ensuring profitability is paramount. Farmers managing extensive farmlands represent the largest user base, directly benefiting from the cost savings and productivity gains offered by precision agriculture technologies. The adoption within this segment is further propelled by economic policies aimed at enhancing agricultural productivity and sustainability, coupled with the availability of advanced infrastructure that supports the deployment and connectivity of these systems.
North America, particularly the United States, stands out as the leading country within this dominant segment. This leadership is characterized by a strong agricultural base, high levels of technological adoption, significant investment in R&D, and favorable government support for precision farming initiatives. The market share held by Farmland & Farms is estimated to be around 65% of the total precision agriculture systems market. Key drivers within this segment include the need to manage large-scale monocultures, the presence of progressive farming communities eager to adopt new technologies, and robust support from agricultural equipment manufacturers and technology providers.
Within the Type segment, Guidance Systems are experiencing significant growth, contributing substantially to the overall market expansion. These systems, including GPS auto-steering, row guidance, and contour farming capabilities, directly enhance operational efficiency during critical farming operations like planting, spraying, and harvesting. Their market share is projected to reach approximately 45% of the total market by 2030. Economic policies that encourage efficient land use and reduce fuel consumption also indirectly boost the adoption of guidance systems. The growth potential for guidance systems is further amplified by the increasing sophistication of autonomous farming equipment, where precise guidance is a foundational element.
- Dominant Application Segment: Farmland & Farms
- Key Drivers: Large-scale operations, need for yield optimization, resource management, profitability enhancement.
- Market Share: Approximately 65% of the total market.
- Growth Potential: High, driven by continuous need for efficiency and sustainability.
- Leading Country: United States (within North America)
- Dominance Factors: Strong agricultural sector, high technological adoption, R&D investment, government support.
- Infrastructure: Well-developed agricultural infrastructure supporting precision tech.
- Dominant Type Segment: Guidance System
- Key Drivers: Improved operational efficiency, reduced overlaps and skips, compatibility with autonomous systems, fuel savings.
- Market Share: Projected to reach 45% by 2030.
- Growth Potential: Strong, linked to automation trends.
Precision Agriculture Systems Product Landscape
The precision agriculture systems product landscape is characterized by a continuous influx of innovative solutions designed to enhance farm efficiency and sustainability. From advanced GPS guidance systems offering sub-centimeter accuracy for precise planting and spraying, to sophisticated remote sensing technologies like multispectral cameras and LiDAR for detailed crop health monitoring, the offerings are diverse. Variable-Rate Technology (VRT) controllers enable precise application of fertilizers, water, and pesticides based on real-time soil data, minimizing waste and maximizing effectiveness. Emerging products include AI-powered analytics platforms that interpret vast datasets to provide actionable insights on pest detection, disease prediction, and optimal harvest timing.
- Key Innovations: Autonomous tractors, drone-based spraying and imaging, AI-driven farm management software, soil moisture sensors, and weather stations.
- Performance Metrics: Increased yield by up to 20%, reduced input costs by 15-30%, improved water efficiency by 25%, enhanced crop quality.
- Unique Selling Propositions: Data-driven decision making, real-time monitoring and control, resource optimization, reduced environmental impact.
Key Drivers, Barriers & Challenges in Precision Agriculture Systems
The Precision Agriculture Systems market is propelled by several key drivers, most notably the escalating global demand for increased food production to feed a growing population. Technological advancements in sensors, data analytics, IoT, and AI are making these systems more sophisticated, accessible, and cost-effective. Furthermore, a growing awareness of environmental sustainability and the need for resource conservation are compelling farmers to adopt practices that minimize water usage, fertilizer runoff, and pesticide application. Government initiatives and subsidies aimed at promoting modern agricultural techniques also play a significant role.
However, the market faces notable barriers and challenges. The high initial investment cost for some precision agriculture technologies remains a significant hurdle for small to medium-sized farms. The need for technical expertise and adequate training to operate and maintain these complex systems can also deter adoption. Connectivity issues in rural areas, data privacy concerns, and the interoperability of different systems are additional challenges that need to be addressed for widespread market penetration. Supply chain disruptions and the availability of skilled labor to implement and support these technologies are also ongoing concerns.
Emerging Opportunities in Precision Agriculture Systems
Emerging opportunities in the Precision Agriculture Systems sector lie in the integration of AI and machine learning for predictive analytics, enabling farmers to forecast yield potential, disease outbreaks, and optimal planting/harvesting times with unprecedented accuracy. The expansion of the drone market for advanced crop monitoring, spraying, and even targeted pollination presents a significant growth avenue. Furthermore, the development of more affordable and user-friendly IoT-enabled sensors for real-time soil and weather data collection in smaller farm settings will unlock new market segments. The increasing demand for transparent and traceable food supply chains also presents an opportunity for precision agriculture data to be leveraged for provenance tracking.
Growth Accelerators in the Precision Agriculture Systems Industry
The long-term growth of the Precision Agriculture Systems industry is significantly accelerated by continuous technological breakthroughs, particularly in the fields of artificial intelligence, machine learning, and robotics. Strategic partnerships between established agricultural equipment manufacturers and innovative tech startups are crucial for faster product development and market penetration. Market expansion strategies focusing on emerging economies with rapidly growing agricultural sectors and increasing government support for modernization will further fuel growth. The development of integrated farm management platforms that consolidate data from various precision agriculture tools into a single, user-friendly interface is also a key accelerator, simplifying adoption and enhancing value for farmers.
Key Players Shaping the Precision Agriculture Systems Market
- Deere & Company
- CropMetrics LLC
- Trimble Agriculture
- CropX
- Valmont Industries
- AGCO Corporation
- Dickey-Dick Corporation
- Monsanto Company (Bayer AG)
- Ag Leader Technology
- AgJunction
- CNH Industrial
- Raven Industries
- SST (Proagrica)
- TeeJet Technologies
- Topcon Positioning Systems
Notable Milestones in Precision Agriculture Systems Sector
- 2019: Launch of advanced AI-powered yield prediction models by several ag-tech startups.
- 2020: Increased adoption of drone technology for precision spraying and field mapping due to efficiency gains.
- 2021: Significant investments in sensor technology for real-time soil and weather monitoring.
- 2022: Merger of key players to consolidate market share and expand product portfolios (e.g., Bayer's acquisition of Monsanto's digital farming assets).
- 2023: Introduction of more integrated and user-friendly precision agriculture platforms, focusing on data analytics.
- 2024: Enhanced focus on autonomous farming solutions and robotics in precision agriculture development.
In-Depth Precision Agriculture Systems Market Outlook
The future of the Precision Agriculture Systems market is exceptionally bright, driven by an ongoing commitment to sustainable food production and technological innovation. Growth accelerators such as advancements in AI for predictive analytics, the expanding capabilities of drone technology, and the development of affordable IoT sensors will continue to unlock new opportunities across diverse agricultural landscapes. Strategic partnerships and market expansion into developing regions with substantial agricultural potential are poised to significantly contribute to market growth. The emergence of comprehensive, integrated farm management platforms will further simplify adoption and maximize the value proposition for farmers, solidifying precision agriculture as an indispensable component of modern, efficient, and environmentally responsible farming for years to come.
Precision Agriculture Systems Segmentation
-
1. Application
- 1.1. Farmland & Farms
- 1.2. Agricultural Cooperatives
- 1.3. Others
-
2. Type
- 2.1. Guidance System
- 2.2. Remote Sensing
- 2.3. Variable-Rate Technology
Precision Agriculture Systems Segmentation By Geography
-
1. North America
- 1.1. United States
- 1.2. Canada
- 1.3. Mexico
-
2. South America
- 2.1. Brazil
- 2.2. Argentina
- 2.3. Rest of South America
-
3. Europe
- 3.1. United Kingdom
- 3.2. Germany
- 3.3. France
- 3.4. Italy
- 3.5. Spain
- 3.6. Russia
- 3.7. Benelux
- 3.8. Nordics
- 3.9. Rest of Europe
-
4. Middle East & Africa
- 4.1. Turkey
- 4.2. Israel
- 4.3. GCC
- 4.4. North Africa
- 4.5. South Africa
- 4.6. Rest of Middle East & Africa
-
5. Asia Pacific
- 5.1. China
- 5.2. India
- 5.3. Japan
- 5.4. South Korea
- 5.5. ASEAN
- 5.6. Oceania
- 5.7. Rest of Asia Pacific
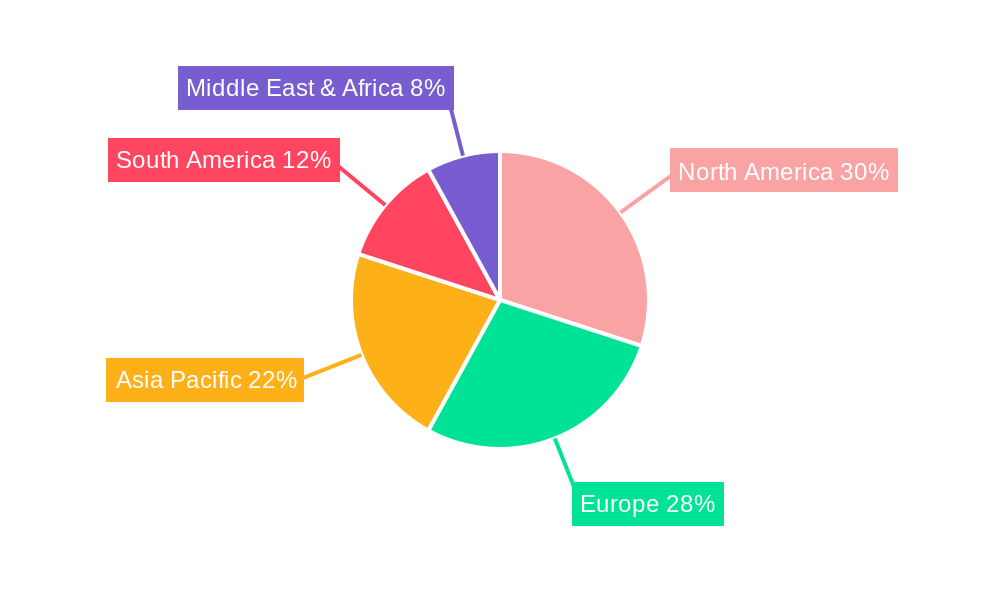
Precision Agriculture Systems Regional Market Share
Geographic Coverage of Precision Agriculture Systems
Precision Agriculture Systems REPORT HIGHLIGHTS
| Aspects | Details |
|---|---|
| Study Period | 2020-2034 |
| Base Year | 2025 |
| Estimated Year | 2026 |
| Forecast Period | 2026-2034 |
| Historical Period | 2020-2025 |
| Growth Rate | CAGR of 11.9% from 2020-2034 |
| Segmentation |
|
Table of Contents
- 1. Introduction
- 1.1. Research Scope
- 1.2. Market Segmentation
- 1.3. Research Objective
- 1.4. Definitions and Assumptions
- 2. Executive Summary
- 2.1. Market Snapshot
- 3. Market Dynamics
- 3.1. Market Drivers
- 3.2. Market Restrains
- 3.3. Market Trends
- 3.4. Market Opportunities
- 4. Market Factor Analysis
- 4.1. Porters Five Forces
- 4.1.1. Bargaining Power of Suppliers
- 4.1.2. Bargaining Power of Buyers
- 4.1.3. Threat of New Entrants
- 4.1.4. Threat of Substitutes
- 4.1.5. Competitive Rivalry
- 4.2. PESTEL analysis
- 4.3. BCG Analysis
- 4.3.1. Stars (High Growth, High Market Share)
- 4.3.2. Cash Cows (Low Growth, High Market Share)
- 4.3.3. Question Mark (High Growth, Low Market Share)
- 4.3.4. Dogs (Low Growth, Low Market Share)
- 4.4. Ansoff Matrix Analysis
- 4.5. Supply Chain Analysis
- 4.6. Regulatory Landscape
- 4.7. Current Market Potential and Opportunity Assessment (TAM–SAM–SOM Framework)
- 4.8. IMR Analyst Note
- 4.1. Porters Five Forces
- 5. Market Analysis, Insights and Forecast 2021-2033
- 5.1. Market Analysis, Insights and Forecast - by Application
- 5.1.1. Farmland & Farms
- 5.1.2. Agricultural Cooperatives
- 5.1.3. Others
- 5.2. Market Analysis, Insights and Forecast - by Type
- 5.2.1. Guidance System
- 5.2.2. Remote Sensing
- 5.2.3. Variable-Rate Technology
- 5.3. Market Analysis, Insights and Forecast - by Region
- 5.3.1. North America
- 5.3.2. South America
- 5.3.3. Europe
- 5.3.4. Middle East & Africa
- 5.3.5. Asia Pacific
- 5.1. Market Analysis, Insights and Forecast - by Application
- 6. Global Precision Agriculture Systems Analysis, Insights and Forecast, 2021-2033
- 6.1. Market Analysis, Insights and Forecast - by Application
- 6.1.1. Farmland & Farms
- 6.1.2. Agricultural Cooperatives
- 6.1.3. Others
- 6.2. Market Analysis, Insights and Forecast - by Type
- 6.2.1. Guidance System
- 6.2.2. Remote Sensing
- 6.2.3. Variable-Rate Technology
- 6.1. Market Analysis, Insights and Forecast - by Application
- 7. North America Precision Agriculture Systems Analysis, Insights and Forecast, 2020-2032
- 7.1. Market Analysis, Insights and Forecast - by Application
- 7.1.1. Farmland & Farms
- 7.1.2. Agricultural Cooperatives
- 7.1.3. Others
- 7.2. Market Analysis, Insights and Forecast - by Type
- 7.2.1. Guidance System
- 7.2.2. Remote Sensing
- 7.2.3. Variable-Rate Technology
- 7.1. Market Analysis, Insights and Forecast - by Application
- 8. South America Precision Agriculture Systems Analysis, Insights and Forecast, 2020-2032
- 8.1. Market Analysis, Insights and Forecast - by Application
- 8.1.1. Farmland & Farms
- 8.1.2. Agricultural Cooperatives
- 8.1.3. Others
- 8.2. Market Analysis, Insights and Forecast - by Type
- 8.2.1. Guidance System
- 8.2.2. Remote Sensing
- 8.2.3. Variable-Rate Technology
- 8.1. Market Analysis, Insights and Forecast - by Application
- 9. Europe Precision Agriculture Systems Analysis, Insights and Forecast, 2020-2032
- 9.1. Market Analysis, Insights and Forecast - by Application
- 9.1.1. Farmland & Farms
- 9.1.2. Agricultural Cooperatives
- 9.1.3. Others
- 9.2. Market Analysis, Insights and Forecast - by Type
- 9.2.1. Guidance System
- 9.2.2. Remote Sensing
- 9.2.3. Variable-Rate Technology
- 9.1. Market Analysis, Insights and Forecast - by Application
- 10. Middle East & Africa Precision Agriculture Systems Analysis, Insights and Forecast, 2020-2032
- 10.1. Market Analysis, Insights and Forecast - by Application
- 10.1.1. Farmland & Farms
- 10.1.2. Agricultural Cooperatives
- 10.1.3. Others
- 10.2. Market Analysis, Insights and Forecast - by Type
- 10.2.1. Guidance System
- 10.2.2. Remote Sensing
- 10.2.3. Variable-Rate Technology
- 10.1. Market Analysis, Insights and Forecast - by Application
- 11. Asia Pacific Precision Agriculture Systems Analysis, Insights and Forecast, 2020-2032
- 11.1. Market Analysis, Insights and Forecast - by Application
- 11.1.1. Farmland & Farms
- 11.1.2. Agricultural Cooperatives
- 11.1.3. Others
- 11.2. Market Analysis, Insights and Forecast - by Type
- 11.2.1. Guidance System
- 11.2.2. Remote Sensing
- 11.2.3. Variable-Rate Technology
- 11.1. Market Analysis, Insights and Forecast - by Application
- 12. Competitive Analysis
- 12.1. Company Profiles
- 12.1.1 Deere & Company
- 12.1.1.1. Company Overview
- 12.1.1.2. Products
- 12.1.1.3. Company Financials
- 12.1.1.4. SWOT Analysis
- 12.1.2 CropMetrics LLC
- 12.1.2.1. Company Overview
- 12.1.2.2. Products
- 12.1.2.3. Company Financials
- 12.1.2.4. SWOT Analysis
- 12.1.3 Trimble Agriculture
- 12.1.3.1. Company Overview
- 12.1.3.2. Products
- 12.1.3.3. Company Financials
- 12.1.3.4. SWOT Analysis
- 12.1.4 CropX
- 12.1.4.1. Company Overview
- 12.1.4.2. Products
- 12.1.4.3. Company Financials
- 12.1.4.4. SWOT Analysis
- 12.1.5 Valmont Industries
- 12.1.5.1. Company Overview
- 12.1.5.2. Products
- 12.1.5.3. Company Financials
- 12.1.5.4. SWOT Analysis
- 12.1.6 AGCO Corporation
- 12.1.6.1. Company Overview
- 12.1.6.2. Products
- 12.1.6.3. Company Financials
- 12.1.6.4. SWOT Analysis
- 12.1.7 Dickey-John Corporation
- 12.1.7.1. Company Overview
- 12.1.7.2. Products
- 12.1.7.3. Company Financials
- 12.1.7.4. SWOT Analysis
- 12.1.8 Monsanto Company
- 12.1.8.1. Company Overview
- 12.1.8.2. Products
- 12.1.8.3. Company Financials
- 12.1.8.4. SWOT Analysis
- 12.1.9 Ag Leader Technology
- 12.1.9.1. Company Overview
- 12.1.9.2. Products
- 12.1.9.3. Company Financials
- 12.1.9.4. SWOT Analysis
- 12.1.10 AgJunction
- 12.1.10.1. Company Overview
- 12.1.10.2. Products
- 12.1.10.3. Company Financials
- 12.1.10.4. SWOT Analysis
- 12.1.11 CNH Industrial
- 12.1.11.1. Company Overview
- 12.1.11.2. Products
- 12.1.11.3. Company Financials
- 12.1.11.4. SWOT Analysis
- 12.1.12 Raven Industries
- 12.1.12.1. Company Overview
- 12.1.12.2. Products
- 12.1.12.3. Company Financials
- 12.1.12.4. SWOT Analysis
- 12.1.13 SST (Proagrica)
- 12.1.13.1. Company Overview
- 12.1.13.2. Products
- 12.1.13.3. Company Financials
- 12.1.13.4. SWOT Analysis
- 12.1.14 TeeJet Technologies
- 12.1.14.1. Company Overview
- 12.1.14.2. Products
- 12.1.14.3. Company Financials
- 12.1.14.4. SWOT Analysis
- 12.1.15 Topcon Positioning Systems
- 12.1.15.1. Company Overview
- 12.1.15.2. Products
- 12.1.15.3. Company Financials
- 12.1.15.4. SWOT Analysis
- 12.1.1 Deere & Company
- 12.2. Market Entropy
- 12.2.1 Company's Key Areas Served
- 12.2.2 Recent Developments
- 12.3. Company Market Share Analysis 2025
- 12.3.1 Top 5 Companies Market Share Analysis
- 12.3.2 Top 3 Companies Market Share Analysis
- 12.4. List of Potential Customers
- 13. Research Methodology
List of Figures
- Figure 1: Global Precision Agriculture Systems Revenue Breakdown (million, %) by Region 2025 & 2033
- Figure 2: North America Precision Agriculture Systems Revenue (million), by Application 2025 & 2033
- Figure 3: North America Precision Agriculture Systems Revenue Share (%), by Application 2025 & 2033
- Figure 4: North America Precision Agriculture Systems Revenue (million), by Type 2025 & 2033
- Figure 5: North America Precision Agriculture Systems Revenue Share (%), by Type 2025 & 2033
- Figure 6: North America Precision Agriculture Systems Revenue (million), by Country 2025 & 2033
- Figure 7: North America Precision Agriculture Systems Revenue Share (%), by Country 2025 & 2033
- Figure 8: South America Precision Agriculture Systems Revenue (million), by Application 2025 & 2033
- Figure 9: South America Precision Agriculture Systems Revenue Share (%), by Application 2025 & 2033
- Figure 10: South America Precision Agriculture Systems Revenue (million), by Type 2025 & 2033
- Figure 11: South America Precision Agriculture Systems Revenue Share (%), by Type 2025 & 2033
- Figure 12: South America Precision Agriculture Systems Revenue (million), by Country 2025 & 2033
- Figure 13: South America Precision Agriculture Systems Revenue Share (%), by Country 2025 & 2033
- Figure 14: Europe Precision Agriculture Systems Revenue (million), by Application 2025 & 2033
- Figure 15: Europe Precision Agriculture Systems Revenue Share (%), by Application 2025 & 2033
- Figure 16: Europe Precision Agriculture Systems Revenue (million), by Type 2025 & 2033
- Figure 17: Europe Precision Agriculture Systems Revenue Share (%), by Type 2025 & 2033
- Figure 18: Europe Precision Agriculture Systems Revenue (million), by Country 2025 & 2033
- Figure 19: Europe Precision Agriculture Systems Revenue Share (%), by Country 2025 & 2033
- Figure 20: Middle East & Africa Precision Agriculture Systems Revenue (million), by Application 2025 & 2033
- Figure 21: Middle East & Africa Precision Agriculture Systems Revenue Share (%), by Application 2025 & 2033
- Figure 22: Middle East & Africa Precision Agriculture Systems Revenue (million), by Type 2025 & 2033
- Figure 23: Middle East & Africa Precision Agriculture Systems Revenue Share (%), by Type 2025 & 2033
- Figure 24: Middle East & Africa Precision Agriculture Systems Revenue (million), by Country 2025 & 2033
- Figure 25: Middle East & Africa Precision Agriculture Systems Revenue Share (%), by Country 2025 & 2033
- Figure 26: Asia Pacific Precision Agriculture Systems Revenue (million), by Application 2025 & 2033
- Figure 27: Asia Pacific Precision Agriculture Systems Revenue Share (%), by Application 2025 & 2033
- Figure 28: Asia Pacific Precision Agriculture Systems Revenue (million), by Type 2025 & 2033
- Figure 29: Asia Pacific Precision Agriculture Systems Revenue Share (%), by Type 2025 & 2033
- Figure 30: Asia Pacific Precision Agriculture Systems Revenue (million), by Country 2025 & 2033
- Figure 31: Asia Pacific Precision Agriculture Systems Revenue Share (%), by Country 2025 & 2033
List of Tables
- Table 1: Global Precision Agriculture Systems Revenue million Forecast, by Application 2020 & 2033
- Table 2: Global Precision Agriculture Systems Revenue million Forecast, by Type 2020 & 2033
- Table 3: Global Precision Agriculture Systems Revenue million Forecast, by Region 2020 & 2033
- Table 4: Global Precision Agriculture Systems Revenue million Forecast, by Application 2020 & 2033
- Table 5: Global Precision Agriculture Systems Revenue million Forecast, by Type 2020 & 2033
- Table 6: Global Precision Agriculture Systems Revenue million Forecast, by Country 2020 & 2033
- Table 7: United States Precision Agriculture Systems Revenue (million) Forecast, by Application 2020 & 2033
- Table 8: Canada Precision Agriculture Systems Revenue (million) Forecast, by Application 2020 & 2033
- Table 9: Mexico Precision Agriculture Systems Revenue (million) Forecast, by Application 2020 & 2033
- Table 10: Global Precision Agriculture Systems Revenue million Forecast, by Application 2020 & 2033
- Table 11: Global Precision Agriculture Systems Revenue million Forecast, by Type 2020 & 2033
- Table 12: Global Precision Agriculture Systems Revenue million Forecast, by Country 2020 & 2033
- Table 13: Brazil Precision Agriculture Systems Revenue (million) Forecast, by Application 2020 & 2033
- Table 14: Argentina Precision Agriculture Systems Revenue (million) Forecast, by Application 2020 & 2033
- Table 15: Rest of South America Precision Agriculture Systems Revenue (million) Forecast, by Application 2020 & 2033
- Table 16: Global Precision Agriculture Systems Revenue million Forecast, by Application 2020 & 2033
- Table 17: Global Precision Agriculture Systems Revenue million Forecast, by Type 2020 & 2033
- Table 18: Global Precision Agriculture Systems Revenue million Forecast, by Country 2020 & 2033
- Table 19: United Kingdom Precision Agriculture Systems Revenue (million) Forecast, by Application 2020 & 2033
- Table 20: Germany Precision Agriculture Systems Revenue (million) Forecast, by Application 2020 & 2033
- Table 21: France Precision Agriculture Systems Revenue (million) Forecast, by Application 2020 & 2033
- Table 22: Italy Precision Agriculture Systems Revenue (million) Forecast, by Application 2020 & 2033
- Table 23: Spain Precision Agriculture Systems Revenue (million) Forecast, by Application 2020 & 2033
- Table 24: Russia Precision Agriculture Systems Revenue (million) Forecast, by Application 2020 & 2033
- Table 25: Benelux Precision Agriculture Systems Revenue (million) Forecast, by Application 2020 & 2033
- Table 26: Nordics Precision Agriculture Systems Revenue (million) Forecast, by Application 2020 & 2033
- Table 27: Rest of Europe Precision Agriculture Systems Revenue (million) Forecast, by Application 2020 & 2033
- Table 28: Global Precision Agriculture Systems Revenue million Forecast, by Application 2020 & 2033
- Table 29: Global Precision Agriculture Systems Revenue million Forecast, by Type 2020 & 2033
- Table 30: Global Precision Agriculture Systems Revenue million Forecast, by Country 2020 & 2033
- Table 31: Turkey Precision Agriculture Systems Revenue (million) Forecast, by Application 2020 & 2033
- Table 32: Israel Precision Agriculture Systems Revenue (million) Forecast, by Application 2020 & 2033
- Table 33: GCC Precision Agriculture Systems Revenue (million) Forecast, by Application 2020 & 2033
- Table 34: North Africa Precision Agriculture Systems Revenue (million) Forecast, by Application 2020 & 2033
- Table 35: South Africa Precision Agriculture Systems Revenue (million) Forecast, by Application 2020 & 2033
- Table 36: Rest of Middle East & Africa Precision Agriculture Systems Revenue (million) Forecast, by Application 2020 & 2033
- Table 37: Global Precision Agriculture Systems Revenue million Forecast, by Application 2020 & 2033
- Table 38: Global Precision Agriculture Systems Revenue million Forecast, by Type 2020 & 2033
- Table 39: Global Precision Agriculture Systems Revenue million Forecast, by Country 2020 & 2033
- Table 40: China Precision Agriculture Systems Revenue (million) Forecast, by Application 2020 & 2033
- Table 41: India Precision Agriculture Systems Revenue (million) Forecast, by Application 2020 & 2033
- Table 42: Japan Precision Agriculture Systems Revenue (million) Forecast, by Application 2020 & 2033
- Table 43: South Korea Precision Agriculture Systems Revenue (million) Forecast, by Application 2020 & 2033
- Table 44: ASEAN Precision Agriculture Systems Revenue (million) Forecast, by Application 2020 & 2033
- Table 45: Oceania Precision Agriculture Systems Revenue (million) Forecast, by Application 2020 & 2033
- Table 46: Rest of Asia Pacific Precision Agriculture Systems Revenue (million) Forecast, by Application 2020 & 2033
Frequently Asked Questions
1. What is the projected Compound Annual Growth Rate (CAGR) of the Precision Agriculture Systems?
The projected CAGR is approximately 11.9%.
2. Which companies are prominent players in the Precision Agriculture Systems?
Key companies in the market include Deere & Company, CropMetrics LLC, Trimble Agriculture, CropX, Valmont Industries, AGCO Corporation, Dickey-John Corporation, Monsanto Company, Ag Leader Technology, AgJunction, CNH Industrial, Raven Industries, SST (Proagrica), TeeJet Technologies, Topcon Positioning Systems.
3. What are the main segments of the Precision Agriculture Systems?
The market segments include Application, Type.
4. Can you provide details about the market size?
The market size is estimated to be USD 12270 million as of 2022.
5. What are some drivers contributing to market growth?
N/A
6. What are the notable trends driving market growth?
N/A
7. Are there any restraints impacting market growth?
N/A
8. Can you provide examples of recent developments in the market?
N/A
9. What pricing options are available for accessing the report?
Pricing options include single-user, multi-user, and enterprise licenses priced at USD 5900.00, USD 8850.00, and USD 11800.00 respectively.
10. Is the market size provided in terms of value or volume?
The market size is provided in terms of value, measured in million.
11. Are there any specific market keywords associated with the report?
Yes, the market keyword associated with the report is "Precision Agriculture Systems," which aids in identifying and referencing the specific market segment covered.
12. How do I determine which pricing option suits my needs best?
The pricing options vary based on user requirements and access needs. Individual users may opt for single-user licenses, while businesses requiring broader access may choose multi-user or enterprise licenses for cost-effective access to the report.
13. Are there any additional resources or data provided in the Precision Agriculture Systems report?
While the report offers comprehensive insights, it's advisable to review the specific contents or supplementary materials provided to ascertain if additional resources or data are available.
14. How can I stay updated on further developments or reports in the Precision Agriculture Systems?
To stay informed about further developments, trends, and reports in the Precision Agriculture Systems, consider subscribing to industry newsletters, following relevant companies and organizations, or regularly checking reputable industry news sources and publications.
Methodology
Step 1 - Identification of Relevant Samples Size from Population Database


Step 2 - Approaches for Defining Global Market Size (Value, Volume* & Price*)

Note*: In applicable scenarios
Step 3 - Data Sources
Primary Research
- Web Analytics
- Survey Reports
- Research Institute
- Latest Research Reports
- Opinion Leaders
Secondary Research
- Annual Reports
- White Paper
- Latest Press Release
- Industry Association
- Paid Database
- Investor Presentations

Step 4 - Data Triangulation
Involves using different sources of information in order to increase the validity of a study
These sources are likely to be stakeholders in a program - participants, other researchers, program staff, other community members, and so on.
Then we put all data in single framework & apply various statistical tools to find out the dynamic on the market.
During the analysis stage, feedback from the stakeholder groups would be compared to determine areas of agreement as well as areas of divergence