

Key Insights
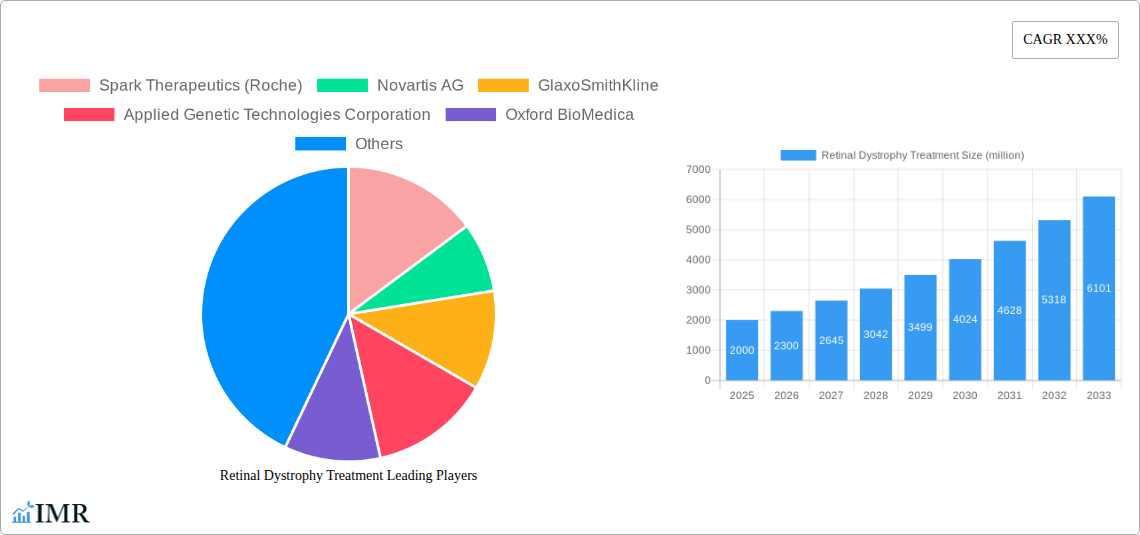
The retinal dystrophy treatment market is experiencing robust growth, driven by a rising prevalence of inherited retinal diseases, ongoing advancements in gene therapy and other innovative treatment modalities, and increased funding for research and development. The market's substantial size, currently estimated at around $2 billion in 2025, reflects the significant unmet medical need and the high cost of advanced therapies. A compound annual growth rate (CAGR) of approximately 15% is projected from 2025 to 2033, indicating a substantial expansion of the market over the forecast period. This growth is fueled by the increasing success of clinical trials for gene therapies, which offer the potential for disease modification and improved patient outcomes, a stark contrast to previous treatment limitations. Major players such as Spark Therapeutics (Roche), Novartis, and Biogen are actively shaping the market landscape through their investments in R&D and strategic partnerships. However, the high cost of these advanced therapies, the complexities of regulatory approvals, and the need for improved diagnostic tools remain significant challenges that could influence market expansion.
Despite these hurdles, the long-term outlook for the retinal dystrophy treatment market remains optimistic. The continuous influx of funding into research and the growing awareness of these debilitating diseases are driving the development of newer, more effective treatments. Further segmentation of the market based on specific disease types and treatment modalities will allow for more targeted therapies and a more precise understanding of future market growth. Ongoing clinical trials focusing on novel gene editing techniques and improved delivery methods will likely contribute to accelerated market expansion in the coming years, providing hope for patients suffering from these devastating conditions. The competitive landscape is also expected to evolve as more companies enter the market with novel therapies, leading to greater access and potentially lower treatment costs over time.
Retinal Dystrophy Treatment Market Report: 2019-2033
This comprehensive report provides a detailed analysis of the Retinal Dystrophy Treatment market, encompassing market dynamics, growth trends, regional analysis, product landscape, key players, and future outlook. The study period spans 2019-2033, with 2025 serving as the base and estimated year. The forecast period covers 2025-2033, and the historical period encompasses 2019-2024. The report caters to ophthalmologists, pharmaceutical companies, investors, and researchers interested in this rapidly evolving therapeutic area. The market is segmented by treatment type (gene therapy, cell therapy, etc.) and by retinal dystrophy subtype (retinitis pigmentosa, Stargardt disease, etc.).
Parent Market: Ophthalmic Drugs Market (Projected 2025 Value: $xx Billion) Child Market: Rare Disease Therapeutics Market (Projected 2025 Value: $xx Billion)
Retinal Dystrophy Treatment Market Dynamics & Structure
This section analyzes the market's competitive landscape, technological advancements, regulatory hurdles, and market consolidation activities. The analysis reveals a moderately concentrated market with a few major players dominating the scene, while smaller biotech firms are driving innovation.
- Market Concentration: The market exhibits a moderate concentration, with the top 5 companies holding approximately xx% of the market share in 2025.
- Technological Innovation: Gene therapy and cell-based therapies are the primary drivers of innovation, with ongoing research focused on enhancing efficacy and safety. Challenges remain in delivering effective therapies to the back of the eye.
- Regulatory Framework: Stringent regulatory approvals impact time to market. The FDA and EMA approval processes for novel therapies are lengthy and demanding.
- Competitive Product Substitutes: Limited effective treatment options currently exist, leading to significant unmet medical needs. However, future advancements in other therapeutic areas could potentially offer alternative solutions.
- End-User Demographics: The aging population and increased incidence of retinal dystrophies are major factors contributing to market growth.
- M&A Trends: The last five years have witnessed xx M&A deals within the retinal dystrophy treatment space, signaling strong industry interest and consolidation. Large pharmaceutical companies are actively acquiring smaller biotech companies with promising pipeline assets.
Retinal Dystrophy Treatment Growth Trends & Insights
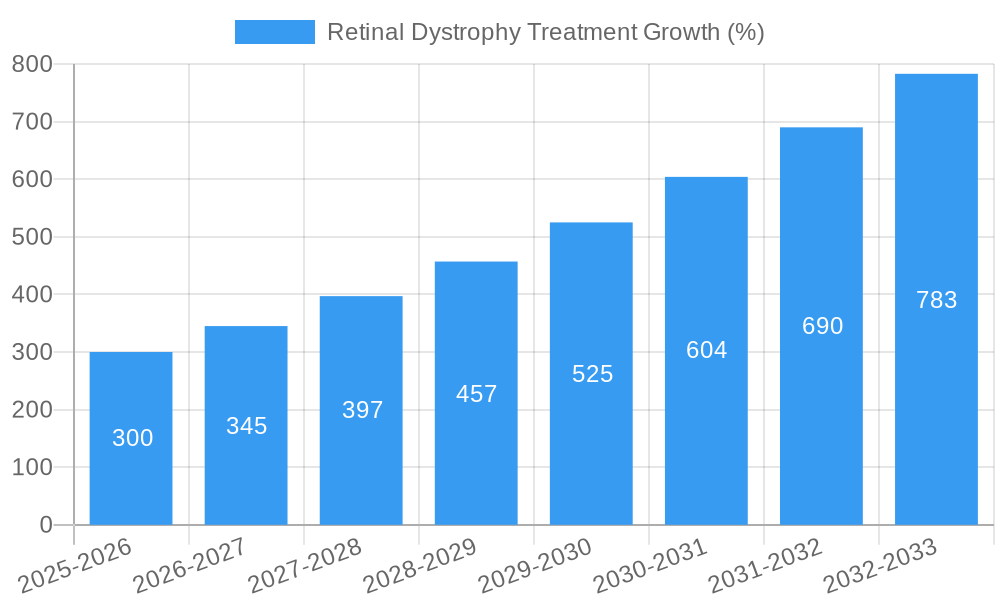
The retinal dystrophy treatment market is experiencing significant growth, driven by increasing prevalence of the disease, advancements in gene and cell therapies, and growing awareness among patients and healthcare professionals.
The market size is projected to grow from $xx million in 2025 to $xx million by 2033, exhibiting a CAGR of xx% during the forecast period. This robust growth is fueled by several factors including rising prevalence of retinal dystrophies globally, increasing investment in R&D, and the launch of novel therapies. While current market penetration remains low, due to limited treatment options, the introduction of more effective therapies and improved access is expected to drive significant market penetration growth over the forecast period. Technological advancements are leading to more targeted and effective therapies, influencing patient adoption rates positively. Consumer behavior is shifting towards a preference for minimally invasive procedures and long-term efficacy, further shaping the market demand.
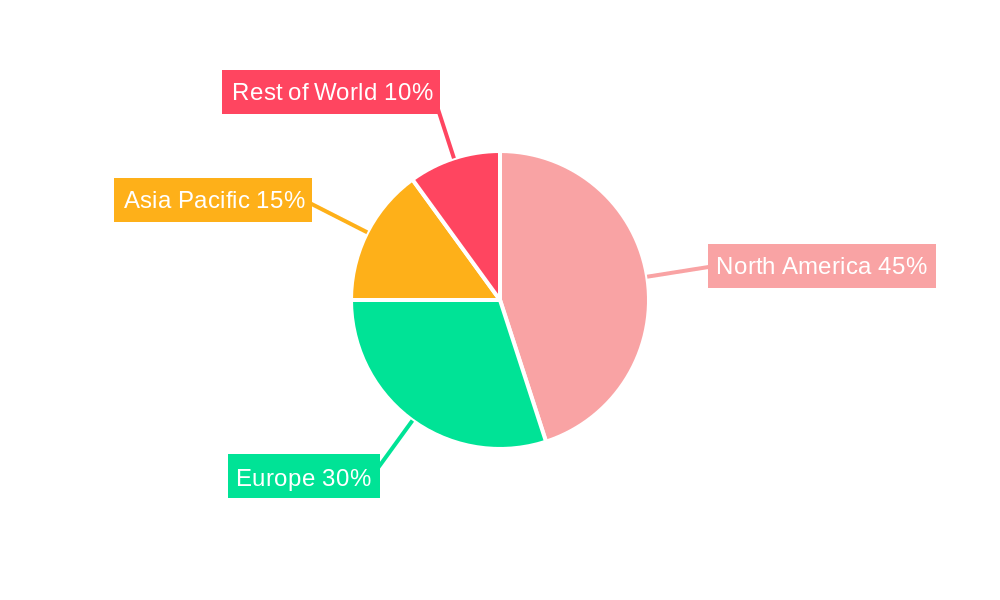
Dominant Regions, Countries, or Segments in Retinal Dystrophy Treatment
North America currently dominates the retinal dystrophy treatment market, driven by high healthcare expenditure, robust regulatory framework, and presence of major market players. However, Europe and Asia-Pacific are projected to witness significant growth in the forecast period.
- North America: High healthcare spending, advanced healthcare infrastructure, and early adoption of new therapies are key drivers. The region holds the largest market share (xx% in 2025).
- Europe: Growing awareness of retinal dystrophies and increased healthcare investments are fueling market growth.
- Asia-Pacific: A large and growing patient population and increasing healthcare spending are projected to drive significant market expansion in the coming years. However, challenges related to healthcare infrastructure and affordability need to be addressed.
Specific country-level analyses are included in the full report with details on market size, growth rate, and key influencing factors for major markets.
Retinal Dystrophy Treatment Product Landscape
The product landscape is dominated by gene therapies and cell-based therapies, with a focus on addressing specific genetic mutations underlying various retinal dystrophy subtypes. Recent innovations center on improving vector design for safer and more effective gene delivery and enhanced cell survival and integration in cell therapies. Unique selling propositions include improved visual acuity, slowed disease progression, and improved quality of life.
Key Drivers, Barriers & Challenges in Retinal Dystrophy Treatment
Key Drivers:
- Technological advancements in gene therapy and cell-based therapies.
- Growing prevalence of retinal dystrophies.
- Increasing investments in research and development.
- Rising healthcare expenditure.
Key Challenges and Restraints:
- High cost of treatment limiting access.
- Stringent regulatory requirements extending the approval process.
- Limited number of approved therapies.
- Potential for adverse events associated with novel therapies. The estimated impact of these challenges is a reduction in market growth of approximately xx% by 2033.
Emerging Opportunities in Retinal Dystrophy Treatment
Emerging opportunities include the development of therapies targeting a wider range of retinal dystrophy subtypes, the exploration of combination therapies, and personalized medicine approaches based on individual genetic profiles. Untapped markets in emerging economies also represent significant growth potential.
Growth Accelerators in the Retinal Dystrophy Treatment Industry
Significant long-term growth will be driven by the continuous improvement of gene and cell therapies, increased investment in R&D leading to more effective treatments, and strategic collaborations between large pharmaceutical companies and smaller biotechnology firms. Expansion into new markets and increased awareness among healthcare professionals will also contribute.
Key Players Shaping the Retinal Dystrophy Treatment Market
- Spark Therapeutics (Roche)
- Novartis AG
- GlaxoSmithKline
- Applied Genetic Technologies Corporation
- Oxford BioMedica
- Biogen
- HORAMA S.A.
- MeiraGTx Limited
- Novelion Therapeutics
- IVERIC bio
- Reflection Biotechnologies
Notable Milestones in Retinal Dystrophy Treatment Sector
- 2020: FDA approval of a gene therapy for a specific form of inherited retinal dystrophy.
- 2022: Launch of a new clinical trial evaluating a novel gene editing therapy.
- 2023: Acquisition of a small biotech company specializing in retinal dystrophy treatments by a major pharmaceutical player.
- 2024: Publication of significant clinical trial results demonstrating efficacy of a new therapeutic approach.
In-Depth Retinal Dystrophy Treatment Market Outlook
The future of the retinal dystrophy treatment market is bright. Continued technological advancements, growing research and development activities, and increasing awareness among healthcare professionals will fuel long-term market expansion. Strategic partnerships and collaborations will be crucial for accelerating innovation and bringing more effective therapies to patients. The market holds significant potential for growth, driven by unmet medical needs and the continuous pursuit of improved treatment options.
Retinal Dystrophy Treatment Segmentation
-
1. Application
- 1.1. Hospitals
- 1.2. Specialty Clinics
- 1.3. Others
-
2. Type
- 2.1. Gene Therapy Treatment
- 2.2. Symptomatic Treatment
Retinal Dystrophy Treatment Segmentation By Geography
-
1. North America
- 1.1. United States
- 1.2. Canada
- 1.3. Mexico
-
2. South America
- 2.1. Brazil
- 2.2. Argentina
- 2.3. Rest of South America
-
3. Europe
- 3.1. United Kingdom
- 3.2. Germany
- 3.3. France
- 3.4. Italy
- 3.5. Spain
- 3.6. Russia
- 3.7. Benelux
- 3.8. Nordics
- 3.9. Rest of Europe
-
4. Middle East & Africa
- 4.1. Turkey
- 4.2. Israel
- 4.3. GCC
- 4.4. North Africa
- 4.5. South Africa
- 4.6. Rest of Middle East & Africa
-
5. Asia Pacific
- 5.1. China
- 5.2. India
- 5.3. Japan
- 5.4. South Korea
- 5.5. ASEAN
- 5.6. Oceania
- 5.7. Rest of Asia Pacific
Retinal Dystrophy Treatment REPORT HIGHLIGHTS
| Aspects | Details |
|---|---|
| Study Period | 2019-2033 |
| Base Year | 2024 |
| Estimated Year | 2025 |
| Forecast Period | 2025-2033 |
| Historical Period | 2019-2024 |
| Growth Rate | CAGR of XXX% from 2019-2033 |
| Segmentation |
|
Table of Contents
- 1. Introduction
- 1.1. Research Scope
- 1.2. Market Segmentation
- 1.3. Research Methodology
- 1.4. Definitions and Assumptions
- 2. Executive Summary
- 2.1. Introduction
- 3. Market Dynamics
- 3.1. Introduction
- 3.2. Market Drivers
- 3.3. Market Restrains
- 3.4. Market Trends
- 4. Market Factor Analysis
- 4.1. Porters Five Forces
- 4.2. Supply/Value Chain
- 4.3. PESTEL analysis
- 4.4. Market Entropy
- 4.5. Patent/Trademark Analysis
- 5. Global Retinal Dystrophy Treatment Analysis, Insights and Forecast, 2019-2031
- 5.1. Market Analysis, Insights and Forecast - by Application
- 5.1.1. Hospitals
- 5.1.2. Specialty Clinics
- 5.1.3. Others
- 5.2. Market Analysis, Insights and Forecast - by Type
- 5.2.1. Gene Therapy Treatment
- 5.2.2. Symptomatic Treatment
- 5.3. Market Analysis, Insights and Forecast - by Region
- 5.3.1. North America
- 5.3.2. South America
- 5.3.3. Europe
- 5.3.4. Middle East & Africa
- 5.3.5. Asia Pacific
- 5.1. Market Analysis, Insights and Forecast - by Application
- 6. North America Retinal Dystrophy Treatment Analysis, Insights and Forecast, 2019-2031
- 6.1. Market Analysis, Insights and Forecast - by Application
- 6.1.1. Hospitals
- 6.1.2. Specialty Clinics
- 6.1.3. Others
- 6.2. Market Analysis, Insights and Forecast - by Type
- 6.2.1. Gene Therapy Treatment
- 6.2.2. Symptomatic Treatment
- 6.1. Market Analysis, Insights and Forecast - by Application
- 7. South America Retinal Dystrophy Treatment Analysis, Insights and Forecast, 2019-2031
- 7.1. Market Analysis, Insights and Forecast - by Application
- 7.1.1. Hospitals
- 7.1.2. Specialty Clinics
- 7.1.3. Others
- 7.2. Market Analysis, Insights and Forecast - by Type
- 7.2.1. Gene Therapy Treatment
- 7.2.2. Symptomatic Treatment
- 7.1. Market Analysis, Insights and Forecast - by Application
- 8. Europe Retinal Dystrophy Treatment Analysis, Insights and Forecast, 2019-2031
- 8.1. Market Analysis, Insights and Forecast - by Application
- 8.1.1. Hospitals
- 8.1.2. Specialty Clinics
- 8.1.3. Others
- 8.2. Market Analysis, Insights and Forecast - by Type
- 8.2.1. Gene Therapy Treatment
- 8.2.2. Symptomatic Treatment
- 8.1. Market Analysis, Insights and Forecast - by Application
- 9. Middle East & Africa Retinal Dystrophy Treatment Analysis, Insights and Forecast, 2019-2031
- 9.1. Market Analysis, Insights and Forecast - by Application
- 9.1.1. Hospitals
- 9.1.2. Specialty Clinics
- 9.1.3. Others
- 9.2. Market Analysis, Insights and Forecast - by Type
- 9.2.1. Gene Therapy Treatment
- 9.2.2. Symptomatic Treatment
- 9.1. Market Analysis, Insights and Forecast - by Application
- 10. Asia Pacific Retinal Dystrophy Treatment Analysis, Insights and Forecast, 2019-2031
- 10.1. Market Analysis, Insights and Forecast - by Application
- 10.1.1. Hospitals
- 10.1.2. Specialty Clinics
- 10.1.3. Others
- 10.2. Market Analysis, Insights and Forecast - by Type
- 10.2.1. Gene Therapy Treatment
- 10.2.2. Symptomatic Treatment
- 10.1. Market Analysis, Insights and Forecast - by Application
- 11. Competitive Analysis
- 11.1. Global Market Share Analysis 2024
- 11.2. Company Profiles
- 11.2.1 Spark Therapeutics (Roche)
- 11.2.1.1. Overview
- 11.2.1.2. Products
- 11.2.1.3. SWOT Analysis
- 11.2.1.4. Recent Developments
- 11.2.1.5. Financials (Based on Availability)
- 11.2.2 Novartis AG
- 11.2.2.1. Overview
- 11.2.2.2. Products
- 11.2.2.3. SWOT Analysis
- 11.2.2.4. Recent Developments
- 11.2.2.5. Financials (Based on Availability)
- 11.2.3 GlaxoSmithKline
- 11.2.3.1. Overview
- 11.2.3.2. Products
- 11.2.3.3. SWOT Analysis
- 11.2.3.4. Recent Developments
- 11.2.3.5. Financials (Based on Availability)
- 11.2.4 Applied Genetic Technologies Corporation
- 11.2.4.1. Overview
- 11.2.4.2. Products
- 11.2.4.3. SWOT Analysis
- 11.2.4.4. Recent Developments
- 11.2.4.5. Financials (Based on Availability)
- 11.2.5 Oxford BioMedica
- 11.2.5.1. Overview
- 11.2.5.2. Products
- 11.2.5.3. SWOT Analysis
- 11.2.5.4. Recent Developments
- 11.2.5.5. Financials (Based on Availability)
- 11.2.6 Biogen
- 11.2.6.1. Overview
- 11.2.6.2. Products
- 11.2.6.3. SWOT Analysis
- 11.2.6.4. Recent Developments
- 11.2.6.5. Financials (Based on Availability)
- 11.2.7 HORAMA S.A.
- 11.2.7.1. Overview
- 11.2.7.2. Products
- 11.2.7.3. SWOT Analysis
- 11.2.7.4. Recent Developments
- 11.2.7.5. Financials (Based on Availability)
- 11.2.8 MeiraGTx Limited
- 11.2.8.1. Overview
- 11.2.8.2. Products
- 11.2.8.3. SWOT Analysis
- 11.2.8.4. Recent Developments
- 11.2.8.5. Financials (Based on Availability)
- 11.2.9 Novelion Therapeutics
- 11.2.9.1. Overview
- 11.2.9.2. Products
- 11.2.9.3. SWOT Analysis
- 11.2.9.4. Recent Developments
- 11.2.9.5. Financials (Based on Availability)
- 11.2.10 IVERIC bio
- 11.2.10.1. Overview
- 11.2.10.2. Products
- 11.2.10.3. SWOT Analysis
- 11.2.10.4. Recent Developments
- 11.2.10.5. Financials (Based on Availability)
- 11.2.11 Reflection Biotechnologies
- 11.2.11.1. Overview
- 11.2.11.2. Products
- 11.2.11.3. SWOT Analysis
- 11.2.11.4. Recent Developments
- 11.2.11.5. Financials (Based on Availability)
- 11.2.1 Spark Therapeutics (Roche)
List of Figures
- Figure 1: Global Retinal Dystrophy Treatment Revenue Breakdown (million, %) by Region 2024 & 2032
- Figure 2: North America Retinal Dystrophy Treatment Revenue (million), by Application 2024 & 2032
- Figure 3: North America Retinal Dystrophy Treatment Revenue Share (%), by Application 2024 & 2032
- Figure 4: North America Retinal Dystrophy Treatment Revenue (million), by Type 2024 & 2032
- Figure 5: North America Retinal Dystrophy Treatment Revenue Share (%), by Type 2024 & 2032
- Figure 6: North America Retinal Dystrophy Treatment Revenue (million), by Country 2024 & 2032
- Figure 7: North America Retinal Dystrophy Treatment Revenue Share (%), by Country 2024 & 2032
- Figure 8: South America Retinal Dystrophy Treatment Revenue (million), by Application 2024 & 2032
- Figure 9: South America Retinal Dystrophy Treatment Revenue Share (%), by Application 2024 & 2032
- Figure 10: South America Retinal Dystrophy Treatment Revenue (million), by Type 2024 & 2032
- Figure 11: South America Retinal Dystrophy Treatment Revenue Share (%), by Type 2024 & 2032
- Figure 12: South America Retinal Dystrophy Treatment Revenue (million), by Country 2024 & 2032
- Figure 13: South America Retinal Dystrophy Treatment Revenue Share (%), by Country 2024 & 2032
- Figure 14: Europe Retinal Dystrophy Treatment Revenue (million), by Application 2024 & 2032
- Figure 15: Europe Retinal Dystrophy Treatment Revenue Share (%), by Application 2024 & 2032
- Figure 16: Europe Retinal Dystrophy Treatment Revenue (million), by Type 2024 & 2032
- Figure 17: Europe Retinal Dystrophy Treatment Revenue Share (%), by Type 2024 & 2032
- Figure 18: Europe Retinal Dystrophy Treatment Revenue (million), by Country 2024 & 2032
- Figure 19: Europe Retinal Dystrophy Treatment Revenue Share (%), by Country 2024 & 2032
- Figure 20: Middle East & Africa Retinal Dystrophy Treatment Revenue (million), by Application 2024 & 2032
- Figure 21: Middle East & Africa Retinal Dystrophy Treatment Revenue Share (%), by Application 2024 & 2032
- Figure 22: Middle East & Africa Retinal Dystrophy Treatment Revenue (million), by Type 2024 & 2032
- Figure 23: Middle East & Africa Retinal Dystrophy Treatment Revenue Share (%), by Type 2024 & 2032
- Figure 24: Middle East & Africa Retinal Dystrophy Treatment Revenue (million), by Country 2024 & 2032
- Figure 25: Middle East & Africa Retinal Dystrophy Treatment Revenue Share (%), by Country 2024 & 2032
- Figure 26: Asia Pacific Retinal Dystrophy Treatment Revenue (million), by Application 2024 & 2032
- Figure 27: Asia Pacific Retinal Dystrophy Treatment Revenue Share (%), by Application 2024 & 2032
- Figure 28: Asia Pacific Retinal Dystrophy Treatment Revenue (million), by Type 2024 & 2032
- Figure 29: Asia Pacific Retinal Dystrophy Treatment Revenue Share (%), by Type 2024 & 2032
- Figure 30: Asia Pacific Retinal Dystrophy Treatment Revenue (million), by Country 2024 & 2032
- Figure 31: Asia Pacific Retinal Dystrophy Treatment Revenue Share (%), by Country 2024 & 2032
List of Tables
- Table 1: Global Retinal Dystrophy Treatment Revenue million Forecast, by Region 2019 & 2032
- Table 2: Global Retinal Dystrophy Treatment Revenue million Forecast, by Application 2019 & 2032
- Table 3: Global Retinal Dystrophy Treatment Revenue million Forecast, by Type 2019 & 2032
- Table 4: Global Retinal Dystrophy Treatment Revenue million Forecast, by Region 2019 & 2032
- Table 5: Global Retinal Dystrophy Treatment Revenue million Forecast, by Application 2019 & 2032
- Table 6: Global Retinal Dystrophy Treatment Revenue million Forecast, by Type 2019 & 2032
- Table 7: Global Retinal Dystrophy Treatment Revenue million Forecast, by Country 2019 & 2032
- Table 8: United States Retinal Dystrophy Treatment Revenue (million) Forecast, by Application 2019 & 2032
- Table 9: Canada Retinal Dystrophy Treatment Revenue (million) Forecast, by Application 2019 & 2032
- Table 10: Mexico Retinal Dystrophy Treatment Revenue (million) Forecast, by Application 2019 & 2032
- Table 11: Global Retinal Dystrophy Treatment Revenue million Forecast, by Application 2019 & 2032
- Table 12: Global Retinal Dystrophy Treatment Revenue million Forecast, by Type 2019 & 2032
- Table 13: Global Retinal Dystrophy Treatment Revenue million Forecast, by Country 2019 & 2032
- Table 14: Brazil Retinal Dystrophy Treatment Revenue (million) Forecast, by Application 2019 & 2032
- Table 15: Argentina Retinal Dystrophy Treatment Revenue (million) Forecast, by Application 2019 & 2032
- Table 16: Rest of South America Retinal Dystrophy Treatment Revenue (million) Forecast, by Application 2019 & 2032
- Table 17: Global Retinal Dystrophy Treatment Revenue million Forecast, by Application 2019 & 2032
- Table 18: Global Retinal Dystrophy Treatment Revenue million Forecast, by Type 2019 & 2032
- Table 19: Global Retinal Dystrophy Treatment Revenue million Forecast, by Country 2019 & 2032
- Table 20: United Kingdom Retinal Dystrophy Treatment Revenue (million) Forecast, by Application 2019 & 2032
- Table 21: Germany Retinal Dystrophy Treatment Revenue (million) Forecast, by Application 2019 & 2032
- Table 22: France Retinal Dystrophy Treatment Revenue (million) Forecast, by Application 2019 & 2032
- Table 23: Italy Retinal Dystrophy Treatment Revenue (million) Forecast, by Application 2019 & 2032
- Table 24: Spain Retinal Dystrophy Treatment Revenue (million) Forecast, by Application 2019 & 2032
- Table 25: Russia Retinal Dystrophy Treatment Revenue (million) Forecast, by Application 2019 & 2032
- Table 26: Benelux Retinal Dystrophy Treatment Revenue (million) Forecast, by Application 2019 & 2032
- Table 27: Nordics Retinal Dystrophy Treatment Revenue (million) Forecast, by Application 2019 & 2032
- Table 28: Rest of Europe Retinal Dystrophy Treatment Revenue (million) Forecast, by Application 2019 & 2032
- Table 29: Global Retinal Dystrophy Treatment Revenue million Forecast, by Application 2019 & 2032
- Table 30: Global Retinal Dystrophy Treatment Revenue million Forecast, by Type 2019 & 2032
- Table 31: Global Retinal Dystrophy Treatment Revenue million Forecast, by Country 2019 & 2032
- Table 32: Turkey Retinal Dystrophy Treatment Revenue (million) Forecast, by Application 2019 & 2032
- Table 33: Israel Retinal Dystrophy Treatment Revenue (million) Forecast, by Application 2019 & 2032
- Table 34: GCC Retinal Dystrophy Treatment Revenue (million) Forecast, by Application 2019 & 2032
- Table 35: North Africa Retinal Dystrophy Treatment Revenue (million) Forecast, by Application 2019 & 2032
- Table 36: South Africa Retinal Dystrophy Treatment Revenue (million) Forecast, by Application 2019 & 2032
- Table 37: Rest of Middle East & Africa Retinal Dystrophy Treatment Revenue (million) Forecast, by Application 2019 & 2032
- Table 38: Global Retinal Dystrophy Treatment Revenue million Forecast, by Application 2019 & 2032
- Table 39: Global Retinal Dystrophy Treatment Revenue million Forecast, by Type 2019 & 2032
- Table 40: Global Retinal Dystrophy Treatment Revenue million Forecast, by Country 2019 & 2032
- Table 41: China Retinal Dystrophy Treatment Revenue (million) Forecast, by Application 2019 & 2032
- Table 42: India Retinal Dystrophy Treatment Revenue (million) Forecast, by Application 2019 & 2032
- Table 43: Japan Retinal Dystrophy Treatment Revenue (million) Forecast, by Application 2019 & 2032
- Table 44: South Korea Retinal Dystrophy Treatment Revenue (million) Forecast, by Application 2019 & 2032
- Table 45: ASEAN Retinal Dystrophy Treatment Revenue (million) Forecast, by Application 2019 & 2032
- Table 46: Oceania Retinal Dystrophy Treatment Revenue (million) Forecast, by Application 2019 & 2032
- Table 47: Rest of Asia Pacific Retinal Dystrophy Treatment Revenue (million) Forecast, by Application 2019 & 2032
Frequently Asked Questions
1. What is the projected Compound Annual Growth Rate (CAGR) of the Retinal Dystrophy Treatment?
The projected CAGR is approximately XXX%.
2. Which companies are prominent players in the Retinal Dystrophy Treatment?
Key companies in the market include Spark Therapeutics (Roche), Novartis AG, GlaxoSmithKline, Applied Genetic Technologies Corporation, Oxford BioMedica, Biogen, HORAMA S.A., MeiraGTx Limited, Novelion Therapeutics, IVERIC bio, Reflection Biotechnologies.
3. What are the main segments of the Retinal Dystrophy Treatment?
The market segments include Application, Type.
4. Can you provide details about the market size?
The market size is estimated to be USD XXX million as of 2022.
5. What are some drivers contributing to market growth?
N/A
6. What are the notable trends driving market growth?
N/A
7. Are there any restraints impacting market growth?
N/A
8. Can you provide examples of recent developments in the market?
N/A
9. What pricing options are available for accessing the report?
Pricing options include single-user, multi-user, and enterprise licenses priced at USD 2900.00, USD 4350.00, and USD 5800.00 respectively.
10. Is the market size provided in terms of value or volume?
The market size is provided in terms of value, measured in million.
11. Are there any specific market keywords associated with the report?
Yes, the market keyword associated with the report is "Retinal Dystrophy Treatment," which aids in identifying and referencing the specific market segment covered.
12. How do I determine which pricing option suits my needs best?
The pricing options vary based on user requirements and access needs. Individual users may opt for single-user licenses, while businesses requiring broader access may choose multi-user or enterprise licenses for cost-effective access to the report.
13. Are there any additional resources or data provided in the Retinal Dystrophy Treatment report?
While the report offers comprehensive insights, it's advisable to review the specific contents or supplementary materials provided to ascertain if additional resources or data are available.
14. How can I stay updated on further developments or reports in the Retinal Dystrophy Treatment?
To stay informed about further developments, trends, and reports in the Retinal Dystrophy Treatment, consider subscribing to industry newsletters, following relevant companies and organizations, or regularly checking reputable industry news sources and publications.
Methodology
Step 1 - Identification of Relevant Samples Size from Population Database


Step 2 - Approaches for Defining Global Market Size (Value, Volume* & Price*)

Note*: In applicable scenarios
Step 3 - Data Sources
Primary Research
- Web Analytics
- Survey Reports
- Research Institute
- Latest Research Reports
- Opinion Leaders
Secondary Research
- Annual Reports
- White Paper
- Latest Press Release
- Industry Association
- Paid Database
- Investor Presentations

Step 4 - Data Triangulation
Involves using different sources of information in order to increase the validity of a study
These sources are likely to be stakeholders in a program - participants, other researchers, program staff, other community members, and so on.
Then we put all data in single framework & apply various statistical tools to find out the dynamic on the market.
During the analysis stage, feedback from the stakeholder groups would be compared to determine areas of agreement as well as areas of divergence
