

Key Insights
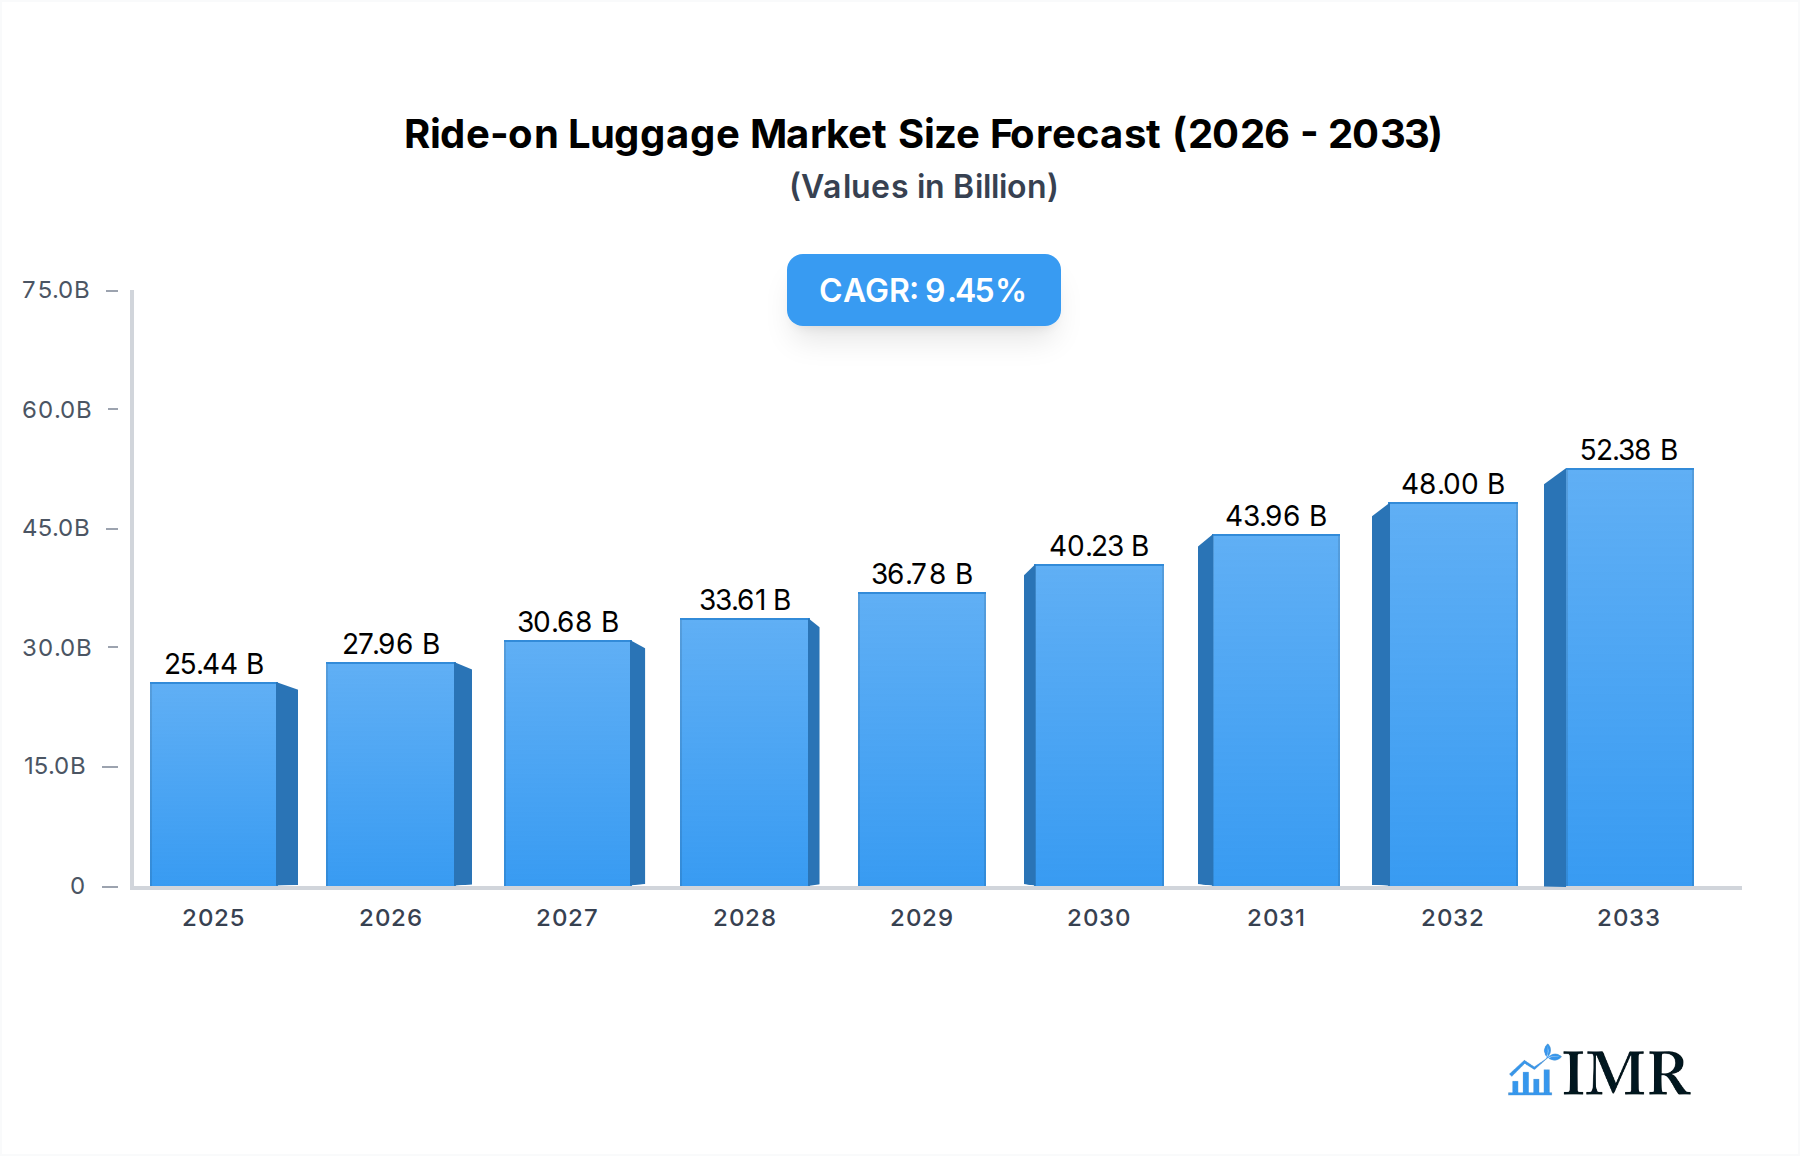
The global ride-on luggage market is poised for significant expansion, projected to reach $25.44 billion by 2025, with an impressive CAGR of 9.95% anticipated throughout the forecast period of 2025-2033. This robust growth is fueled by several key drivers, including the increasing demand for convenient and entertaining travel solutions, particularly among families traveling with children. The evolution of travel products to incorporate entertainment and utility for younger travelers, coupled with a rising disposable income in developing regions, is a major catalyst. Furthermore, advancements in design and functionality, such as enhanced storage, durability, and integrated electronic features, are making ride-on luggage a more attractive option for both commercial and private use. The market is segmented into Adult Ride-on Luggage and Children Ride-on Luggage, with both categories experiencing steady demand. Companies like Modobag, Younglinaz, MiaMily, and Trunki are at the forefront of innovation, offering a diverse range of products that cater to the evolving needs of modern travelers.

Ride-on Luggage Market Size (In Billion)
The market's upward trajectory is further supported by emerging trends such as the integration of smart features, including GPS tracking and charging capabilities, into ride-on luggage, enhancing security and user experience. The growing popularity of staycations and shorter domestic trips has also contributed to the increased adoption of these versatile travel companions. While the market is brimming with opportunities, certain restraints, such as the relatively higher cost compared to traditional luggage and potential size limitations for carry-on allowances on certain airlines, might temper the growth pace. However, the overall outlook remains exceptionally positive, with strong potential for continued innovation and market penetration across various regions, especially in North America and Asia Pacific, which are expected to lead in terms of adoption and market share.
Ride-on Luggage Company Market Share
This comprehensive report delves into the burgeoning global ride-on luggage market, analyzing its intricate dynamics, growth trajectories, and future potential from 2019 to 2033. With a base year of 2025 and a forecast period extending to 2033, this study provides critical insights into market size, segmentation, key drivers, challenges, and emerging opportunities, making it an indispensable resource for industry professionals, investors, and manufacturers. The report explores both the parent and child market segments, highlighting distinct growth drivers and consumer preferences within each.
Ride-on Luggage Market Dynamics & Structure
The global ride-on luggage market is characterized by a moderate to high concentration, with a few key players holding significant market share. Technological innovation is a primary driver, fueled by advancements in lightweight materials, electric propulsion for motorized variants, and integrated smart features like GPS tracking and charging ports. Regulatory frameworks, particularly concerning airline carry-on size restrictions and battery safety for electric models, play a crucial role in shaping product development and market access. Competitive product substitutes, such as traditional rolling luggage and backpacks, continue to pose a challenge, but the unique convenience and entertainment value of ride-on luggage carve out a distinct niche. End-user demographics are expanding beyond children to include a growing segment of adult travelers seeking efficiency and novelty. Mergers and acquisitions (M&A) are emerging as a strategy for market consolidation and technology acquisition.
- Market Concentration: Dominated by a blend of specialized manufacturers and larger luggage brands entering the segment.
- Technological Innovation: Focus on lighter, more durable materials, enhanced battery technology for electric models, and user-friendly design.
- Regulatory Impact: Adherence to airline size regulations and evolving battery safety standards is paramount.
- Competitive Landscape: Competition from traditional luggage formats balanced by the unique value proposition of ride-on options.
- End-User Evolution: Increasing adoption by adults for business and leisure travel, alongside the established children's market.
- M&A Trends: Strategic acquisitions to expand product portfolios and gain market access.
Ride-on Luggage Growth Trends & Insights
The global ride-on luggage market is poised for significant expansion, projected to witness a robust Compound Annual Growth Rate (CAGR) of approximately 12.5% from 2025 to 2033. The market size, estimated to reach $6.2 billion in 2025, is anticipated to surge to over $15.8 billion by 2033. This upward trajectory is driven by evolving consumer lifestyles, increased disposable incomes, and a growing demand for travel convenience and novel experiences. The historical period of 2019-2024 saw steady growth, laying the groundwork for accelerated adoption. Technological disruptions, such as the integration of electric motors and smart features, are transforming the market from a simple novelty to a functional travel accessory. Consumer behavior shifts are evident, with more adults embracing ride-on luggage for its ability to reduce travel fatigue and add an element of fun, particularly in airports and train stations. Market penetration for adult ride-on luggage is expected to increase significantly as awareness and product offerings expand. The children's segment, a foundational pillar of the market, continues to demonstrate strong demand, driven by parental desire for child entertainment and independent mobility during travel. The increasing global tourism and business travel further bolster the adoption rates across both parent and child market segments. Analysis of adoption rates indicates a strong correlation between travel frequency and the uptake of ride-on luggage solutions.
Dominant Regions, Countries, or Segments in Ride-on Luggage
The Adult Ride-on Luggage segment is emerging as the dominant force driving market growth, expected to capture a substantial market share exceeding 65% by 2033. This dominance stems from a confluence of factors, including the increasing prevalence of business travel, a growing emphasis on efficient airport navigation, and a rising trend in experiential travel. North America and Europe currently lead in market penetration for adult ride-on luggage, propelled by robust economies, high disposable incomes, and a well-established travel infrastructure. For instance, the United States, with its vast airport networks and frequent business and leisure travel, represents a significant market. The economic policies in these regions often support innovation and consumer spending on travel accessories.
In contrast, the Children's Ride-on Luggage segment, while foundational and consistently strong, is projected to grow at a more moderate pace. Asia-Pacific, particularly China, is witnessing rapid growth in this segment, driven by a burgeoning middle class and a rising birth rate. Countries like China are implementing policies that encourage domestic tourism and family travel, directly benefiting the children's segment. However, the sheer volume of adult travelers and the increasing adoption of motorized adult options are tipping the scales in favor of the adult segment's overall market value.
- Dominant Segment: Adult Ride-on Luggage, driven by business travel and convenience needs.
- Leading Regions: North America and Europe for adult segment, with Asia-Pacific showing rapid growth.
- Key Drivers (Adult Segment): Increased business travel, demand for airport efficiency, and innovative product features.
- Key Drivers (Children's Segment): Family travel trends, entertainment value, and increasing disposable incomes in emerging economies.
- Market Share Potential: Adult segment projected to hold over 65% market share by 2033.
- Growth Potential: Asia-Pacific emerging as a significant growth hotspot for both segments.
Ride-on Luggage Product Landscape
The ride-on luggage product landscape is evolving rapidly, showcasing a spectrum of innovations designed to enhance functionality and user experience. From lightweight, durable polycarbonate shells to integrated electric motors providing propulsion, the market is moving beyond basic utility. Products now feature advanced battery technology, offering extended range and quick charging capabilities. Smart features, including GPS tracking, USB charging ports, and even built-in entertainment systems, are becoming increasingly common. The unique selling propositions often lie in the blend of storage capacity, maneuverability, and an engaging travel experience. For instance, motorized models from companies like Modobag and Airwheel Holding offer a futuristic commuting solution within airports.
Key Drivers, Barriers & Challenges in Ride-on Luggage
Key Drivers: The ride-on luggage market is propelled by several key drivers. Technological advancements in lightweight materials and battery efficiency for electric variants are making these products more appealing and practical. The increasing frequency of both business and leisure travel globally fuels demand for convenient and enjoyable travel solutions. The growing popularity of ride-on luggage as a novel and fun travel accessory, particularly for children and younger adults, contributes significantly. Furthermore, evolving airline regulations that accommodate the dimensions of many ride-on luggage models have eased adoption.
Barriers & Challenges: Despite the positive outlook, the market faces several challenges. Supply chain disruptions, particularly for electronic components in motorized models, can impact production and availability. Stringent safety regulations for lithium-ion batteries in electric ride-on luggage, especially for air travel, pose a significant hurdle. High manufacturing costs for advanced features can lead to premium pricing, limiting affordability for some consumer segments. Intense competition from established luggage manufacturers offering traditional, lower-cost alternatives also presents a challenge.
Emerging Opportunities in Ride-on Luggage
Emerging opportunities in the ride-on luggage sector lie in the development of more eco-friendly and sustainable materials, appealing to environmentally conscious consumers. Untapped markets in developing economies with growing middle classes and increasing travel are ripe for expansion. Innovative applications, such as integrating smart features for enhanced security and connectivity, present a significant growth avenue. Evolving consumer preferences for personalized and customizable luggage also offer a niche for tailored product offerings. The integration of ride-on luggage into the "last mile" transportation solutions for urban commuters is another burgeoning opportunity.
Growth Accelerators in the Ride-on Luggage Industry
Several catalysts are accelerating growth in the ride-on luggage industry. Technological breakthroughs in battery density and motor efficiency are expanding the practical applications and range of electric models. Strategic partnerships between luggage manufacturers and technology companies can lead to the co-development of innovative products. Market expansion strategies targeting emerging economies with increasing disposable incomes and a burgeoning middle class are crucial for long-term growth. The growing trend of smart cities and integrated urban mobility solutions also provides a fertile ground for the widespread adoption of motorized ride-on luggage.
Key Players Shaping the Ride-on Luggage Market
- Modobag
- Younglinaz
- MiaMily
- Airwheel Holding
- Kiddietotes
- Micro Mobility
- Olaf scooter
- Rydebot
- Trunki
- Tucci Disegno
- Changzhou AirWheel Intelligence Technology
Notable Milestones in Ride-on Luggage Sector
- 2019: Increased focus on electric and smart features for adult ride-on luggage prototypes.
- 2020: Expansion of online retail channels significantly boosts sales for children's ride-on luggage.
- 2021: Several companies begin exploring sustainable material options for ride-on luggage manufacturing.
- 2022: Introduction of advanced safety features and improved battery management systems in electric models.
- 2023: Growing recognition of ride-on luggage as a viable airport transit solution for adults.
- 2024: Early signs of strategic collaborations between tech firms and luggage brands for next-generation products.
In-Depth Ride-on Luggage Market Outlook
The in-depth outlook for the ride-on luggage market is exceptionally bright, fueled by continuous innovation and evolving consumer needs. Growth accelerators such as advancements in battery technology, the integration of smart connectivity features, and strategic market expansions into emerging economies will continue to drive significant market expansion. The increasing acceptance of ride-on luggage across various age groups, particularly for adult commuters seeking efficiency and novelty, presents a substantial untapped potential. Strategic partnerships and a focus on sustainability will further enhance market appeal and long-term viability, solidifying ride-on luggage's position as a dynamic and essential travel accessory in the coming years. The estimated market value of $15.8 billion by 2033 underscores the immense future potential and investment opportunities within this sector.
Ride-on Luggage Segmentation
-
1. Application
- 1.1. Commercial Use
- 1.2. Private Use
-
2. Types
- 2.1. Adult Ride-on Luggage
- 2.2. Children Ride-on Luggage
Ride-on Luggage Segmentation By Geography
-
1. North America
- 1.1. United States
- 1.2. Canada
- 1.3. Mexico
-
2. South America
- 2.1. Brazil
- 2.2. Argentina
- 2.3. Rest of South America
-
3. Europe
- 3.1. United Kingdom
- 3.2. Germany
- 3.3. France
- 3.4. Italy
- 3.5. Spain
- 3.6. Russia
- 3.7. Benelux
- 3.8. Nordics
- 3.9. Rest of Europe
-
4. Middle East & Africa
- 4.1. Turkey
- 4.2. Israel
- 4.3. GCC
- 4.4. North Africa
- 4.5. South Africa
- 4.6. Rest of Middle East & Africa
-
5. Asia Pacific
- 5.1. China
- 5.2. India
- 5.3. Japan
- 5.4. South Korea
- 5.5. ASEAN
- 5.6. Oceania
- 5.7. Rest of Asia Pacific
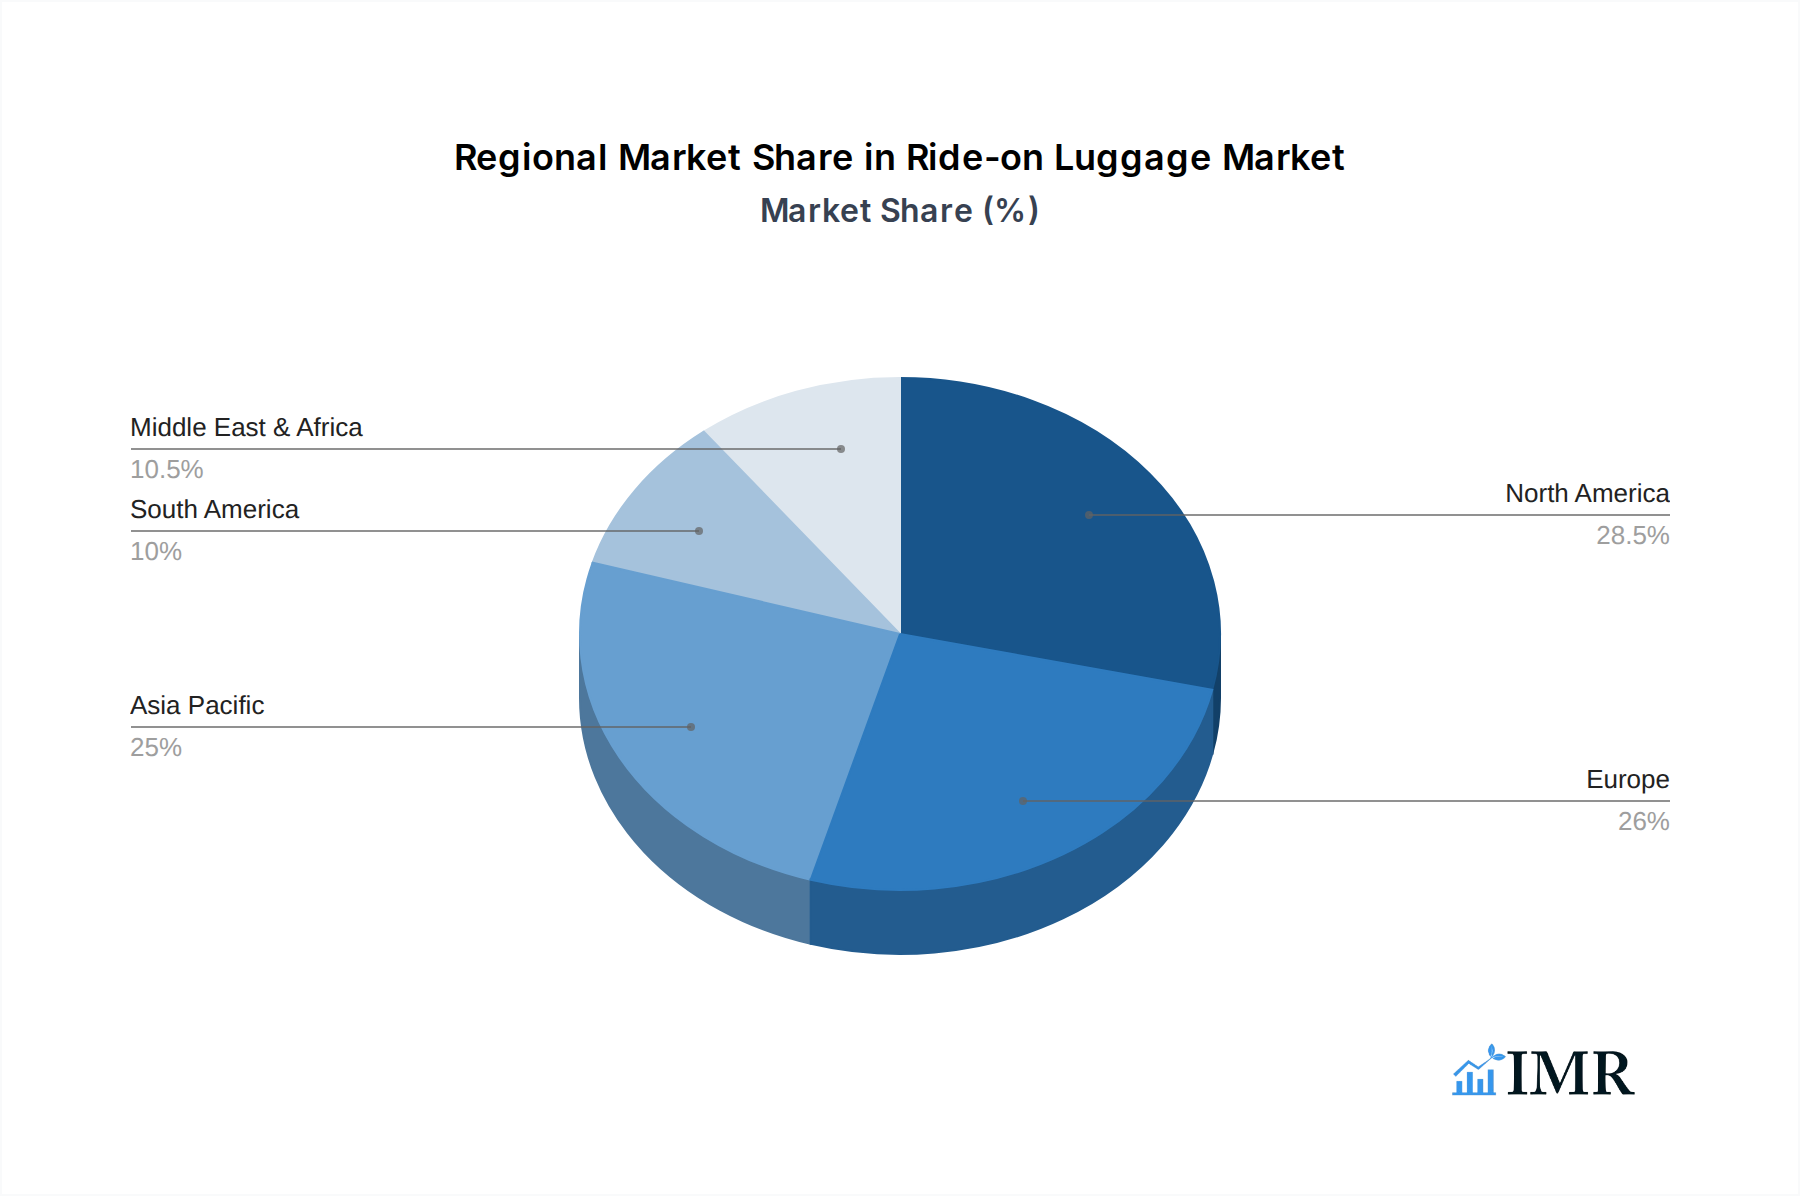
Ride-on Luggage Regional Market Share
Geographic Coverage of Ride-on Luggage
Ride-on Luggage REPORT HIGHLIGHTS
| Aspects | Details |
|---|---|
| Study Period | 2020-2034 |
| Base Year | 2025 |
| Estimated Year | 2026 |
| Forecast Period | 2026-2034 |
| Historical Period | 2020-2025 |
| Growth Rate | CAGR of 9.95% from 2020-2034 |
| Segmentation |
|
Table of Contents
- 1. Introduction
- 1.1. Research Scope
- 1.2. Market Segmentation
- 1.3. Research Methodology
- 1.4. Definitions and Assumptions
- 2. Executive Summary
- 2.1. Introduction
- 3. Market Dynamics
- 3.1. Introduction
- 3.2. Market Drivers
- 3.3. Market Restrains
- 3.4. Market Trends
- 4. Market Factor Analysis
- 4.1. Porters Five Forces
- 4.2. Supply/Value Chain
- 4.3. PESTEL analysis
- 4.4. Market Entropy
- 4.5. Patent/Trademark Analysis
- 5. Global Ride-on Luggage Analysis, Insights and Forecast, 2020-2032
- 5.1. Market Analysis, Insights and Forecast - by Application
- 5.1.1. Commercial Use
- 5.1.2. Private Use
- 5.2. Market Analysis, Insights and Forecast - by Types
- 5.2.1. Adult Ride-on Luggage
- 5.2.2. Children Ride-on Luggage
- 5.3. Market Analysis, Insights and Forecast - by Region
- 5.3.1. North America
- 5.3.2. South America
- 5.3.3. Europe
- 5.3.4. Middle East & Africa
- 5.3.5. Asia Pacific
- 5.1. Market Analysis, Insights and Forecast - by Application
- 6. North America Ride-on Luggage Analysis, Insights and Forecast, 2020-2032
- 6.1. Market Analysis, Insights and Forecast - by Application
- 6.1.1. Commercial Use
- 6.1.2. Private Use
- 6.2. Market Analysis, Insights and Forecast - by Types
- 6.2.1. Adult Ride-on Luggage
- 6.2.2. Children Ride-on Luggage
- 6.1. Market Analysis, Insights and Forecast - by Application
- 7. South America Ride-on Luggage Analysis, Insights and Forecast, 2020-2032
- 7.1. Market Analysis, Insights and Forecast - by Application
- 7.1.1. Commercial Use
- 7.1.2. Private Use
- 7.2. Market Analysis, Insights and Forecast - by Types
- 7.2.1. Adult Ride-on Luggage
- 7.2.2. Children Ride-on Luggage
- 7.1. Market Analysis, Insights and Forecast - by Application
- 8. Europe Ride-on Luggage Analysis, Insights and Forecast, 2020-2032
- 8.1. Market Analysis, Insights and Forecast - by Application
- 8.1.1. Commercial Use
- 8.1.2. Private Use
- 8.2. Market Analysis, Insights and Forecast - by Types
- 8.2.1. Adult Ride-on Luggage
- 8.2.2. Children Ride-on Luggage
- 8.1. Market Analysis, Insights and Forecast - by Application
- 9. Middle East & Africa Ride-on Luggage Analysis, Insights and Forecast, 2020-2032
- 9.1. Market Analysis, Insights and Forecast - by Application
- 9.1.1. Commercial Use
- 9.1.2. Private Use
- 9.2. Market Analysis, Insights and Forecast - by Types
- 9.2.1. Adult Ride-on Luggage
- 9.2.2. Children Ride-on Luggage
- 9.1. Market Analysis, Insights and Forecast - by Application
- 10. Asia Pacific Ride-on Luggage Analysis, Insights and Forecast, 2020-2032
- 10.1. Market Analysis, Insights and Forecast - by Application
- 10.1.1. Commercial Use
- 10.1.2. Private Use
- 10.2. Market Analysis, Insights and Forecast - by Types
- 10.2.1. Adult Ride-on Luggage
- 10.2.2. Children Ride-on Luggage
- 10.1. Market Analysis, Insights and Forecast - by Application
- 11. Competitive Analysis
- 11.1. Global Market Share Analysis 2025
- 11.2. Company Profiles
- 11.2.1 Modobag
- 11.2.1.1. Overview
- 11.2.1.2. Products
- 11.2.1.3. SWOT Analysis
- 11.2.1.4. Recent Developments
- 11.2.1.5. Financials (Based on Availability)
- 11.2.2 Younglinaz
- 11.2.2.1. Overview
- 11.2.2.2. Products
- 11.2.2.3. SWOT Analysis
- 11.2.2.4. Recent Developments
- 11.2.2.5. Financials (Based on Availability)
- 11.2.3 MiaMily
- 11.2.3.1. Overview
- 11.2.3.2. Products
- 11.2.3.3. SWOT Analysis
- 11.2.3.4. Recent Developments
- 11.2.3.5. Financials (Based on Availability)
- 11.2.4 Airwheel Holding
- 11.2.4.1. Overview
- 11.2.4.2. Products
- 11.2.4.3. SWOT Analysis
- 11.2.4.4. Recent Developments
- 11.2.4.5. Financials (Based on Availability)
- 11.2.5 Kiddietotes
- 11.2.5.1. Overview
- 11.2.5.2. Products
- 11.2.5.3. SWOT Analysis
- 11.2.5.4. Recent Developments
- 11.2.5.5. Financials (Based on Availability)
- 11.2.6 Micro Mobility
- 11.2.6.1. Overview
- 11.2.6.2. Products
- 11.2.6.3. SWOT Analysis
- 11.2.6.4. Recent Developments
- 11.2.6.5. Financials (Based on Availability)
- 11.2.7 Olaf scooter
- 11.2.7.1. Overview
- 11.2.7.2. Products
- 11.2.7.3. SWOT Analysis
- 11.2.7.4. Recent Developments
- 11.2.7.5. Financials (Based on Availability)
- 11.2.8 Rydebot
- 11.2.8.1. Overview
- 11.2.8.2. Products
- 11.2.8.3. SWOT Analysis
- 11.2.8.4. Recent Developments
- 11.2.8.5. Financials (Based on Availability)
- 11.2.9 Trunki
- 11.2.9.1. Overview
- 11.2.9.2. Products
- 11.2.9.3. SWOT Analysis
- 11.2.9.4. Recent Developments
- 11.2.9.5. Financials (Based on Availability)
- 11.2.10 Tucci Disegno
- 11.2.10.1. Overview
- 11.2.10.2. Products
- 11.2.10.3. SWOT Analysis
- 11.2.10.4. Recent Developments
- 11.2.10.5. Financials (Based on Availability)
- 11.2.11 Changzhou AirWheel Intelligence Technology
- 11.2.11.1. Overview
- 11.2.11.2. Products
- 11.2.11.3. SWOT Analysis
- 11.2.11.4. Recent Developments
- 11.2.11.5. Financials (Based on Availability)
- 11.2.1 Modobag
List of Figures
- Figure 1: Global Ride-on Luggage Revenue Breakdown (billion, %) by Region 2025 & 2033
- Figure 2: Global Ride-on Luggage Volume Breakdown (K, %) by Region 2025 & 2033
- Figure 3: North America Ride-on Luggage Revenue (billion), by Application 2025 & 2033
- Figure 4: North America Ride-on Luggage Volume (K), by Application 2025 & 2033
- Figure 5: North America Ride-on Luggage Revenue Share (%), by Application 2025 & 2033
- Figure 6: North America Ride-on Luggage Volume Share (%), by Application 2025 & 2033
- Figure 7: North America Ride-on Luggage Revenue (billion), by Types 2025 & 2033
- Figure 8: North America Ride-on Luggage Volume (K), by Types 2025 & 2033
- Figure 9: North America Ride-on Luggage Revenue Share (%), by Types 2025 & 2033
- Figure 10: North America Ride-on Luggage Volume Share (%), by Types 2025 & 2033
- Figure 11: North America Ride-on Luggage Revenue (billion), by Country 2025 & 2033
- Figure 12: North America Ride-on Luggage Volume (K), by Country 2025 & 2033
- Figure 13: North America Ride-on Luggage Revenue Share (%), by Country 2025 & 2033
- Figure 14: North America Ride-on Luggage Volume Share (%), by Country 2025 & 2033
- Figure 15: South America Ride-on Luggage Revenue (billion), by Application 2025 & 2033
- Figure 16: South America Ride-on Luggage Volume (K), by Application 2025 & 2033
- Figure 17: South America Ride-on Luggage Revenue Share (%), by Application 2025 & 2033
- Figure 18: South America Ride-on Luggage Volume Share (%), by Application 2025 & 2033
- Figure 19: South America Ride-on Luggage Revenue (billion), by Types 2025 & 2033
- Figure 20: South America Ride-on Luggage Volume (K), by Types 2025 & 2033
- Figure 21: South America Ride-on Luggage Revenue Share (%), by Types 2025 & 2033
- Figure 22: South America Ride-on Luggage Volume Share (%), by Types 2025 & 2033
- Figure 23: South America Ride-on Luggage Revenue (billion), by Country 2025 & 2033
- Figure 24: South America Ride-on Luggage Volume (K), by Country 2025 & 2033
- Figure 25: South America Ride-on Luggage Revenue Share (%), by Country 2025 & 2033
- Figure 26: South America Ride-on Luggage Volume Share (%), by Country 2025 & 2033
- Figure 27: Europe Ride-on Luggage Revenue (billion), by Application 2025 & 2033
- Figure 28: Europe Ride-on Luggage Volume (K), by Application 2025 & 2033
- Figure 29: Europe Ride-on Luggage Revenue Share (%), by Application 2025 & 2033
- Figure 30: Europe Ride-on Luggage Volume Share (%), by Application 2025 & 2033
- Figure 31: Europe Ride-on Luggage Revenue (billion), by Types 2025 & 2033
- Figure 32: Europe Ride-on Luggage Volume (K), by Types 2025 & 2033
- Figure 33: Europe Ride-on Luggage Revenue Share (%), by Types 2025 & 2033
- Figure 34: Europe Ride-on Luggage Volume Share (%), by Types 2025 & 2033
- Figure 35: Europe Ride-on Luggage Revenue (billion), by Country 2025 & 2033
- Figure 36: Europe Ride-on Luggage Volume (K), by Country 2025 & 2033
- Figure 37: Europe Ride-on Luggage Revenue Share (%), by Country 2025 & 2033
- Figure 38: Europe Ride-on Luggage Volume Share (%), by Country 2025 & 2033
- Figure 39: Middle East & Africa Ride-on Luggage Revenue (billion), by Application 2025 & 2033
- Figure 40: Middle East & Africa Ride-on Luggage Volume (K), by Application 2025 & 2033
- Figure 41: Middle East & Africa Ride-on Luggage Revenue Share (%), by Application 2025 & 2033
- Figure 42: Middle East & Africa Ride-on Luggage Volume Share (%), by Application 2025 & 2033
- Figure 43: Middle East & Africa Ride-on Luggage Revenue (billion), by Types 2025 & 2033
- Figure 44: Middle East & Africa Ride-on Luggage Volume (K), by Types 2025 & 2033
- Figure 45: Middle East & Africa Ride-on Luggage Revenue Share (%), by Types 2025 & 2033
- Figure 46: Middle East & Africa Ride-on Luggage Volume Share (%), by Types 2025 & 2033
- Figure 47: Middle East & Africa Ride-on Luggage Revenue (billion), by Country 2025 & 2033
- Figure 48: Middle East & Africa Ride-on Luggage Volume (K), by Country 2025 & 2033
- Figure 49: Middle East & Africa Ride-on Luggage Revenue Share (%), by Country 2025 & 2033
- Figure 50: Middle East & Africa Ride-on Luggage Volume Share (%), by Country 2025 & 2033
- Figure 51: Asia Pacific Ride-on Luggage Revenue (billion), by Application 2025 & 2033
- Figure 52: Asia Pacific Ride-on Luggage Volume (K), by Application 2025 & 2033
- Figure 53: Asia Pacific Ride-on Luggage Revenue Share (%), by Application 2025 & 2033
- Figure 54: Asia Pacific Ride-on Luggage Volume Share (%), by Application 2025 & 2033
- Figure 55: Asia Pacific Ride-on Luggage Revenue (billion), by Types 2025 & 2033
- Figure 56: Asia Pacific Ride-on Luggage Volume (K), by Types 2025 & 2033
- Figure 57: Asia Pacific Ride-on Luggage Revenue Share (%), by Types 2025 & 2033
- Figure 58: Asia Pacific Ride-on Luggage Volume Share (%), by Types 2025 & 2033
- Figure 59: Asia Pacific Ride-on Luggage Revenue (billion), by Country 2025 & 2033
- Figure 60: Asia Pacific Ride-on Luggage Volume (K), by Country 2025 & 2033
- Figure 61: Asia Pacific Ride-on Luggage Revenue Share (%), by Country 2025 & 2033
- Figure 62: Asia Pacific Ride-on Luggage Volume Share (%), by Country 2025 & 2033
List of Tables
- Table 1: Global Ride-on Luggage Revenue billion Forecast, by Application 2020 & 2033
- Table 2: Global Ride-on Luggage Volume K Forecast, by Application 2020 & 2033
- Table 3: Global Ride-on Luggage Revenue billion Forecast, by Types 2020 & 2033
- Table 4: Global Ride-on Luggage Volume K Forecast, by Types 2020 & 2033
- Table 5: Global Ride-on Luggage Revenue billion Forecast, by Region 2020 & 2033
- Table 6: Global Ride-on Luggage Volume K Forecast, by Region 2020 & 2033
- Table 7: Global Ride-on Luggage Revenue billion Forecast, by Application 2020 & 2033
- Table 8: Global Ride-on Luggage Volume K Forecast, by Application 2020 & 2033
- Table 9: Global Ride-on Luggage Revenue billion Forecast, by Types 2020 & 2033
- Table 10: Global Ride-on Luggage Volume K Forecast, by Types 2020 & 2033
- Table 11: Global Ride-on Luggage Revenue billion Forecast, by Country 2020 & 2033
- Table 12: Global Ride-on Luggage Volume K Forecast, by Country 2020 & 2033
- Table 13: United States Ride-on Luggage Revenue (billion) Forecast, by Application 2020 & 2033
- Table 14: United States Ride-on Luggage Volume (K) Forecast, by Application 2020 & 2033
- Table 15: Canada Ride-on Luggage Revenue (billion) Forecast, by Application 2020 & 2033
- Table 16: Canada Ride-on Luggage Volume (K) Forecast, by Application 2020 & 2033
- Table 17: Mexico Ride-on Luggage Revenue (billion) Forecast, by Application 2020 & 2033
- Table 18: Mexico Ride-on Luggage Volume (K) Forecast, by Application 2020 & 2033
- Table 19: Global Ride-on Luggage Revenue billion Forecast, by Application 2020 & 2033
- Table 20: Global Ride-on Luggage Volume K Forecast, by Application 2020 & 2033
- Table 21: Global Ride-on Luggage Revenue billion Forecast, by Types 2020 & 2033
- Table 22: Global Ride-on Luggage Volume K Forecast, by Types 2020 & 2033
- Table 23: Global Ride-on Luggage Revenue billion Forecast, by Country 2020 & 2033
- Table 24: Global Ride-on Luggage Volume K Forecast, by Country 2020 & 2033
- Table 25: Brazil Ride-on Luggage Revenue (billion) Forecast, by Application 2020 & 2033
- Table 26: Brazil Ride-on Luggage Volume (K) Forecast, by Application 2020 & 2033
- Table 27: Argentina Ride-on Luggage Revenue (billion) Forecast, by Application 2020 & 2033
- Table 28: Argentina Ride-on Luggage Volume (K) Forecast, by Application 2020 & 2033
- Table 29: Rest of South America Ride-on Luggage Revenue (billion) Forecast, by Application 2020 & 2033
- Table 30: Rest of South America Ride-on Luggage Volume (K) Forecast, by Application 2020 & 2033
- Table 31: Global Ride-on Luggage Revenue billion Forecast, by Application 2020 & 2033
- Table 32: Global Ride-on Luggage Volume K Forecast, by Application 2020 & 2033
- Table 33: Global Ride-on Luggage Revenue billion Forecast, by Types 2020 & 2033
- Table 34: Global Ride-on Luggage Volume K Forecast, by Types 2020 & 2033
- Table 35: Global Ride-on Luggage Revenue billion Forecast, by Country 2020 & 2033
- Table 36: Global Ride-on Luggage Volume K Forecast, by Country 2020 & 2033
- Table 37: United Kingdom Ride-on Luggage Revenue (billion) Forecast, by Application 2020 & 2033
- Table 38: United Kingdom Ride-on Luggage Volume (K) Forecast, by Application 2020 & 2033
- Table 39: Germany Ride-on Luggage Revenue (billion) Forecast, by Application 2020 & 2033
- Table 40: Germany Ride-on Luggage Volume (K) Forecast, by Application 2020 & 2033
- Table 41: France Ride-on Luggage Revenue (billion) Forecast, by Application 2020 & 2033
- Table 42: France Ride-on Luggage Volume (K) Forecast, by Application 2020 & 2033
- Table 43: Italy Ride-on Luggage Revenue (billion) Forecast, by Application 2020 & 2033
- Table 44: Italy Ride-on Luggage Volume (K) Forecast, by Application 2020 & 2033
- Table 45: Spain Ride-on Luggage Revenue (billion) Forecast, by Application 2020 & 2033
- Table 46: Spain Ride-on Luggage Volume (K) Forecast, by Application 2020 & 2033
- Table 47: Russia Ride-on Luggage Revenue (billion) Forecast, by Application 2020 & 2033
- Table 48: Russia Ride-on Luggage Volume (K) Forecast, by Application 2020 & 2033
- Table 49: Benelux Ride-on Luggage Revenue (billion) Forecast, by Application 2020 & 2033
- Table 50: Benelux Ride-on Luggage Volume (K) Forecast, by Application 2020 & 2033
- Table 51: Nordics Ride-on Luggage Revenue (billion) Forecast, by Application 2020 & 2033
- Table 52: Nordics Ride-on Luggage Volume (K) Forecast, by Application 2020 & 2033
- Table 53: Rest of Europe Ride-on Luggage Revenue (billion) Forecast, by Application 2020 & 2033
- Table 54: Rest of Europe Ride-on Luggage Volume (K) Forecast, by Application 2020 & 2033
- Table 55: Global Ride-on Luggage Revenue billion Forecast, by Application 2020 & 2033
- Table 56: Global Ride-on Luggage Volume K Forecast, by Application 2020 & 2033
- Table 57: Global Ride-on Luggage Revenue billion Forecast, by Types 2020 & 2033
- Table 58: Global Ride-on Luggage Volume K Forecast, by Types 2020 & 2033
- Table 59: Global Ride-on Luggage Revenue billion Forecast, by Country 2020 & 2033
- Table 60: Global Ride-on Luggage Volume K Forecast, by Country 2020 & 2033
- Table 61: Turkey Ride-on Luggage Revenue (billion) Forecast, by Application 2020 & 2033
- Table 62: Turkey Ride-on Luggage Volume (K) Forecast, by Application 2020 & 2033
- Table 63: Israel Ride-on Luggage Revenue (billion) Forecast, by Application 2020 & 2033
- Table 64: Israel Ride-on Luggage Volume (K) Forecast, by Application 2020 & 2033
- Table 65: GCC Ride-on Luggage Revenue (billion) Forecast, by Application 2020 & 2033
- Table 66: GCC Ride-on Luggage Volume (K) Forecast, by Application 2020 & 2033
- Table 67: North Africa Ride-on Luggage Revenue (billion) Forecast, by Application 2020 & 2033
- Table 68: North Africa Ride-on Luggage Volume (K) Forecast, by Application 2020 & 2033
- Table 69: South Africa Ride-on Luggage Revenue (billion) Forecast, by Application 2020 & 2033
- Table 70: South Africa Ride-on Luggage Volume (K) Forecast, by Application 2020 & 2033
- Table 71: Rest of Middle East & Africa Ride-on Luggage Revenue (billion) Forecast, by Application 2020 & 2033
- Table 72: Rest of Middle East & Africa Ride-on Luggage Volume (K) Forecast, by Application 2020 & 2033
- Table 73: Global Ride-on Luggage Revenue billion Forecast, by Application 2020 & 2033
- Table 74: Global Ride-on Luggage Volume K Forecast, by Application 2020 & 2033
- Table 75: Global Ride-on Luggage Revenue billion Forecast, by Types 2020 & 2033
- Table 76: Global Ride-on Luggage Volume K Forecast, by Types 2020 & 2033
- Table 77: Global Ride-on Luggage Revenue billion Forecast, by Country 2020 & 2033
- Table 78: Global Ride-on Luggage Volume K Forecast, by Country 2020 & 2033
- Table 79: China Ride-on Luggage Revenue (billion) Forecast, by Application 2020 & 2033
- Table 80: China Ride-on Luggage Volume (K) Forecast, by Application 2020 & 2033
- Table 81: India Ride-on Luggage Revenue (billion) Forecast, by Application 2020 & 2033
- Table 82: India Ride-on Luggage Volume (K) Forecast, by Application 2020 & 2033
- Table 83: Japan Ride-on Luggage Revenue (billion) Forecast, by Application 2020 & 2033
- Table 84: Japan Ride-on Luggage Volume (K) Forecast, by Application 2020 & 2033
- Table 85: South Korea Ride-on Luggage Revenue (billion) Forecast, by Application 2020 & 2033
- Table 86: South Korea Ride-on Luggage Volume (K) Forecast, by Application 2020 & 2033
- Table 87: ASEAN Ride-on Luggage Revenue (billion) Forecast, by Application 2020 & 2033
- Table 88: ASEAN Ride-on Luggage Volume (K) Forecast, by Application 2020 & 2033
- Table 89: Oceania Ride-on Luggage Revenue (billion) Forecast, by Application 2020 & 2033
- Table 90: Oceania Ride-on Luggage Volume (K) Forecast, by Application 2020 & 2033
- Table 91: Rest of Asia Pacific Ride-on Luggage Revenue (billion) Forecast, by Application 2020 & 2033
- Table 92: Rest of Asia Pacific Ride-on Luggage Volume (K) Forecast, by Application 2020 & 2033
Frequently Asked Questions
1. What is the projected Compound Annual Growth Rate (CAGR) of the Ride-on Luggage?
The projected CAGR is approximately 9.95%.
2. Which companies are prominent players in the Ride-on Luggage?
Key companies in the market include Modobag, Younglinaz, MiaMily, Airwheel Holding, Kiddietotes, Micro Mobility, Olaf scooter, Rydebot, Trunki, Tucci Disegno, Changzhou AirWheel Intelligence Technology.
3. What are the main segments of the Ride-on Luggage?
The market segments include Application, Types.
4. Can you provide details about the market size?
The market size is estimated to be USD 25.44 billion as of 2022.
5. What are some drivers contributing to market growth?
N/A
6. What are the notable trends driving market growth?
N/A
7. Are there any restraints impacting market growth?
N/A
8. Can you provide examples of recent developments in the market?
N/A
9. What pricing options are available for accessing the report?
Pricing options include single-user, multi-user, and enterprise licenses priced at USD 4350.00, USD 6525.00, and USD 8700.00 respectively.
10. Is the market size provided in terms of value or volume?
The market size is provided in terms of value, measured in billion and volume, measured in K.
11. Are there any specific market keywords associated with the report?
Yes, the market keyword associated with the report is "Ride-on Luggage," which aids in identifying and referencing the specific market segment covered.
12. How do I determine which pricing option suits my needs best?
The pricing options vary based on user requirements and access needs. Individual users may opt for single-user licenses, while businesses requiring broader access may choose multi-user or enterprise licenses for cost-effective access to the report.
13. Are there any additional resources or data provided in the Ride-on Luggage report?
While the report offers comprehensive insights, it's advisable to review the specific contents or supplementary materials provided to ascertain if additional resources or data are available.
14. How can I stay updated on further developments or reports in the Ride-on Luggage?
To stay informed about further developments, trends, and reports in the Ride-on Luggage, consider subscribing to industry newsletters, following relevant companies and organizations, or regularly checking reputable industry news sources and publications.
Methodology
Step 1 - Identification of Relevant Samples Size from Population Database


Step 2 - Approaches for Defining Global Market Size (Value, Volume* & Price*)

Note*: In applicable scenarios
Step 3 - Data Sources
Primary Research
- Web Analytics
- Survey Reports
- Research Institute
- Latest Research Reports
- Opinion Leaders
Secondary Research
- Annual Reports
- White Paper
- Latest Press Release
- Industry Association
- Paid Database
- Investor Presentations

Step 4 - Data Triangulation
Involves using different sources of information in order to increase the validity of a study
These sources are likely to be stakeholders in a program - participants, other researchers, program staff, other community members, and so on.
Then we put all data in single framework & apply various statistical tools to find out the dynamic on the market.
During the analysis stage, feedback from the stakeholder groups would be compared to determine areas of agreement as well as areas of divergence