

Key Insights
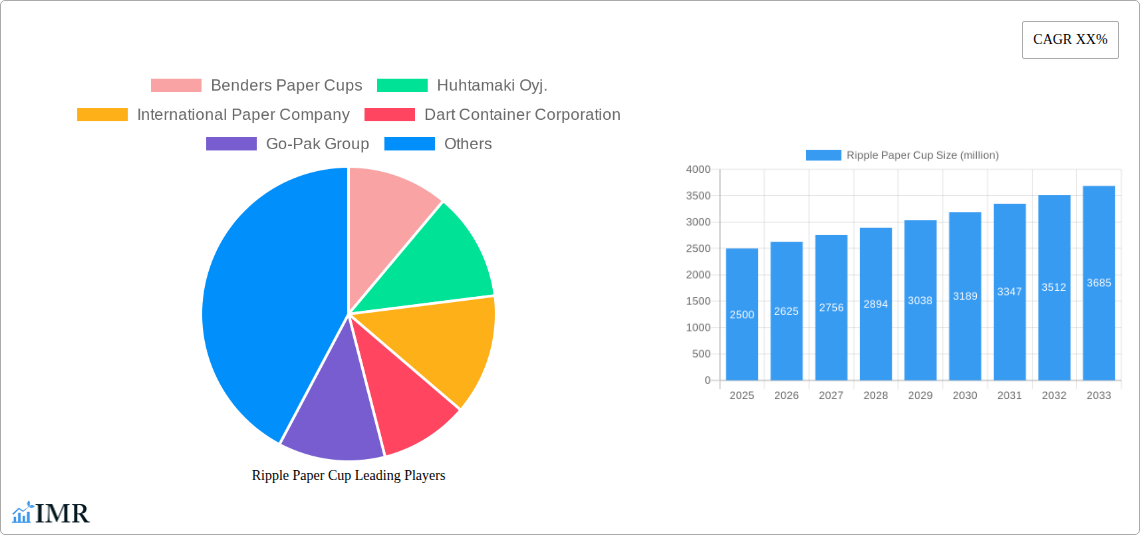
The global ripple paper cup market is poised for significant expansion, driven by escalating consumer preference for sustainable and convenient disposable tableware. The market, valued at $21.05 billion in the base year 2025, is projected to grow at a Compound Annual Growth Rate (CAGR) of 1.2% from 2025 to 2033. Key growth catalysts include the increasing prevalence of takeaway food and beverage services, particularly in densely populated urban centers. Growing environmental consciousness is fueling demand for eco-friendly alternatives to plastic, making ripple paper cups a preferred choice due to their biodegradable and compostable attributes. Technological advancements in paper cup manufacturing are enhancing product durability and aesthetic appeal, further stimulating market interest from consumers and businesses alike. Leading market participants are actively pursuing innovation and strategic expansion, with a focus on developing recyclable and compostable solutions to address pervasive environmental concerns. North America and Europe currently hold substantial market shares, while the Asia-Pacific region is anticipated to experience robust growth, propelled by rising disposable incomes and rapid urbanization.
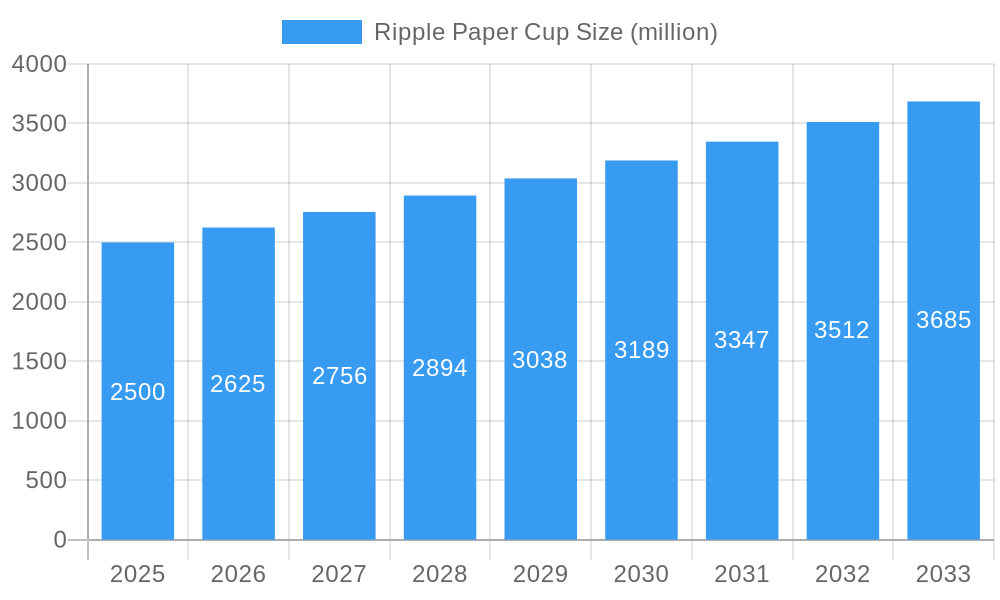
Ripple Paper Cup Market Size (In Billion)
Despite the positive growth trajectory, the market encounters certain challenges. Volatility in raw material prices, such as pulp and paper, can impact profitability. Competition from alternative biodegradable cup materials, including certain plastics, remains a notable factor. Additionally, stringent environmental regulations in select regions may present operational hurdles for manufacturers. Nevertheless, the long-term outlook for the ripple paper cup market remains highly favorable, underpinned by an ongoing commitment to sustainability, consistent consumer demand for convenience, and continuous industry innovation. Prominent companies, including Benders Paper Cups, Huhtamaki Oyj., International Paper Company, Dart Container Corporation, Go-Pak Group, Konie Cups International, Kap Cones, Eco-Products, Inc., Phoenix Packaging, Shanghai Xinyu Paper Cup, Nippon Paper Industries, Lolicup USA, Inc., and Genpak, are strategically positioned to leverage these trends through targeted investments in research and development, market expansion initiatives, and the adoption of sustainable manufacturing practices.
Ripple Paper Cup Company Market Share
This comprehensive market report offers an in-depth analysis of the global ripple paper cup market, covering market dynamics, growth trajectories, regional leadership, product segmentation, key industry players, and future projections. The analysis spans the period from 2019 to 2033, with 2025 designated as the base and estimated year. The forecast period extends from 2025 to 2033, with the historical period covering 2019-2024. This report is an indispensable resource for industry professionals, investors, and stakeholders seeking a thorough understanding of this dynamic market. The market is expected to reach xx million units by 2033.
Parent Market: Disposable Paper Cups Market Child Market: Specialized Paper Cups Market
Ripple Paper Cup Market Dynamics & Structure
This section analyzes the competitive landscape of the ripple paper cup market, considering market concentration, technological advancements, regulatory impacts, substitute products, end-user demographics, and merger & acquisition (M&A) activities. The market is moderately fragmented, with key players competing based on price, quality, and sustainability.
- Market Concentration: The top five players hold an estimated xx% market share in 2025. This indicates a moderately concentrated market with opportunities for both established players and new entrants.
- Technological Innovation: Advances in paper production, printing techniques, and biodegradable materials are driving innovation. However, high R&D costs and regulatory compliance pose barriers to entry for some smaller players.
- Regulatory Framework: Government regulations concerning food safety, environmental sustainability (biodegradability, recyclability), and labeling are significant factors impacting market growth and product development.
- Competitive Substitutes: Plastic cups, reusable cups, and other disposable beverage containers pose a competitive threat, particularly in price-sensitive segments.
- End-User Demographics: The primary end-users are food service establishments (restaurants, cafes, quick-service restaurants), catering services, and event organizers. Growth is driven by increasing disposable incomes and changing consumer preferences towards convenience.
- M&A Trends: The number of M&A deals in the ripple paper cup segment from 2019-2024 totaled approximately xx deals, with a focus on expanding market reach and enhancing product portfolios. The average deal size was approximately xx million USD.
Ripple Paper Cup Growth Trends & Insights
Leveraging comprehensive market research and data analysis, this section details the evolution of market size, adoption rates, technological disruptions, and consumer behavior shifts within the ripple paper cup market. The market has experienced a CAGR of xx% during the historical period (2019-2024), driven by factors such as rising disposable incomes, increasing demand from the food service industry, and growing consumer preference for eco-friendly alternatives. Market penetration is currently estimated at xx% in major regions. Technological disruptions, particularly in bio-based materials and sustainable manufacturing processes, are further accelerating market expansion. Shifting consumer preferences towards convenience and sustainability are fueling the demand for eco-friendly and innovative ripple paper cups.
Dominant Regions, Countries, or Segments in Ripple Paper Cup
North America is currently the dominant region, accounting for approximately xx% of the global market share in 2025. This dominance is attributed to:
- High Disposable Incomes: Strong consumer spending power drives demand for convenient food and beverage packaging.
- Well-Established Food Service Sector: A large and established quick-service restaurant and catering industry fuels demand for ripple paper cups.
- Favorable Regulatory Environment: Relatively progressive regulations regarding biodegradability and recyclability promote innovation in eco-friendly packaging.
Asia-Pacific is projected to witness the fastest growth during the forecast period (2025-2033), due to rapid economic growth, urbanization, and increasing adoption of Western-style food consumption habits.
Ripple Paper Cup Product Landscape
The ripple paper cup market offers a range of products differentiated by size, capacity, printing capabilities, and materials used. Innovations focus on enhanced insulation, leak-proof designs, and the use of recycled and biodegradable materials. Unique selling propositions include improved aesthetics, functionality, and eco-friendly attributes. Technological advancements, such as improved coating techniques and sustainable material sourcing, are key drivers of product differentiation.
Key Drivers, Barriers & Challenges in Ripple Paper Cup
Key Drivers:
- Increasing demand from the food service industry.
- Growing consumer preference for convenient and eco-friendly packaging.
- Technological advancements in biodegradable and recyclable materials.
Key Challenges & Restraints:
- Fluctuations in raw material prices (e.g., pulp).
- Stringent environmental regulations and compliance costs.
- Competition from other disposable cup materials (plastic, etc.). The projected impact of this competition is estimated to reduce market growth by xx% by 2033.
Emerging Opportunities in Ripple Paper Cup
- Expanding into untapped markets, particularly in developing economies.
- Development of innovative cup designs with enhanced functionality (e.g., improved insulation, leak-proof lids).
- Growing demand for custom-printed ripple paper cups for branding and promotional purposes.
Growth Accelerators in the Ripple Paper Cup Industry
Strategic partnerships between manufacturers and food service chains are driving market growth. Furthermore, technological breakthroughs in biodegradable materials and improved manufacturing processes are increasing efficiency and reducing production costs, creating further growth opportunities. Expansion into new markets and diverse applications are additional long-term growth catalysts.
Key Players Shaping the Ripple Paper Cup Market
- Benders Paper Cups
- Huhtamaki Oyj.
- International Paper Company
- Dart Container Corporation
- Go-Pak Group
- Konie Cups International
- Kap Cones
- Eco-Products, Inc.
- Phoenix Packaging
- Shanghai Xinyu Paper Cup
- Nippon Paper Industries
- Lolicup USA, Inc.
- Genpak
Notable Milestones in Ripple Paper Cup Sector
- 2020/Q3: Introduction of a fully compostable ripple paper cup by Eco-Products.
- 2022/Q1: Huhtamaki Oyj. announced a significant investment in expanding its biodegradable packaging production capacity.
- 2023/Q2: Dart Container Corporation launched a new line of ripple cups with improved insulation properties.
In-Depth Ripple Paper Cup Market Outlook
The ripple paper cup market is poised for continued growth, driven by ongoing demand from the food service industry, increasing consumer awareness of sustainability issues, and ongoing technological innovations. Strategic partnerships, expansion into new markets, and the development of innovative products are key factors that will shape the future of this dynamic market. The market is expected to experience a healthy CAGR of xx% during the forecast period (2025-2033), reaching a market size of xx million units by 2033. The focus on sustainability will continue to be a major driver, with increasing adoption of biodegradable and recyclable materials.
Ripple Paper Cup Segmentation
-
1. Application
- 1.1. Online Sales
- 1.2. Offline Sales
-
2. Types
- 2.1. Single-Wall
- 2.2. Double-Wall
- 2.3. Triple-Wall
Ripple Paper Cup Segmentation By Geography
-
1. North America
- 1.1. United States
- 1.2. Canada
- 1.3. Mexico
-
2. South America
- 2.1. Brazil
- 2.2. Argentina
- 2.3. Rest of South America
-
3. Europe
- 3.1. United Kingdom
- 3.2. Germany
- 3.3. France
- 3.4. Italy
- 3.5. Spain
- 3.6. Russia
- 3.7. Benelux
- 3.8. Nordics
- 3.9. Rest of Europe
-
4. Middle East & Africa
- 4.1. Turkey
- 4.2. Israel
- 4.3. GCC
- 4.4. North Africa
- 4.5. South Africa
- 4.6. Rest of Middle East & Africa
-
5. Asia Pacific
- 5.1. China
- 5.2. India
- 5.3. Japan
- 5.4. South Korea
- 5.5. ASEAN
- 5.6. Oceania
- 5.7. Rest of Asia Pacific

Ripple Paper Cup Regional Market Share
Geographic Coverage of Ripple Paper Cup
Ripple Paper Cup REPORT HIGHLIGHTS
| Aspects | Details |
|---|---|
| Study Period | 2020-2034 |
| Base Year | 2025 |
| Estimated Year | 2026 |
| Forecast Period | 2026-2034 |
| Historical Period | 2020-2025 |
| Growth Rate | CAGR of 1.2% from 2020-2034 |
| Segmentation |
|
Table of Contents
- 1. Introduction
- 1.1. Research Scope
- 1.2. Market Segmentation
- 1.3. Research Methodology
- 1.4. Definitions and Assumptions
- 2. Executive Summary
- 2.1. Introduction
- 3. Market Dynamics
- 3.1. Introduction
- 3.2. Market Drivers
- 3.3. Market Restrains
- 3.4. Market Trends
- 4. Market Factor Analysis
- 4.1. Porters Five Forces
- 4.2. Supply/Value Chain
- 4.3. PESTEL analysis
- 4.4. Market Entropy
- 4.5. Patent/Trademark Analysis
- 5. Global Ripple Paper Cup Analysis, Insights and Forecast, 2020-2032
- 5.1. Market Analysis, Insights and Forecast - by Application
- 5.1.1. Online Sales
- 5.1.2. Offline Sales
- 5.2. Market Analysis, Insights and Forecast - by Types
- 5.2.1. Single-Wall
- 5.2.2. Double-Wall
- 5.2.3. Triple-Wall
- 5.3. Market Analysis, Insights and Forecast - by Region
- 5.3.1. North America
- 5.3.2. South America
- 5.3.3. Europe
- 5.3.4. Middle East & Africa
- 5.3.5. Asia Pacific
- 5.1. Market Analysis, Insights and Forecast - by Application
- 6. North America Ripple Paper Cup Analysis, Insights and Forecast, 2020-2032
- 6.1. Market Analysis, Insights and Forecast - by Application
- 6.1.1. Online Sales
- 6.1.2. Offline Sales
- 6.2. Market Analysis, Insights and Forecast - by Types
- 6.2.1. Single-Wall
- 6.2.2. Double-Wall
- 6.2.3. Triple-Wall
- 6.1. Market Analysis, Insights and Forecast - by Application
- 7. South America Ripple Paper Cup Analysis, Insights and Forecast, 2020-2032
- 7.1. Market Analysis, Insights and Forecast - by Application
- 7.1.1. Online Sales
- 7.1.2. Offline Sales
- 7.2. Market Analysis, Insights and Forecast - by Types
- 7.2.1. Single-Wall
- 7.2.2. Double-Wall
- 7.2.3. Triple-Wall
- 7.1. Market Analysis, Insights and Forecast - by Application
- 8. Europe Ripple Paper Cup Analysis, Insights and Forecast, 2020-2032
- 8.1. Market Analysis, Insights and Forecast - by Application
- 8.1.1. Online Sales
- 8.1.2. Offline Sales
- 8.2. Market Analysis, Insights and Forecast - by Types
- 8.2.1. Single-Wall
- 8.2.2. Double-Wall
- 8.2.3. Triple-Wall
- 8.1. Market Analysis, Insights and Forecast - by Application
- 9. Middle East & Africa Ripple Paper Cup Analysis, Insights and Forecast, 2020-2032
- 9.1. Market Analysis, Insights and Forecast - by Application
- 9.1.1. Online Sales
- 9.1.2. Offline Sales
- 9.2. Market Analysis, Insights and Forecast - by Types
- 9.2.1. Single-Wall
- 9.2.2. Double-Wall
- 9.2.3. Triple-Wall
- 9.1. Market Analysis, Insights and Forecast - by Application
- 10. Asia Pacific Ripple Paper Cup Analysis, Insights and Forecast, 2020-2032
- 10.1. Market Analysis, Insights and Forecast - by Application
- 10.1.1. Online Sales
- 10.1.2. Offline Sales
- 10.2. Market Analysis, Insights and Forecast - by Types
- 10.2.1. Single-Wall
- 10.2.2. Double-Wall
- 10.2.3. Triple-Wall
- 10.1. Market Analysis, Insights and Forecast - by Application
- 11. Competitive Analysis
- 11.1. Global Market Share Analysis 2025
- 11.2. Company Profiles
- 11.2.1 Benders Paper Cups
- 11.2.1.1. Overview
- 11.2.1.2. Products
- 11.2.1.3. SWOT Analysis
- 11.2.1.4. Recent Developments
- 11.2.1.5. Financials (Based on Availability)
- 11.2.2 Huhtamaki Oyj.
- 11.2.2.1. Overview
- 11.2.2.2. Products
- 11.2.2.3. SWOT Analysis
- 11.2.2.4. Recent Developments
- 11.2.2.5. Financials (Based on Availability)
- 11.2.3 International Paper Company
- 11.2.3.1. Overview
- 11.2.3.2. Products
- 11.2.3.3. SWOT Analysis
- 11.2.3.4. Recent Developments
- 11.2.3.5. Financials (Based on Availability)
- 11.2.4 Dart Container Corporation
- 11.2.4.1. Overview
- 11.2.4.2. Products
- 11.2.4.3. SWOT Analysis
- 11.2.4.4. Recent Developments
- 11.2.4.5. Financials (Based on Availability)
- 11.2.5 Go-Pak Group
- 11.2.5.1. Overview
- 11.2.5.2. Products
- 11.2.5.3. SWOT Analysis
- 11.2.5.4. Recent Developments
- 11.2.5.5. Financials (Based on Availability)
- 11.2.6 Konie Cups International
- 11.2.6.1. Overview
- 11.2.6.2. Products
- 11.2.6.3. SWOT Analysis
- 11.2.6.4. Recent Developments
- 11.2.6.5. Financials (Based on Availability)
- 11.2.7 Kap Cones
- 11.2.7.1. Overview
- 11.2.7.2. Products
- 11.2.7.3. SWOT Analysis
- 11.2.7.4. Recent Developments
- 11.2.7.5. Financials (Based on Availability)
- 11.2.8 Eco-Products
- 11.2.8.1. Overview
- 11.2.8.2. Products
- 11.2.8.3. SWOT Analysis
- 11.2.8.4. Recent Developments
- 11.2.8.5. Financials (Based on Availability)
- 11.2.9 Inc.
- 11.2.9.1. Overview
- 11.2.9.2. Products
- 11.2.9.3. SWOT Analysis
- 11.2.9.4. Recent Developments
- 11.2.9.5. Financials (Based on Availability)
- 11.2.10 Phoenix Packaging
- 11.2.10.1. Overview
- 11.2.10.2. Products
- 11.2.10.3. SWOT Analysis
- 11.2.10.4. Recent Developments
- 11.2.10.5. Financials (Based on Availability)
- 11.2.11 Shanghai Xinyu Paper Cup
- 11.2.11.1. Overview
- 11.2.11.2. Products
- 11.2.11.3. SWOT Analysis
- 11.2.11.4. Recent Developments
- 11.2.11.5. Financials (Based on Availability)
- 11.2.12 Nippon Paper Industries
- 11.2.12.1. Overview
- 11.2.12.2. Products
- 11.2.12.3. SWOT Analysis
- 11.2.12.4. Recent Developments
- 11.2.12.5. Financials (Based on Availability)
- 11.2.13 Lolicup USA
- 11.2.13.1. Overview
- 11.2.13.2. Products
- 11.2.13.3. SWOT Analysis
- 11.2.13.4. Recent Developments
- 11.2.13.5. Financials (Based on Availability)
- 11.2.14 Inc.
- 11.2.14.1. Overview
- 11.2.14.2. Products
- 11.2.14.3. SWOT Analysis
- 11.2.14.4. Recent Developments
- 11.2.14.5. Financials (Based on Availability)
- 11.2.15 Genpak
- 11.2.15.1. Overview
- 11.2.15.2. Products
- 11.2.15.3. SWOT Analysis
- 11.2.15.4. Recent Developments
- 11.2.15.5. Financials (Based on Availability)
- 11.2.1 Benders Paper Cups
List of Figures
- Figure 1: Global Ripple Paper Cup Revenue Breakdown (billion, %) by Region 2025 & 2033
- Figure 2: North America Ripple Paper Cup Revenue (billion), by Application 2025 & 2033
- Figure 3: North America Ripple Paper Cup Revenue Share (%), by Application 2025 & 2033
- Figure 4: North America Ripple Paper Cup Revenue (billion), by Types 2025 & 2033
- Figure 5: North America Ripple Paper Cup Revenue Share (%), by Types 2025 & 2033
- Figure 6: North America Ripple Paper Cup Revenue (billion), by Country 2025 & 2033
- Figure 7: North America Ripple Paper Cup Revenue Share (%), by Country 2025 & 2033
- Figure 8: South America Ripple Paper Cup Revenue (billion), by Application 2025 & 2033
- Figure 9: South America Ripple Paper Cup Revenue Share (%), by Application 2025 & 2033
- Figure 10: South America Ripple Paper Cup Revenue (billion), by Types 2025 & 2033
- Figure 11: South America Ripple Paper Cup Revenue Share (%), by Types 2025 & 2033
- Figure 12: South America Ripple Paper Cup Revenue (billion), by Country 2025 & 2033
- Figure 13: South America Ripple Paper Cup Revenue Share (%), by Country 2025 & 2033
- Figure 14: Europe Ripple Paper Cup Revenue (billion), by Application 2025 & 2033
- Figure 15: Europe Ripple Paper Cup Revenue Share (%), by Application 2025 & 2033
- Figure 16: Europe Ripple Paper Cup Revenue (billion), by Types 2025 & 2033
- Figure 17: Europe Ripple Paper Cup Revenue Share (%), by Types 2025 & 2033
- Figure 18: Europe Ripple Paper Cup Revenue (billion), by Country 2025 & 2033
- Figure 19: Europe Ripple Paper Cup Revenue Share (%), by Country 2025 & 2033
- Figure 20: Middle East & Africa Ripple Paper Cup Revenue (billion), by Application 2025 & 2033
- Figure 21: Middle East & Africa Ripple Paper Cup Revenue Share (%), by Application 2025 & 2033
- Figure 22: Middle East & Africa Ripple Paper Cup Revenue (billion), by Types 2025 & 2033
- Figure 23: Middle East & Africa Ripple Paper Cup Revenue Share (%), by Types 2025 & 2033
- Figure 24: Middle East & Africa Ripple Paper Cup Revenue (billion), by Country 2025 & 2033
- Figure 25: Middle East & Africa Ripple Paper Cup Revenue Share (%), by Country 2025 & 2033
- Figure 26: Asia Pacific Ripple Paper Cup Revenue (billion), by Application 2025 & 2033
- Figure 27: Asia Pacific Ripple Paper Cup Revenue Share (%), by Application 2025 & 2033
- Figure 28: Asia Pacific Ripple Paper Cup Revenue (billion), by Types 2025 & 2033
- Figure 29: Asia Pacific Ripple Paper Cup Revenue Share (%), by Types 2025 & 2033
- Figure 30: Asia Pacific Ripple Paper Cup Revenue (billion), by Country 2025 & 2033
- Figure 31: Asia Pacific Ripple Paper Cup Revenue Share (%), by Country 2025 & 2033
List of Tables
- Table 1: Global Ripple Paper Cup Revenue billion Forecast, by Application 2020 & 2033
- Table 2: Global Ripple Paper Cup Revenue billion Forecast, by Types 2020 & 2033
- Table 3: Global Ripple Paper Cup Revenue billion Forecast, by Region 2020 & 2033
- Table 4: Global Ripple Paper Cup Revenue billion Forecast, by Application 2020 & 2033
- Table 5: Global Ripple Paper Cup Revenue billion Forecast, by Types 2020 & 2033
- Table 6: Global Ripple Paper Cup Revenue billion Forecast, by Country 2020 & 2033
- Table 7: United States Ripple Paper Cup Revenue (billion) Forecast, by Application 2020 & 2033
- Table 8: Canada Ripple Paper Cup Revenue (billion) Forecast, by Application 2020 & 2033
- Table 9: Mexico Ripple Paper Cup Revenue (billion) Forecast, by Application 2020 & 2033
- Table 10: Global Ripple Paper Cup Revenue billion Forecast, by Application 2020 & 2033
- Table 11: Global Ripple Paper Cup Revenue billion Forecast, by Types 2020 & 2033
- Table 12: Global Ripple Paper Cup Revenue billion Forecast, by Country 2020 & 2033
- Table 13: Brazil Ripple Paper Cup Revenue (billion) Forecast, by Application 2020 & 2033
- Table 14: Argentina Ripple Paper Cup Revenue (billion) Forecast, by Application 2020 & 2033
- Table 15: Rest of South America Ripple Paper Cup Revenue (billion) Forecast, by Application 2020 & 2033
- Table 16: Global Ripple Paper Cup Revenue billion Forecast, by Application 2020 & 2033
- Table 17: Global Ripple Paper Cup Revenue billion Forecast, by Types 2020 & 2033
- Table 18: Global Ripple Paper Cup Revenue billion Forecast, by Country 2020 & 2033
- Table 19: United Kingdom Ripple Paper Cup Revenue (billion) Forecast, by Application 2020 & 2033
- Table 20: Germany Ripple Paper Cup Revenue (billion) Forecast, by Application 2020 & 2033
- Table 21: France Ripple Paper Cup Revenue (billion) Forecast, by Application 2020 & 2033
- Table 22: Italy Ripple Paper Cup Revenue (billion) Forecast, by Application 2020 & 2033
- Table 23: Spain Ripple Paper Cup Revenue (billion) Forecast, by Application 2020 & 2033
- Table 24: Russia Ripple Paper Cup Revenue (billion) Forecast, by Application 2020 & 2033
- Table 25: Benelux Ripple Paper Cup Revenue (billion) Forecast, by Application 2020 & 2033
- Table 26: Nordics Ripple Paper Cup Revenue (billion) Forecast, by Application 2020 & 2033
- Table 27: Rest of Europe Ripple Paper Cup Revenue (billion) Forecast, by Application 2020 & 2033
- Table 28: Global Ripple Paper Cup Revenue billion Forecast, by Application 2020 & 2033
- Table 29: Global Ripple Paper Cup Revenue billion Forecast, by Types 2020 & 2033
- Table 30: Global Ripple Paper Cup Revenue billion Forecast, by Country 2020 & 2033
- Table 31: Turkey Ripple Paper Cup Revenue (billion) Forecast, by Application 2020 & 2033
- Table 32: Israel Ripple Paper Cup Revenue (billion) Forecast, by Application 2020 & 2033
- Table 33: GCC Ripple Paper Cup Revenue (billion) Forecast, by Application 2020 & 2033
- Table 34: North Africa Ripple Paper Cup Revenue (billion) Forecast, by Application 2020 & 2033
- Table 35: South Africa Ripple Paper Cup Revenue (billion) Forecast, by Application 2020 & 2033
- Table 36: Rest of Middle East & Africa Ripple Paper Cup Revenue (billion) Forecast, by Application 2020 & 2033
- Table 37: Global Ripple Paper Cup Revenue billion Forecast, by Application 2020 & 2033
- Table 38: Global Ripple Paper Cup Revenue billion Forecast, by Types 2020 & 2033
- Table 39: Global Ripple Paper Cup Revenue billion Forecast, by Country 2020 & 2033
- Table 40: China Ripple Paper Cup Revenue (billion) Forecast, by Application 2020 & 2033
- Table 41: India Ripple Paper Cup Revenue (billion) Forecast, by Application 2020 & 2033
- Table 42: Japan Ripple Paper Cup Revenue (billion) Forecast, by Application 2020 & 2033
- Table 43: South Korea Ripple Paper Cup Revenue (billion) Forecast, by Application 2020 & 2033
- Table 44: ASEAN Ripple Paper Cup Revenue (billion) Forecast, by Application 2020 & 2033
- Table 45: Oceania Ripple Paper Cup Revenue (billion) Forecast, by Application 2020 & 2033
- Table 46: Rest of Asia Pacific Ripple Paper Cup Revenue (billion) Forecast, by Application 2020 & 2033
Frequently Asked Questions
1. What is the projected Compound Annual Growth Rate (CAGR) of the Ripple Paper Cup?
The projected CAGR is approximately 1.2%.
2. Which companies are prominent players in the Ripple Paper Cup?
Key companies in the market include Benders Paper Cups, Huhtamaki Oyj., International Paper Company, Dart Container Corporation, Go-Pak Group, Konie Cups International, Kap Cones, Eco-Products, Inc., Phoenix Packaging, Shanghai Xinyu Paper Cup, Nippon Paper Industries, Lolicup USA, Inc., Genpak.
3. What are the main segments of the Ripple Paper Cup?
The market segments include Application, Types.
4. Can you provide details about the market size?
The market size is estimated to be USD 21.05 billion as of 2022.
5. What are some drivers contributing to market growth?
N/A
6. What are the notable trends driving market growth?
N/A
7. Are there any restraints impacting market growth?
N/A
8. Can you provide examples of recent developments in the market?
N/A
9. What pricing options are available for accessing the report?
Pricing options include single-user, multi-user, and enterprise licenses priced at USD 2900.00, USD 4350.00, and USD 5800.00 respectively.
10. Is the market size provided in terms of value or volume?
The market size is provided in terms of value, measured in billion.
11. Are there any specific market keywords associated with the report?
Yes, the market keyword associated with the report is "Ripple Paper Cup," which aids in identifying and referencing the specific market segment covered.
12. How do I determine which pricing option suits my needs best?
The pricing options vary based on user requirements and access needs. Individual users may opt for single-user licenses, while businesses requiring broader access may choose multi-user or enterprise licenses for cost-effective access to the report.
13. Are there any additional resources or data provided in the Ripple Paper Cup report?
While the report offers comprehensive insights, it's advisable to review the specific contents or supplementary materials provided to ascertain if additional resources or data are available.
14. How can I stay updated on further developments or reports in the Ripple Paper Cup?
To stay informed about further developments, trends, and reports in the Ripple Paper Cup, consider subscribing to industry newsletters, following relevant companies and organizations, or regularly checking reputable industry news sources and publications.
Methodology
Step 1 - Identification of Relevant Samples Size from Population Database


Step 2 - Approaches for Defining Global Market Size (Value, Volume* & Price*)

Note*: In applicable scenarios
Step 3 - Data Sources
Primary Research
- Web Analytics
- Survey Reports
- Research Institute
- Latest Research Reports
- Opinion Leaders
Secondary Research
- Annual Reports
- White Paper
- Latest Press Release
- Industry Association
- Paid Database
- Investor Presentations

Step 4 - Data Triangulation
Involves using different sources of information in order to increase the validity of a study
These sources are likely to be stakeholders in a program - participants, other researchers, program staff, other community members, and so on.
Then we put all data in single framework & apply various statistical tools to find out the dynamic on the market.
During the analysis stage, feedback from the stakeholder groups would be compared to determine areas of agreement as well as areas of divergence