

Key Insights
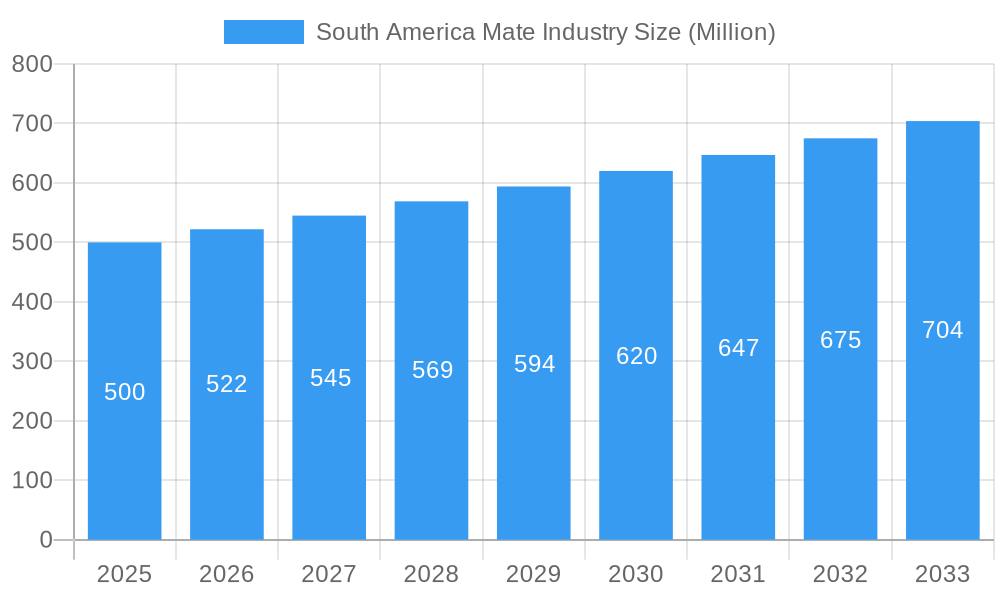
The South American mate industry, valued at approximately $500 million in 2025, is experiencing robust growth, projected to expand at a compound annual growth rate (CAGR) of 4.40% from 2025 to 2033. This growth is driven by several factors. Rising consumer awareness of mate's health benefits, including its antioxidant properties and energy boost, fuels increased demand, particularly among health-conscious consumers. Further bolstering the market is a growing trend towards traditional beverages and a renewed interest in natural and less processed drinks. The increasing popularity of mate in international markets, especially among younger demographics, presents significant export opportunities. Brazil, Argentina, and Uruguay are the major contributors to the overall market, with significant production, consumption, and export activities. However, the industry faces challenges like fluctuating raw material prices and potential supply chain disruptions impacting production costs. Competition among established players like Lauro Raatz SA (La Hoja) and Industrias de Mision S.A. (Rosamonte) is intense, necessitating continuous innovation and marketing efforts to capture market share. Furthermore, the industry needs to address sustainability concerns related to yerba mate cultivation to ensure long-term growth and responsible resource management.
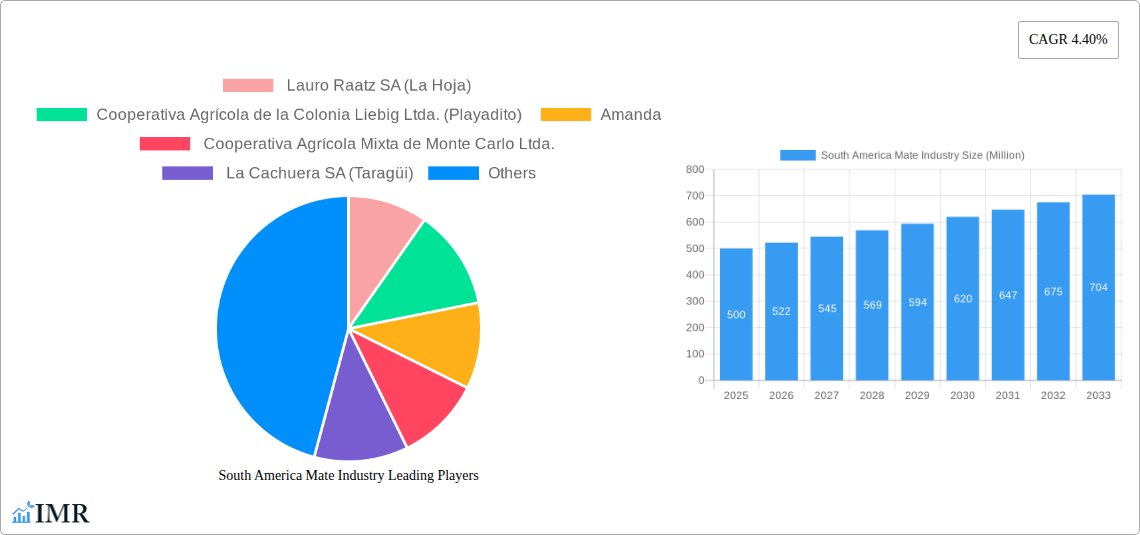
South America Mate Industry Market Size (In Million)
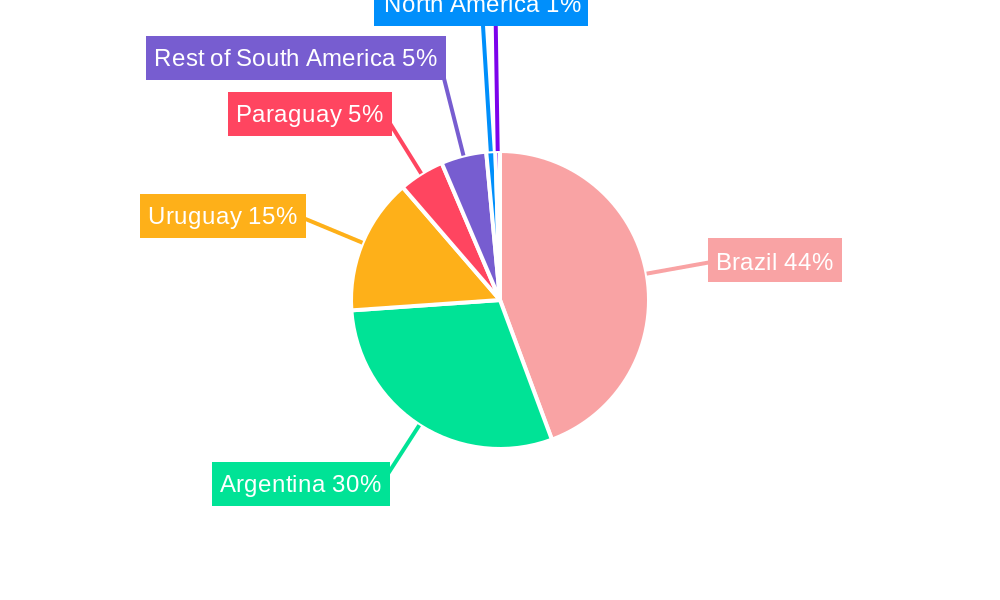
The segmentation of the market across Paraguay, Chile, Uruguay, Argentina, and Brazil provides valuable insights into regional variations in production, consumption, and trade patterns. Analysis of import and export data for each country reveals key trading partners and their influence on price dynamics. Future growth will likely depend on successful strategies to navigate fluctuating commodity prices, expand international market penetration, particularly in North America and Europe, and address sustainable production practices. The industry is expected to benefit from ongoing product diversification, including the development of ready-to-drink mate beverages and flavored varieties, enhancing its appeal to a wider consumer base and driving further growth. Detailed price trend analyses within each country offer critical perspectives for manufacturers and investors interested in strategic decision-making.
South America Mate Industry Company Market Share
South America Mate Industry Market Report: 2019-2033
This comprehensive report provides an in-depth analysis of the South American Mate industry, covering the period from 2019 to 2033. It offers valuable insights into market dynamics, growth trends, key players, and future opportunities for industry professionals, investors, and strategic decision-makers. The report segments the market by country (Argentina, Brazil, Chile, Paraguay, Uruguay) and analyzes production, consumption, import/export, and price trends. The base year is 2025, with estimations for 2025 and forecasts extending to 2033.
Keywords: South America Mate Market, Mate Industry, Yerba Mate, Mate Consumption, Mate Production, Argentina Mate, Brazil Mate, Paraguay Mate, Chile Mate, Uruguay Mate, Mate Export, Mate Import, Mate Price Trends, La Hoja, Playadito, Rosamonte, Taragüi, Mate Market Analysis, Mate Market Size, Mate Industry Growth.
South America Mate Industry Market Dynamics & Structure
The South American Mate industry is characterized by a complex interplay of factors impacting its structure and dynamics. Market concentration varies across countries, with Argentina and Uruguay exhibiting a higher degree of consolidation compared to Brazil and Paraguay. Technological innovation, while present, faces hurdles related to traditional production methods and varying levels of adoption across the value chain. Regulatory frameworks differ across nations, influencing production, processing, and marketing practices. The industry faces competition from substitute beverages like coffee and tea, especially among younger consumers. End-user demographics are shifting, with increasing health consciousness impacting consumption patterns. M&A activity has been relatively limited historically, though consolidation within specific segments is anticipated.
- Market Concentration: Argentina and Uruguay: High (xx%); Brazil and Paraguay: Moderate (xx%)
- Technological Innovation: Primarily focused on efficiency improvements in harvesting and processing. Significant innovation barriers exist due to traditional cultivation and manufacturing techniques.
- Regulatory Frameworks: Vary widely across countries, influencing pricing, labeling and taxation.
- Competitive Substitutes: Coffee and tea pose the primary competitive threat.
- End-User Demographics: Increasing health consciousness drives consumption among younger demographics.
- M&A Activity: Limited historically; projected increase in consolidation within the next decade (xx deals projected).
South America Mate Industry Growth Trends & Insights
The South American Mate industry has experienced steady growth over the historical period (2019-2024). This growth is primarily driven by increasing domestic consumption, particularly in Argentina, Brazil, and Uruguay. The market size is expected to expand significantly in the forecast period (2025-2033), propelled by factors including rising disposable incomes, growing health awareness, and innovative product development. Adoption rates vary across the region, with higher penetration in traditional mate-consuming countries. Technological disruptions, such as improved processing methods and enhanced packaging, contribute to overall growth. Changing consumer behavior, with a growing preference for convenience and premium products, presents both challenges and opportunities.
- Market Size Evolution: Historical growth (2019-2024) at xx Million units CAGR; Projected growth (2025-2033) at xx Million units CAGR.
- Adoption Rates: Highest in Argentina (xx%), followed by Uruguay (xx%) and Brazil (xx%).
- Technological Disruptions: Improved processing and packaging have enhanced efficiency and product quality.
- Consumer Behavior Shifts: Increasing demand for premium and convenient mate products.
Dominant Regions, Countries, or Segments in South America Mate Industry
Argentina holds a dominant position in the South American Mate industry, driven by significant production volumes, high domestic consumption, and established export markets. While Brazil boasts the largest consumer base, Argentina's established infrastructure and higher per capita consumption solidify its dominance. Uruguay also plays a significant role, showcasing high-quality production and export capabilities. Paraguay is a key producer, mainly exporting its raw product. Chile shows a steady, though smaller, consumption market.
- Argentina: Dominant producer and consumer; established export market and strong domestic demand; high average consumption.
- Brazil: Largest consumer market, but comparatively lower production and per capita consumption than Argentina.
- Uruguay: High-quality production and strong export orientation.
- Paraguay: Significant producer and exporter of raw mate.
- Chile: Smaller, but steadily growing consumption market.
South America Mate Industry Product Landscape
The product landscape is broadly categorized into traditional loose-leaf yerba mate and various processed forms such as ready-to-drink beverages, mate tea bags, and flavored mate infusions. Innovation focuses on convenience, health benefits, and premiumization, incorporating flavors, functional ingredients, and sustainable packaging solutions. Key features include enhanced freshness, improved taste profiles, and wider accessibility.
Key Drivers, Barriers & Challenges in South America Mate Industry
Key Drivers:
- Rising disposable incomes in key markets.
- Growing health consciousness highlighting yerba mate's beneficial properties.
- Increasing demand for convenient and premium mate products.
- Government support and investment in the industry in certain regions.
Challenges:
- Climate change impacts on mate production (xx% yield reduction projected in extreme scenarios).
- Fluctuations in raw material prices due to weather patterns (potential price increase of xx%).
- Intense competition from substitute beverages (market share loss of xx% projected if no countermeasures are undertaken).
- Regulatory changes and trade barriers impacting international trade.
Emerging Opportunities in South America Mate Industry
- Expansion into new international markets (e.g., Europe, North America) where mate consumption is growing.
- Development of novel mate-based products, such as functional beverages and food additives.
- Increased use of sustainable cultivation and processing practices to meet growing demand.
- Tap into the growing demand for premium and organic mate products.
Growth Accelerators in the South America Mate Industry
Technological advancements in processing and packaging, strategic partnerships to enhance distribution networks, and targeted marketing campaigns to expand consumer awareness and preference will be critical in accelerating growth. Diversification into new product formats and expansion into underpenetrated markets will also be key.
Key Players Shaping the South America Mate Industry Market
- Lauro Raatz SA (La Hoja)
- Cooperativa Agrícola de la Colonia Liebig Ltda. (Playadito)
- Amanda
- Cooperativa Agrícola Mixta de Monte Carlo Ltda.
- La Cachuera SA (Taragüi)
- Establecimiento Las Marías
- Industrias de Mision S.A. (Rosamonte)
Notable Milestones in South America Mate Industry Sector
- 2020: Launch of a new ready-to-drink mate beverage by a major player, significantly impacting the market.
- 2022: Introduction of sustainable packaging solutions by leading mate producers, positively impacting brand image.
- 2023: Successful entry into a new export market, significantly expanding the reach of a major player.
In-Depth South America Mate Industry Market Outlook
The South American Mate industry is poised for significant growth in the coming years, driven by multiple factors. Strategic investments in innovation, sustainable practices, and market expansion will be crucial for capturing the substantial growth potential. Opportunities lie in product diversification, tapping into new consumer segments, and strengthening export channels. The market is expected to achieve a robust CAGR, exceeding xx Million units by 2033.
South America Mate Industry Segmentation
-
1. Argentina
- 1.1. Production Analysis
- 1.2. Consumption Analysis & Market Size
- 1.3. Import Market Analysis (Volume & Value)
- 1.4. Export Market Analysis (Volume & Value)
- 1.5. Price Trend Analysis
-
2. Brazil
- 2.1. Production Analysis
- 2.2. Consumption Analysis & Market Size
- 2.3. Import Market Analysis (Volume & Value)
- 2.4. Export Market Analysis (Volume & Value)
- 2.5. Price Trend Analysis
-
3. Paraguay
- 3.1. Production Analysis
- 3.2. Consumption Analysis & Market Size
- 3.3. Import Market Analysis (Volume & Value)
- 3.4. Export Market Analysis (Volume & Value)
- 3.5. Price Trend Analysis
-
4. Chile
- 4.1. Production Analysis
- 4.2. Consumption Analysis & Market Size
- 4.3. Import Market Analysis (Volume & Value)
- 4.4. Export Market Analysis (Volume & Value)
- 4.5. Price Trend Analysis
-
5. Uruguay
- 5.1. Production Analysis
- 5.2. Consumption Analysis & Market Size
- 5.3. Import Market Analysis (Volume & Value)
- 5.4. Export Market Analysis (Volume & Value)
- 5.5. Price Trend Analysis
-
6. Argentina
- 6.1. Production Analysis
- 6.2. Consumption Analysis & Market Size
- 6.3. Import Market Analysis (Volume & Value)
- 6.4. Export Market Analysis (Volume & Value)
- 6.5. Price Trend Analysis
-
7. Brazil
- 7.1. Production Analysis
- 7.2. Consumption Analysis & Market Size
- 7.3. Import Market Analysis (Volume & Value)
- 7.4. Export Market Analysis (Volume & Value)
- 7.5. Price Trend Analysis
-
8. Paraguay
- 8.1. Production Analysis
- 8.2. Consumption Analysis & Market Size
- 8.3. Import Market Analysis (Volume & Value)
- 8.4. Export Market Analysis (Volume & Value)
- 8.5. Price Trend Analysis
-
9. Chile
- 9.1. Production Analysis
- 9.2. Consumption Analysis & Market Size
- 9.3. Import Market Analysis (Volume & Value)
- 9.4. Export Market Analysis (Volume & Value)
- 9.5. Price Trend Analysis
-
10. Uruguay
- 10.1. Production Analysis
- 10.2. Consumption Analysis & Market Size
- 10.3. Import Market Analysis (Volume & Value)
- 10.4. Export Market Analysis (Volume & Value)
- 10.5. Price Trend Analysis
South America Mate Industry Segmentation By Geography
-
1. South America
- 1.1. Brazil
- 1.2. Argentina
- 1.3. Chile
- 1.4. Colombia
- 1.5. Peru
- 1.6. Venezuela
- 1.7. Ecuador
- 1.8. Bolivia
- 1.9. Paraguay
- 1.10. Uruguay
South America Mate Industry Regional Market Share
Geographic Coverage of South America Mate Industry
South America Mate Industry REPORT HIGHLIGHTS
| Aspects | Details |
|---|---|
| Study Period | 2020-2034 |
| Base Year | 2025 |
| Estimated Year | 2026 |
| Forecast Period | 2026-2034 |
| Historical Period | 2020-2025 |
| Growth Rate | CAGR of 8.7% from 2020-2034 |
| Segmentation |
|
Table of Contents
- 1. Introduction
- 1.1. Research Scope
- 1.2. Market Segmentation
- 1.3. Research Objective
- 1.4. Definitions and Assumptions
- 2. Executive Summary
- 2.1. Market Snapshot
- 3. Market Dynamics
- 3.1. Market Drivers
- 3.2. Market Restrains
- 3.3. Market Trends
- 3.4. Market Opportunities
- 4. Market Factor Analysis
- 4.1. Porters Five Forces
- 4.1.1. Bargaining Power of Suppliers
- 4.1.2. Bargaining Power of Buyers
- 4.1.3. Threat of New Entrants
- 4.1.4. Threat of Substitutes
- 4.1.5. Competitive Rivalry
- 4.2. PESTEL analysis
- 4.3. BCG Analysis
- 4.3.1. Stars (High Growth, High Market Share)
- 4.3.2. Cash Cows (Low Growth, High Market Share)
- 4.3.3. Question Mark (High Growth, Low Market Share)
- 4.3.4. Dogs (Low Growth, Low Market Share)
- 4.4. Ansoff Matrix Analysis
- 4.5. Supply Chain Analysis
- 4.6. Regulatory Landscape
- 4.7. Current Market Potential and Opportunity Assessment (TAM–SAM–SOM Framework)
- 4.8. IMR Analyst Note
- 4.1. Porters Five Forces
- 5. Market Analysis, Insights and Forecast 2021-2033
- 5.1. Market Analysis, Insights and Forecast - by Argentina
- 5.1.1. Production Analysis
- 5.1.2. Consumption Analysis & Market Size
- 5.1.3. Import Market Analysis (Volume & Value)
- 5.1.4. Export Market Analysis (Volume & Value)
- 5.1.5. Price Trend Analysis
- 5.2. Market Analysis, Insights and Forecast - by Brazil
- 5.2.1. Production Analysis
- 5.2.2. Consumption Analysis & Market Size
- 5.2.3. Import Market Analysis (Volume & Value)
- 5.2.4. Export Market Analysis (Volume & Value)
- 5.2.5. Price Trend Analysis
- 5.3. Market Analysis, Insights and Forecast - by Paraguay
- 5.3.1. Production Analysis
- 5.3.2. Consumption Analysis & Market Size
- 5.3.3. Import Market Analysis (Volume & Value)
- 5.3.4. Export Market Analysis (Volume & Value)
- 5.3.5. Price Trend Analysis
- 5.4. Market Analysis, Insights and Forecast - by Chile
- 5.4.1. Production Analysis
- 5.4.2. Consumption Analysis & Market Size
- 5.4.3. Import Market Analysis (Volume & Value)
- 5.4.4. Export Market Analysis (Volume & Value)
- 5.4.5. Price Trend Analysis
- 5.5. Market Analysis, Insights and Forecast - by Uruguay
- 5.5.1. Production Analysis
- 5.5.2. Consumption Analysis & Market Size
- 5.5.3. Import Market Analysis (Volume & Value)
- 5.5.4. Export Market Analysis (Volume & Value)
- 5.5.5. Price Trend Analysis
- 5.6. Market Analysis, Insights and Forecast - by Argentina
- 5.6.1. Production Analysis
- 5.6.2. Consumption Analysis & Market Size
- 5.6.3. Import Market Analysis (Volume & Value)
- 5.6.4. Export Market Analysis (Volume & Value)
- 5.6.5. Price Trend Analysis
- 5.7. Market Analysis, Insights and Forecast - by Brazil
- 5.7.1. Production Analysis
- 5.7.2. Consumption Analysis & Market Size
- 5.7.3. Import Market Analysis (Volume & Value)
- 5.7.4. Export Market Analysis (Volume & Value)
- 5.7.5. Price Trend Analysis
- 5.8. Market Analysis, Insights and Forecast - by Paraguay
- 5.8.1. Production Analysis
- 5.8.2. Consumption Analysis & Market Size
- 5.8.3. Import Market Analysis (Volume & Value)
- 5.8.4. Export Market Analysis (Volume & Value)
- 5.8.5. Price Trend Analysis
- 5.9. Market Analysis, Insights and Forecast - by Chile
- 5.9.1. Production Analysis
- 5.9.2. Consumption Analysis & Market Size
- 5.9.3. Import Market Analysis (Volume & Value)
- 5.9.4. Export Market Analysis (Volume & Value)
- 5.9.5. Price Trend Analysis
- 5.10. Market Analysis, Insights and Forecast - by Uruguay
- 5.10.1. Production Analysis
- 5.10.2. Consumption Analysis & Market Size
- 5.10.3. Import Market Analysis (Volume & Value)
- 5.10.4. Export Market Analysis (Volume & Value)
- 5.10.5. Price Trend Analysis
- 5.11. Market Analysis, Insights and Forecast - by Region
- 5.11.1. South America
- 5.1. Market Analysis, Insights and Forecast - by Argentina
- 6. South America Mate Industry Analysis, Insights and Forecast, 2021-2033
- 6.1. Market Analysis, Insights and Forecast - by Argentina
- 6.1.1. Production Analysis
- 6.1.2. Consumption Analysis & Market Size
- 6.1.3. Import Market Analysis (Volume & Value)
- 6.1.4. Export Market Analysis (Volume & Value)
- 6.1.5. Price Trend Analysis
- 6.2. Market Analysis, Insights and Forecast - by Brazil
- 6.2.1. Production Analysis
- 6.2.2. Consumption Analysis & Market Size
- 6.2.3. Import Market Analysis (Volume & Value)
- 6.2.4. Export Market Analysis (Volume & Value)
- 6.2.5. Price Trend Analysis
- 6.3. Market Analysis, Insights and Forecast - by Paraguay
- 6.3.1. Production Analysis
- 6.3.2. Consumption Analysis & Market Size
- 6.3.3. Import Market Analysis (Volume & Value)
- 6.3.4. Export Market Analysis (Volume & Value)
- 6.3.5. Price Trend Analysis
- 6.4. Market Analysis, Insights and Forecast - by Chile
- 6.4.1. Production Analysis
- 6.4.2. Consumption Analysis & Market Size
- 6.4.3. Import Market Analysis (Volume & Value)
- 6.4.4. Export Market Analysis (Volume & Value)
- 6.4.5. Price Trend Analysis
- 6.5. Market Analysis, Insights and Forecast - by Uruguay
- 6.5.1. Production Analysis
- 6.5.2. Consumption Analysis & Market Size
- 6.5.3. Import Market Analysis (Volume & Value)
- 6.5.4. Export Market Analysis (Volume & Value)
- 6.5.5. Price Trend Analysis
- 6.6. Market Analysis, Insights and Forecast - by Argentina
- 6.6.1. Production Analysis
- 6.6.2. Consumption Analysis & Market Size
- 6.6.3. Import Market Analysis (Volume & Value)
- 6.6.4. Export Market Analysis (Volume & Value)
- 6.6.5. Price Trend Analysis
- 6.7. Market Analysis, Insights and Forecast - by Brazil
- 6.7.1. Production Analysis
- 6.7.2. Consumption Analysis & Market Size
- 6.7.3. Import Market Analysis (Volume & Value)
- 6.7.4. Export Market Analysis (Volume & Value)
- 6.7.5. Price Trend Analysis
- 6.8. Market Analysis, Insights and Forecast - by Paraguay
- 6.8.1. Production Analysis
- 6.8.2. Consumption Analysis & Market Size
- 6.8.3. Import Market Analysis (Volume & Value)
- 6.8.4. Export Market Analysis (Volume & Value)
- 6.8.5. Price Trend Analysis
- 6.9. Market Analysis, Insights and Forecast - by Chile
- 6.9.1. Production Analysis
- 6.9.2. Consumption Analysis & Market Size
- 6.9.3. Import Market Analysis (Volume & Value)
- 6.9.4. Export Market Analysis (Volume & Value)
- 6.9.5. Price Trend Analysis
- 6.10. Market Analysis, Insights and Forecast - by Uruguay
- 6.10.1. Production Analysis
- 6.10.2. Consumption Analysis & Market Size
- 6.10.3. Import Market Analysis (Volume & Value)
- 6.10.4. Export Market Analysis (Volume & Value)
- 6.10.5. Price Trend Analysis
- 6.1. Market Analysis, Insights and Forecast - by Argentina
- 7. Competitive Analysis
- 7.1. Company Profiles
- 7.1.1 Lauro Raatz SA (La Hoja)
- 7.1.1.1. Company Overview
- 7.1.1.2. Products
- 7.1.1.3. Company Financials
- 7.1.1.4. SWOT Analysis
- 7.1.2 Cooperativa Agrícola de la Colonia Liebig Ltda. (Playadito)
- 7.1.2.1. Company Overview
- 7.1.2.2. Products
- 7.1.2.3. Company Financials
- 7.1.2.4. SWOT Analysis
- 7.1.3 Amanda
- 7.1.3.1. Company Overview
- 7.1.3.2. Products
- 7.1.3.3. Company Financials
- 7.1.3.4. SWOT Analysis
- 7.1.4 Cooperativa Agrícola Mixta de Monte Carlo Ltda.
- 7.1.4.1. Company Overview
- 7.1.4.2. Products
- 7.1.4.3. Company Financials
- 7.1.4.4. SWOT Analysis
- 7.1.5 La Cachuera SA (Taragüi)
- 7.1.5.1. Company Overview
- 7.1.5.2. Products
- 7.1.5.3. Company Financials
- 7.1.5.4. SWOT Analysis
- 7.1.6 Establecimiento Las Marías
- 7.1.6.1. Company Overview
- 7.1.6.2. Products
- 7.1.6.3. Company Financials
- 7.1.6.4. SWOT Analysis
- 7.1.7 Industrias de Mision S.A. (Rosamonte)
- 7.1.7.1. Company Overview
- 7.1.7.2. Products
- 7.1.7.3. Company Financials
- 7.1.7.4. SWOT Analysis
- 7.1.1 Lauro Raatz SA (La Hoja)
- 7.2. Market Entropy
- 7.2.1 Company's Key Areas Served
- 7.2.2 Recent Developments
- 7.3. Company Market Share Analysis 2025
- 7.3.1 Top 5 Companies Market Share Analysis
- 7.3.2 Top 3 Companies Market Share Analysis
- 7.4. List of Potential Customers
- 8. Research Methodology
List of Figures
- Figure 1: South America Mate Industry Revenue Breakdown (billion, %) by Product 2025 & 2033
- Figure 2: South America Mate Industry Share (%) by Company 2025
List of Tables
- Table 1: South America Mate Industry Revenue billion Forecast, by Argentina 2020 & 2033
- Table 2: South America Mate Industry Revenue billion Forecast, by Brazil 2020 & 2033
- Table 3: South America Mate Industry Revenue billion Forecast, by Paraguay 2020 & 2033
- Table 4: South America Mate Industry Revenue billion Forecast, by Chile 2020 & 2033
- Table 5: South America Mate Industry Revenue billion Forecast, by Uruguay 2020 & 2033
- Table 6: South America Mate Industry Revenue billion Forecast, by Argentina 2020 & 2033
- Table 7: South America Mate Industry Revenue billion Forecast, by Brazil 2020 & 2033
- Table 8: South America Mate Industry Revenue billion Forecast, by Paraguay 2020 & 2033
- Table 9: South America Mate Industry Revenue billion Forecast, by Chile 2020 & 2033
- Table 10: South America Mate Industry Revenue billion Forecast, by Uruguay 2020 & 2033
- Table 11: South America Mate Industry Revenue billion Forecast, by Region 2020 & 2033
- Table 12: South America Mate Industry Revenue billion Forecast, by Argentina 2020 & 2033
- Table 13: South America Mate Industry Revenue billion Forecast, by Brazil 2020 & 2033
- Table 14: South America Mate Industry Revenue billion Forecast, by Paraguay 2020 & 2033
- Table 15: South America Mate Industry Revenue billion Forecast, by Chile 2020 & 2033
- Table 16: South America Mate Industry Revenue billion Forecast, by Uruguay 2020 & 2033
- Table 17: South America Mate Industry Revenue billion Forecast, by Argentina 2020 & 2033
- Table 18: South America Mate Industry Revenue billion Forecast, by Brazil 2020 & 2033
- Table 19: South America Mate Industry Revenue billion Forecast, by Paraguay 2020 & 2033
- Table 20: South America Mate Industry Revenue billion Forecast, by Chile 2020 & 2033
- Table 21: South America Mate Industry Revenue billion Forecast, by Uruguay 2020 & 2033
- Table 22: South America Mate Industry Revenue billion Forecast, by Country 2020 & 2033
- Table 23: Brazil South America Mate Industry Revenue (billion) Forecast, by Application 2020 & 2033
- Table 24: Argentina South America Mate Industry Revenue (billion) Forecast, by Application 2020 & 2033
- Table 25: Chile South America Mate Industry Revenue (billion) Forecast, by Application 2020 & 2033
- Table 26: Colombia South America Mate Industry Revenue (billion) Forecast, by Application 2020 & 2033
- Table 27: Peru South America Mate Industry Revenue (billion) Forecast, by Application 2020 & 2033
- Table 28: Venezuela South America Mate Industry Revenue (billion) Forecast, by Application 2020 & 2033
- Table 29: Ecuador South America Mate Industry Revenue (billion) Forecast, by Application 2020 & 2033
- Table 30: Bolivia South America Mate Industry Revenue (billion) Forecast, by Application 2020 & 2033
- Table 31: Paraguay South America Mate Industry Revenue (billion) Forecast, by Application 2020 & 2033
- Table 32: Uruguay South America Mate Industry Revenue (billion) Forecast, by Application 2020 & 2033
Frequently Asked Questions
1. What is the projected Compound Annual Growth Rate (CAGR) of the South America Mate Industry?
The projected CAGR is approximately 8.7%.
2. Which companies are prominent players in the South America Mate Industry?
Key companies in the market include Lauro Raatz SA (La Hoja) , Cooperativa Agrícola de la Colonia Liebig Ltda. (Playadito) , Amanda, Cooperativa Agrícola Mixta de Monte Carlo Ltda. , La Cachuera SA (Taragüi), Establecimiento Las Marías, Industrias de Mision S.A. (Rosamonte).
3. What are the main segments of the South America Mate Industry?
The market segments include Argentina, Brazil , Paraguay , Chile , Uruguay, Argentina, Brazil , Paraguay , Chile , Uruguay.
4. Can you provide details about the market size?
The market size is estimated to be USD 2.5 billion as of 2022.
5. What are some drivers contributing to market growth?
; Awareness About Health Benefits Associated With Pecan Consumption; Wide Application of Pecan.
6. What are the notable trends driving market growth?
Emerging Export Potential Driving Production.
7. Are there any restraints impacting market growth?
; Volatility in the Prices; Adverse Weather Conditions Affecting Yield.
8. Can you provide examples of recent developments in the market?
N/A
9. What pricing options are available for accessing the report?
Pricing options include single-user, multi-user, and enterprise licenses priced at USD 3800, USD 4500, and USD 5800 respectively.
10. Is the market size provided in terms of value or volume?
The market size is provided in terms of value, measured in billion.
11. Are there any specific market keywords associated with the report?
Yes, the market keyword associated with the report is "South America Mate Industry," which aids in identifying and referencing the specific market segment covered.
12. How do I determine which pricing option suits my needs best?
The pricing options vary based on user requirements and access needs. Individual users may opt for single-user licenses, while businesses requiring broader access may choose multi-user or enterprise licenses for cost-effective access to the report.
13. Are there any additional resources or data provided in the South America Mate Industry report?
While the report offers comprehensive insights, it's advisable to review the specific contents or supplementary materials provided to ascertain if additional resources or data are available.
14. How can I stay updated on further developments or reports in the South America Mate Industry?
To stay informed about further developments, trends, and reports in the South America Mate Industry, consider subscribing to industry newsletters, following relevant companies and organizations, or regularly checking reputable industry news sources and publications.
Methodology
Step 1 - Identification of Relevant Samples Size from Population Database


Step 2 - Approaches for Defining Global Market Size (Value, Volume* & Price*)

Note*: In applicable scenarios
Step 3 - Data Sources
Primary Research
- Web Analytics
- Survey Reports
- Research Institute
- Latest Research Reports
- Opinion Leaders
Secondary Research
- Annual Reports
- White Paper
- Latest Press Release
- Industry Association
- Paid Database
- Investor Presentations

Step 4 - Data Triangulation
Involves using different sources of information in order to increase the validity of a study
These sources are likely to be stakeholders in a program - participants, other researchers, program staff, other community members, and so on.
Then we put all data in single framework & apply various statistical tools to find out the dynamic on the market.
During the analysis stage, feedback from the stakeholder groups would be compared to determine areas of agreement as well as areas of divergence