

Key Insights
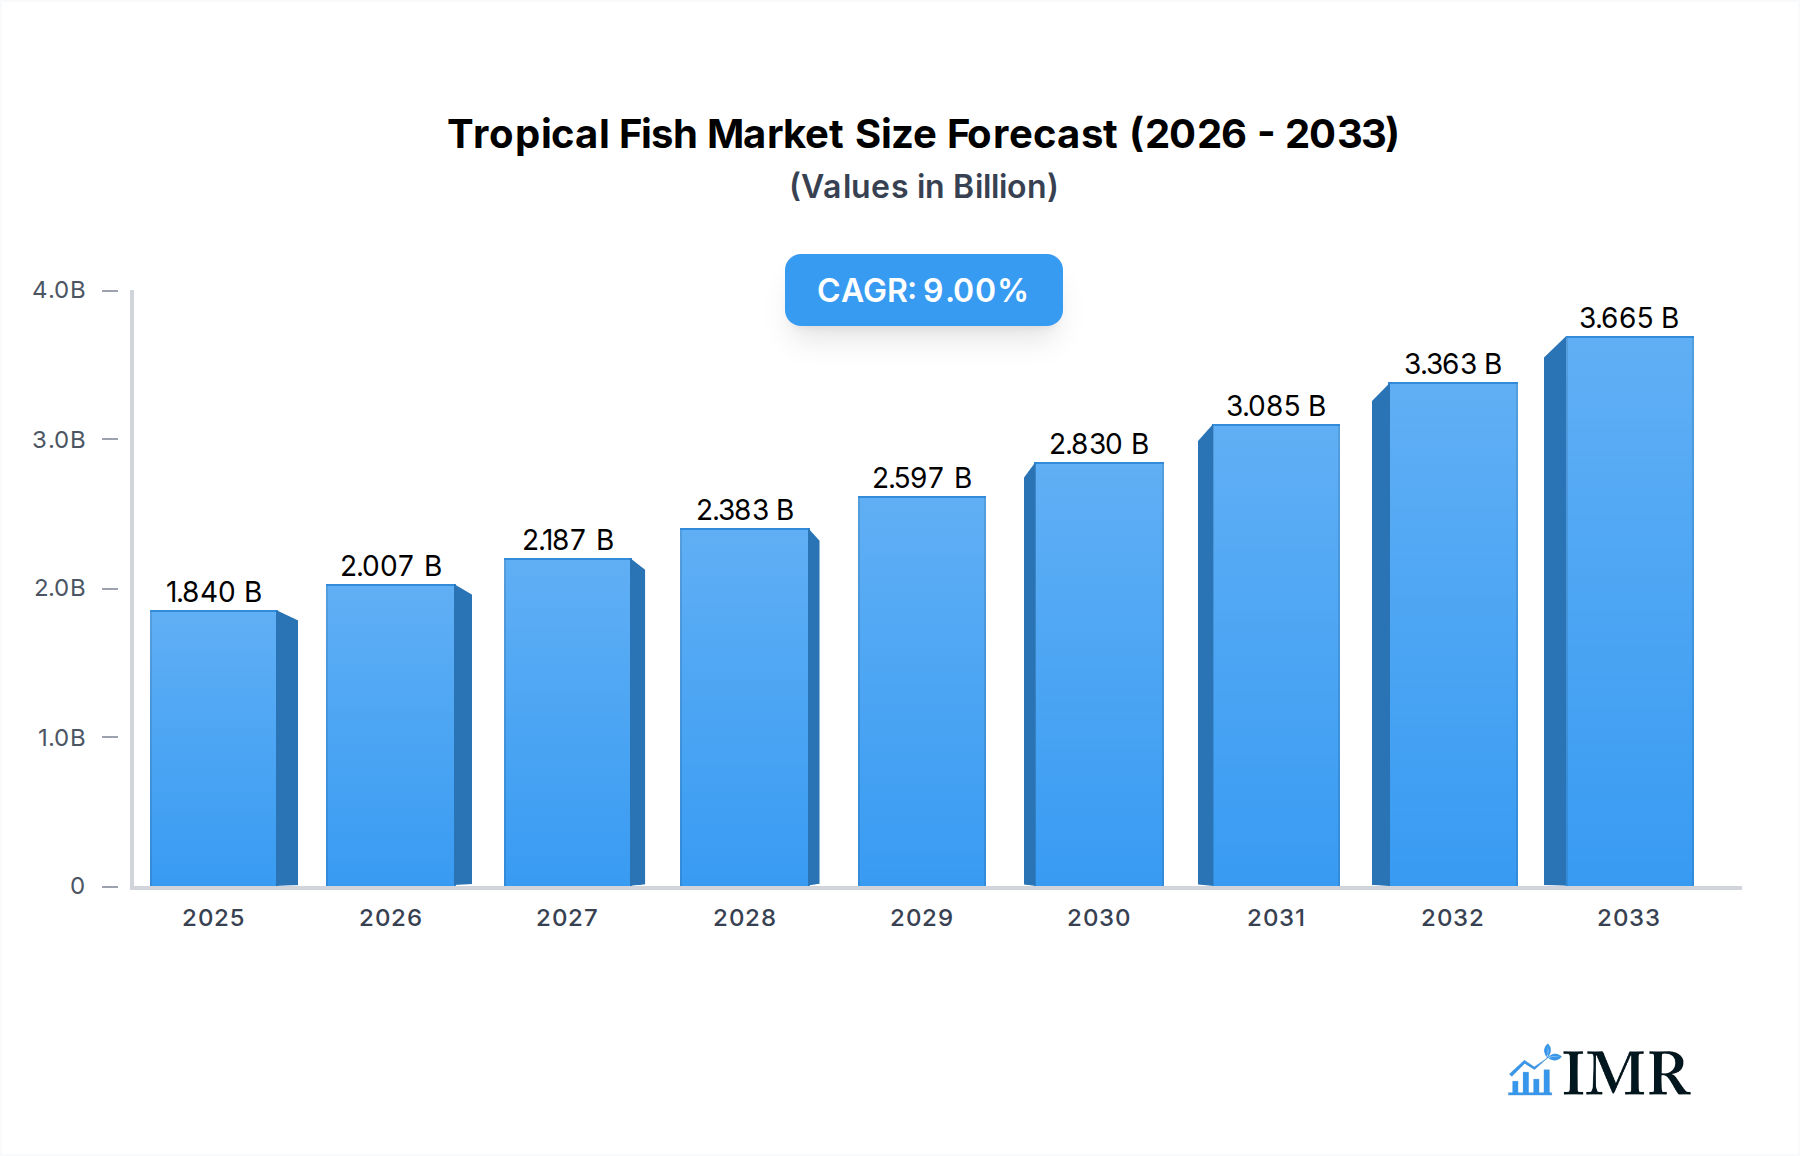
The global tropical fish market is poised for substantial growth, projected to reach approximately USD 1.84 billion in 2025, with a robust Compound Annual Growth Rate (CAGR) of 9.2% anticipated through 2033. This expansion is primarily fueled by increasing consumer interest in aquariums and ornamental fish as a hobby, driven by a growing awareness of the therapeutic benefits of aquatic environments and a desire for aesthetic home décor. The rising disposable incomes in emerging economies, coupled with a burgeoning middle class, are further contributing to the demand for diverse and exotic species. The market encompasses both freshwater tropical fish, which dominate due to their accessibility and wider variety, and saltwater tropical fish, which are gaining traction among enthusiasts seeking more complex and visually stunning aquatic displays. Key applications include home aquariums, commercial establishments like supermarkets and restaurants for decorative purposes, and specialized aquaculture facilities.

Tropical Fish Market Size (In Billion)
Several factors are driving this upward trajectory. The proliferation of online retail platforms has significantly expanded the reach of tropical fish suppliers, allowing hobbyists worldwide to access a wider selection of species and specialized aquarium equipment. Furthermore, advancements in aquaculture techniques are leading to more sustainable breeding practices and the availability of captive-bred specimens, reducing pressure on wild populations and enhancing the appeal to eco-conscious consumers. The growing popularity of social media, featuring visually captivating aquarium setups and fish species, also acts as a significant trend catalyst. While the market is strong, potential restraints such as stringent regulations regarding the import and export of live aquatic species, potential disease outbreaks affecting stock, and the high initial setup and maintenance costs associated with sophisticated aquariums could pose challenges. However, the overarching trend towards urbanization and a desire for natural elements within urban living spaces is expected to outweigh these limitations, propelling the market forward.
Tropical Fish Company Market Share
Tropical Fish Market Dynamics & Structure
The global tropical fish market exhibits a moderately concentrated structure, with a blend of large-scale aquaculture operations and specialized niche breeders. Technological innovation is primarily driven by advancements in breeding techniques, disease management, and sustainable aquaculture practices, aiming to improve yield and reduce environmental impact. Regulatory frameworks vary significantly by region, with some areas imposing strict controls on imports and exports to prevent disease transmission and protect native ecosystems, while others offer supportive policies for aquaculture development. Competitive product substitutes include artificial aquarium decorations and other pet categories, though the demand for live tropical fish remains robust due to their aesthetic appeal and the engaging hobby they foster. End-user demographics are diverse, ranging from hobbyist aquarium enthusiasts to commercial aquarium retailers and public aquariums. Mergers and acquisitions (M&A) are observed, particularly among larger players seeking to expand their operational scale, diversify species offerings, and gain market share.
- Market Concentration: Moderate, with key players like Pool Fisheries and Hazorea Aquatics dominating certain segments.
- Technological Innovation Drivers: Advanced breeding techniques, sustainable aquaculture, improved disease diagnostics, and efficient feed technologies.
- Regulatory Frameworks: Focus on biosecurity, international trade regulations, and environmental sustainability certifications.
- Competitive Product Substitutes: Artificial decor, other pet segments (e.g., reptiles, small mammals).
- End-User Demographics: Hobbyists (household income $50k+), commercial retailers, public aquariums, educational institutions.
- M&A Trends: Consolidation for economies of scale, acquisition of specialized breeding expertise, and expansion into emerging markets.
Tropical Fish Growth Trends & Insights
The global tropical fish market is poised for significant expansion over the forecast period of 2025–2033, driven by a confluence of increasing disposable incomes, a growing interest in home-based hobbies, and a greater appreciation for the therapeutic benefits of aquariums. The market size, projected to reach $6.5 billion in 2025, is anticipated to grow at a Compound Annual Growth Rate (CAGR) of approximately 5.2%, culminating in an estimated market value of $9.8 billion by 2033. This growth trajectory is fueled by rising adoption rates of home aquariums, particularly among millennials and Gen Z consumers who are increasingly seeking engaging and aesthetically pleasing ways to enhance their living spaces. Technological disruptions are playing a crucial role, with innovations in captive breeding of rare and sought-after species significantly reducing reliance on wild-caught specimens, thus promoting sustainability and ensuring a more stable supply chain. Furthermore, advancements in water filtration systems, lighting technologies, and automated feeding devices are making aquarium keeping more accessible and less labor-intensive, attracting a broader audience. Consumer behavior shifts are evident, with a growing preference for species known for their vibrant colors, unique patterns, and interesting behaviors. The pandemic further accelerated this trend, as individuals spent more time at home and sought ways to create calming and engaging environments. The demand for Saltwater Tropical Fish, while historically a niche segment, is projected to experience a higher growth rate than Freshwater Tropical Fish due to increasing consumer familiarity with marine aquariums and the availability of more resilient species. The Supermarket segment, though smaller than the Aquarium segment, is expected to witness steady growth as more pet retailers integrate live aquatic offerings into their product portfolios. The "Others" segment, encompassing public aquariums, educational institutions, and aquaculture research facilities, will also contribute to sustained demand.
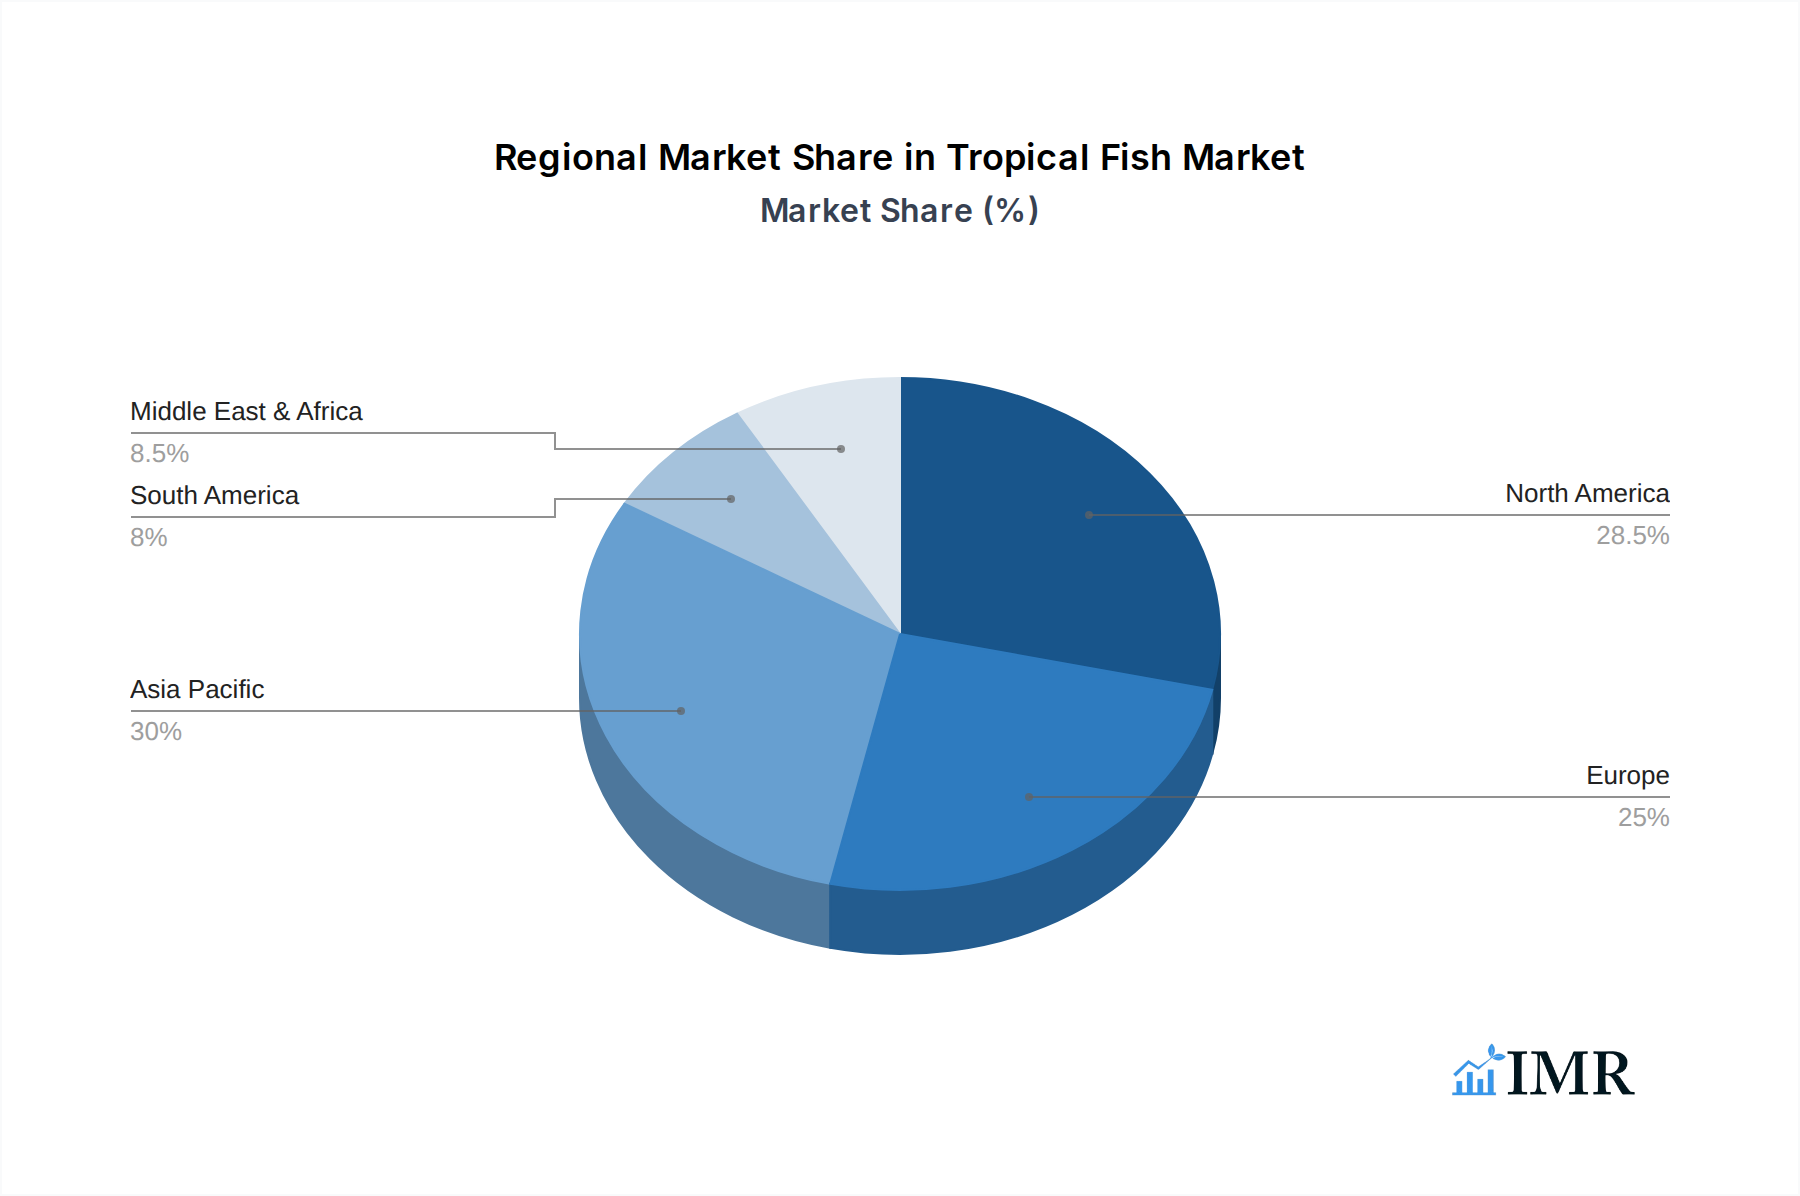
Dominant Regions, Countries, or Segments in Tropical Fish
The Aquarium segment, encompassing both freshwater and saltwater species kept in residential and commercial settings, is the undisputed dominant force driving the global tropical fish market. This segment is projected to account for approximately 75% of the total market revenue in 2025. Its dominance stems from a pervasive global hobbyist culture, increasing urbanization leading to smaller living spaces that benefit from the contained beauty of aquariums, and a growing awareness of the stress-reducing and aesthetic advantages of aquatic life. Within this segment, Freshwater Tropical Fish continue to hold the largest market share due to their accessibility, affordability, and the wider variety of species available, making them ideal for beginners and experienced aquarists alike. However, Saltwater Tropical Fish are exhibiting a faster growth rate, driven by advancements in captive breeding techniques that have made delicate marine species more hardy and by the increasing popularity of specialized marine aquariums among affluent hobbyists.
The United States is the leading country in terms of tropical fish consumption and trade, driven by a large and affluent population of aquarium enthusiasts, a well-established pet retail infrastructure, and significant domestic aquaculture production, particularly in states like Florida. Other key countries contributing to market growth include China, which is a major producer and exporter of tropical fish, particularly freshwater species, and has a rapidly growing domestic market fueled by rising disposable incomes. European countries, such as Germany, the UK, and France, also represent significant markets due to a long-standing tradition of aquarium keeping and a strong emphasis on pet welfare and environmental regulations.
Key drivers for the dominance of the Aquarium segment and these leading regions include:
- Economic Policies: Supportive trade policies and investments in aquaculture infrastructure in key producing nations.
- Consumer Spending Power: Rising disposable incomes globally enable more households to invest in aquariums and associated supplies.
- Hobbyist Culture: A deeply ingrained and evolving hobbyist community that drives demand for both common and rare species.
- Technological Advancements: Innovations in breeding, disease management, and aquarium technology make keeping tropical fish more accessible and sustainable.
- Urbanization: Smaller living spaces in urban environments are well-suited for contained aquatic ecosystems.
- Awareness of Benefits: Growing recognition of the therapeutic and aesthetic benefits of maintaining aquariums.
The growth potential within the Aquarium segment remains substantial, with opportunities in expanding the market for specialized and sustainably bred saltwater species, as well as catering to the increasing demand for educational and therapeutic aquarium installations.
Tropical Fish Product Landscape
The tropical fish product landscape is characterized by a diverse array of species meticulously bred for vibrant coloration, unique patterns, and engaging behaviors, primarily catering to the aquarium application. Innovations focus on enhancing the hardiness and resilience of species, reducing susceptibility to common diseases, and developing captive-bred alternatives to wild-caught specimens to promote conservation. Performance metrics are centered on survival rates, reproductive success in captivity, and aesthetic appeal. Unique selling propositions include rarity of species, advanced captive breeding techniques, and ethical sourcing practices. Technological advancements are also evident in the development of specialized feed formulations that enhance coloration and overall health.
Key Drivers, Barriers & Challenges in Tropical Fish
Key Drivers:
- Growing Pet Humanization Trend: Increasing consumer willingness to spend on pets, including aquarium fish, as companions.
- Therapeutic and Aesthetic Benefits: Aquariums are recognized for their stress-reducing qualities and ability to enhance home decor.
- Advancements in Aquaculture and Breeding: Improved techniques lead to healthier, more accessible, and diverse species.
- Rising Disposable Incomes: Greater purchasing power allows more households to invest in the hobby.
- Sustainable Sourcing Initiatives: Captive-bred fish reduce pressure on wild populations, appealing to environmentally conscious consumers.
Barriers & Challenges:
- Disease Outbreaks and Management: The delicate nature of tropical fish makes them susceptible to diseases, impacting supply and requiring stringent biosecurity measures.
- Regulatory Hurdles: International trade restrictions and import/export regulations can impact species availability and market access.
- Supply Chain Volatility: Reliance on specific breeding seasons or collection points can lead to fluctuations in availability and price.
- High Initial Setup Costs: The initial investment for aquariums, equipment, and livestock can be a deterrent for some potential hobbyists.
- Competition from Other Pet Segments: Tropical fish compete for consumer attention and spending with a wide array of other pet options.
- Environmental Concerns: Over-collection of wild specimens and potential ecological impacts of escaped invasive species remain a challenge.
Emerging Opportunities in Tropical Fish
Emerging opportunities in the tropical fish market lie in the expansion of the premium and rare species segment, catering to discerning aquarists seeking unique and highly sought-after specimens. The demand for sustainably bred and ethically sourced fish is a significant growth avenue, with consumers increasingly willing to pay a premium for such products. Furthermore, the integration of smart aquarium technology, offering automated monitoring and control systems, presents an opportunity to attract tech-savvy consumers and simplify aquarium maintenance. The development of specialized nutritional products and disease prevention solutions tailored to specific species also represents an untapped market. Educational initiatives and online communities focused on responsible aquarium keeping can foster new hobbyists and enhance customer loyalty.
Growth Accelerators in the Tropical Fish Industry
Several catalysts are accelerating growth in the tropical fish industry. Technological breakthroughs in genetics and selective breeding are continuously expanding the variety of fish available, introducing novel colorations and patterns that captivate consumers. Strategic partnerships between aquaculture farms, research institutions, and pet retailers are streamlining the supply chain, ensuring consistent quality and availability. Market expansion into emerging economies with growing middle classes and increasing interest in home decor and hobbies is a key growth driver. Furthermore, a greater emphasis on the welfare and mental health benefits of aquariums is driving adoption among a broader demographic, solidifying the long-term appeal of this market.
Key Players Shaping the Tropical Fish Market
- Pool Fisheries
- Blue Ridge Fish Hatchery
- Arkansas Farm Bureau
- Blackwater Creek Koi Farms
- Hazorea Aquatics
- Oasis Fish Farm
- Aqua Leisure
- Imperial Tropicals
- Florida Tropical Fish Direct
- BioAquatix
- Captive Bred
- Shanghua Yichong
- Shanghai Wanjin Ornamental Fish Farm
- Guangzhou ZhengDa Aquaculture
- Arizona Aquatic Gardens
Notable Milestones in Tropical Fish Sector
- 2019: Increased adoption of captive breeding programs for marine angelfish and butterflyfish, leading to greater availability and reduced wild collection.
- 2020: Surge in demand for freshwater aquarium fish due to increased home-based activities during the pandemic, impacting production and distribution networks.
- 2021: Advancements in disease diagnostic tools for common aquarium fish diseases, enabling faster identification and treatment.
- 2022: Growing emphasis on sustainability certifications for tropical fish aquaculture, influencing consumer purchasing decisions.
- 2023: Introduction of advanced water filtration and lighting systems, making advanced aquarium setups more accessible to hobbyists.
- 2024: Expansion of online retail platforms for tropical fish, providing wider reach and more direct consumer engagement.
- 2025 (Estimated): Expected increase in the market share of saltwater species due to improved captive breeding success rates and greater consumer confidence.
In-Depth Tropical Fish Market Outlook
The future outlook for the tropical fish market is highly promising, driven by sustained consumer interest in aquariums as both a hobby and a source of well-being. Growth accelerators include ongoing innovations in breeding technologies that promise an even wider diversity of species, coupled with a strong global push towards sustainable aquaculture practices that will ensure long-term ecological viability and consumer trust. Strategic collaborations and market expansion into developing regions will further broaden the consumer base. The increasing acceptance of smart home technology within the aquarium sphere is expected to attract a new generation of tech-savvy hobbyists, ensuring continued market dynamism and sustained growth in the coming years.
Tropical Fish Segmentation
-
1. Application
- 1.1. Aquarium
- 1.2. Supermarket
- 1.3. Others
-
2. Types
- 2.1. Freshwater Tropical Fish
- 2.2. Saltwater Tropical Fish
Tropical Fish Segmentation By Geography
-
1. North America
- 1.1. United States
- 1.2. Canada
- 1.3. Mexico
-
2. South America
- 2.1. Brazil
- 2.2. Argentina
- 2.3. Rest of South America
-
3. Europe
- 3.1. United Kingdom
- 3.2. Germany
- 3.3. France
- 3.4. Italy
- 3.5. Spain
- 3.6. Russia
- 3.7. Benelux
- 3.8. Nordics
- 3.9. Rest of Europe
-
4. Middle East & Africa
- 4.1. Turkey
- 4.2. Israel
- 4.3. GCC
- 4.4. North Africa
- 4.5. South Africa
- 4.6. Rest of Middle East & Africa
-
5. Asia Pacific
- 5.1. China
- 5.2. India
- 5.3. Japan
- 5.4. South Korea
- 5.5. ASEAN
- 5.6. Oceania
- 5.7. Rest of Asia Pacific
Tropical Fish Regional Market Share
Geographic Coverage of Tropical Fish
Tropical Fish REPORT HIGHLIGHTS
| Aspects | Details |
|---|---|
| Study Period | 2020-2034 |
| Base Year | 2025 |
| Estimated Year | 2026 |
| Forecast Period | 2026-2034 |
| Historical Period | 2020-2025 |
| Growth Rate | CAGR of 9.2% from 2020-2034 |
| Segmentation |
|
Table of Contents
- 1. Introduction
- 1.1. Research Scope
- 1.2. Market Segmentation
- 1.3. Research Methodology
- 1.4. Definitions and Assumptions
- 2. Executive Summary
- 2.1. Introduction
- 3. Market Dynamics
- 3.1. Introduction
- 3.2. Market Drivers
- 3.3. Market Restrains
- 3.4. Market Trends
- 4. Market Factor Analysis
- 4.1. Porters Five Forces
- 4.2. Supply/Value Chain
- 4.3. PESTEL analysis
- 4.4. Market Entropy
- 4.5. Patent/Trademark Analysis
- 5. Global Tropical Fish Analysis, Insights and Forecast, 2020-2032
- 5.1. Market Analysis, Insights and Forecast - by Application
- 5.1.1. Aquarium
- 5.1.2. Supermarket
- 5.1.3. Others
- 5.2. Market Analysis, Insights and Forecast - by Types
- 5.2.1. Freshwater Tropical Fish
- 5.2.2. Saltwater Tropical Fish
- 5.3. Market Analysis, Insights and Forecast - by Region
- 5.3.1. North America
- 5.3.2. South America
- 5.3.3. Europe
- 5.3.4. Middle East & Africa
- 5.3.5. Asia Pacific
- 5.1. Market Analysis, Insights and Forecast - by Application
- 6. North America Tropical Fish Analysis, Insights and Forecast, 2020-2032
- 6.1. Market Analysis, Insights and Forecast - by Application
- 6.1.1. Aquarium
- 6.1.2. Supermarket
- 6.1.3. Others
- 6.2. Market Analysis, Insights and Forecast - by Types
- 6.2.1. Freshwater Tropical Fish
- 6.2.2. Saltwater Tropical Fish
- 6.1. Market Analysis, Insights and Forecast - by Application
- 7. South America Tropical Fish Analysis, Insights and Forecast, 2020-2032
- 7.1. Market Analysis, Insights and Forecast - by Application
- 7.1.1. Aquarium
- 7.1.2. Supermarket
- 7.1.3. Others
- 7.2. Market Analysis, Insights and Forecast - by Types
- 7.2.1. Freshwater Tropical Fish
- 7.2.2. Saltwater Tropical Fish
- 7.1. Market Analysis, Insights and Forecast - by Application
- 8. Europe Tropical Fish Analysis, Insights and Forecast, 2020-2032
- 8.1. Market Analysis, Insights and Forecast - by Application
- 8.1.1. Aquarium
- 8.1.2. Supermarket
- 8.1.3. Others
- 8.2. Market Analysis, Insights and Forecast - by Types
- 8.2.1. Freshwater Tropical Fish
- 8.2.2. Saltwater Tropical Fish
- 8.1. Market Analysis, Insights and Forecast - by Application
- 9. Middle East & Africa Tropical Fish Analysis, Insights and Forecast, 2020-2032
- 9.1. Market Analysis, Insights and Forecast - by Application
- 9.1.1. Aquarium
- 9.1.2. Supermarket
- 9.1.3. Others
- 9.2. Market Analysis, Insights and Forecast - by Types
- 9.2.1. Freshwater Tropical Fish
- 9.2.2. Saltwater Tropical Fish
- 9.1. Market Analysis, Insights and Forecast - by Application
- 10. Asia Pacific Tropical Fish Analysis, Insights and Forecast, 2020-2032
- 10.1. Market Analysis, Insights and Forecast - by Application
- 10.1.1. Aquarium
- 10.1.2. Supermarket
- 10.1.3. Others
- 10.2. Market Analysis, Insights and Forecast - by Types
- 10.2.1. Freshwater Tropical Fish
- 10.2.2. Saltwater Tropical Fish
- 10.1. Market Analysis, Insights and Forecast - by Application
- 11. Competitive Analysis
- 11.1. Global Market Share Analysis 2025
- 11.2. Company Profiles
- 11.2.1 Pool Fisheries
- 11.2.1.1. Overview
- 11.2.1.2. Products
- 11.2.1.3. SWOT Analysis
- 11.2.1.4. Recent Developments
- 11.2.1.5. Financials (Based on Availability)
- 11.2.2 Blue Ridge Fish Hatchery
- 11.2.2.1. Overview
- 11.2.2.2. Products
- 11.2.2.3. SWOT Analysis
- 11.2.2.4. Recent Developments
- 11.2.2.5. Financials (Based on Availability)
- 11.2.3 Arkansas Farm Bureau
- 11.2.3.1. Overview
- 11.2.3.2. Products
- 11.2.3.3. SWOT Analysis
- 11.2.3.4. Recent Developments
- 11.2.3.5. Financials (Based on Availability)
- 11.2.4 Blackwater Creek Koi Farms
- 11.2.4.1. Overview
- 11.2.4.2. Products
- 11.2.4.3. SWOT Analysis
- 11.2.4.4. Recent Developments
- 11.2.4.5. Financials (Based on Availability)
- 11.2.5 Hazorea Aquatics
- 11.2.5.1. Overview
- 11.2.5.2. Products
- 11.2.5.3. SWOT Analysis
- 11.2.5.4. Recent Developments
- 11.2.5.5. Financials (Based on Availability)
- 11.2.6 Oasis Fish Farm
- 11.2.6.1. Overview
- 11.2.6.2. Products
- 11.2.6.3. SWOT Analysis
- 11.2.6.4. Recent Developments
- 11.2.6.5. Financials (Based on Availability)
- 11.2.7 Aqua Leisure
- 11.2.7.1. Overview
- 11.2.7.2. Products
- 11.2.7.3. SWOT Analysis
- 11.2.7.4. Recent Developments
- 11.2.7.5. Financials (Based on Availability)
- 11.2.8 Imperial Tropicals
- 11.2.8.1. Overview
- 11.2.8.2. Products
- 11.2.8.3. SWOT Analysis
- 11.2.8.4. Recent Developments
- 11.2.8.5. Financials (Based on Availability)
- 11.2.9 Florida Tropical Fish Direct
- 11.2.9.1. Overview
- 11.2.9.2. Products
- 11.2.9.3. SWOT Analysis
- 11.2.9.4. Recent Developments
- 11.2.9.5. Financials (Based on Availability)
- 11.2.10 BioAquatix
- 11.2.10.1. Overview
- 11.2.10.2. Products
- 11.2.10.3. SWOT Analysis
- 11.2.10.4. Recent Developments
- 11.2.10.5. Financials (Based on Availability)
- 11.2.11 Captive Bred
- 11.2.11.1. Overview
- 11.2.11.2. Products
- 11.2.11.3. SWOT Analysis
- 11.2.11.4. Recent Developments
- 11.2.11.5. Financials (Based on Availability)
- 11.2.12 Shanghua Yichong
- 11.2.12.1. Overview
- 11.2.12.2. Products
- 11.2.12.3. SWOT Analysis
- 11.2.12.4. Recent Developments
- 11.2.12.5. Financials (Based on Availability)
- 11.2.13 Shanghai Wanjin Ornamental Fish Farm
- 11.2.13.1. Overview
- 11.2.13.2. Products
- 11.2.13.3. SWOT Analysis
- 11.2.13.4. Recent Developments
- 11.2.13.5. Financials (Based on Availability)
- 11.2.14 Guangzhou ZhengDa Aquaculture
- 11.2.14.1. Overview
- 11.2.14.2. Products
- 11.2.14.3. SWOT Analysis
- 11.2.14.4. Recent Developments
- 11.2.14.5. Financials (Based on Availability)
- 11.2.15 Arizona Aquatic Gardens
- 11.2.15.1. Overview
- 11.2.15.2. Products
- 11.2.15.3. SWOT Analysis
- 11.2.15.4. Recent Developments
- 11.2.15.5. Financials (Based on Availability)
- 11.2.1 Pool Fisheries
List of Figures
- Figure 1: Global Tropical Fish Revenue Breakdown (undefined, %) by Region 2025 & 2033
- Figure 2: North America Tropical Fish Revenue (undefined), by Application 2025 & 2033
- Figure 3: North America Tropical Fish Revenue Share (%), by Application 2025 & 2033
- Figure 4: North America Tropical Fish Revenue (undefined), by Types 2025 & 2033
- Figure 5: North America Tropical Fish Revenue Share (%), by Types 2025 & 2033
- Figure 6: North America Tropical Fish Revenue (undefined), by Country 2025 & 2033
- Figure 7: North America Tropical Fish Revenue Share (%), by Country 2025 & 2033
- Figure 8: South America Tropical Fish Revenue (undefined), by Application 2025 & 2033
- Figure 9: South America Tropical Fish Revenue Share (%), by Application 2025 & 2033
- Figure 10: South America Tropical Fish Revenue (undefined), by Types 2025 & 2033
- Figure 11: South America Tropical Fish Revenue Share (%), by Types 2025 & 2033
- Figure 12: South America Tropical Fish Revenue (undefined), by Country 2025 & 2033
- Figure 13: South America Tropical Fish Revenue Share (%), by Country 2025 & 2033
- Figure 14: Europe Tropical Fish Revenue (undefined), by Application 2025 & 2033
- Figure 15: Europe Tropical Fish Revenue Share (%), by Application 2025 & 2033
- Figure 16: Europe Tropical Fish Revenue (undefined), by Types 2025 & 2033
- Figure 17: Europe Tropical Fish Revenue Share (%), by Types 2025 & 2033
- Figure 18: Europe Tropical Fish Revenue (undefined), by Country 2025 & 2033
- Figure 19: Europe Tropical Fish Revenue Share (%), by Country 2025 & 2033
- Figure 20: Middle East & Africa Tropical Fish Revenue (undefined), by Application 2025 & 2033
- Figure 21: Middle East & Africa Tropical Fish Revenue Share (%), by Application 2025 & 2033
- Figure 22: Middle East & Africa Tropical Fish Revenue (undefined), by Types 2025 & 2033
- Figure 23: Middle East & Africa Tropical Fish Revenue Share (%), by Types 2025 & 2033
- Figure 24: Middle East & Africa Tropical Fish Revenue (undefined), by Country 2025 & 2033
- Figure 25: Middle East & Africa Tropical Fish Revenue Share (%), by Country 2025 & 2033
- Figure 26: Asia Pacific Tropical Fish Revenue (undefined), by Application 2025 & 2033
- Figure 27: Asia Pacific Tropical Fish Revenue Share (%), by Application 2025 & 2033
- Figure 28: Asia Pacific Tropical Fish Revenue (undefined), by Types 2025 & 2033
- Figure 29: Asia Pacific Tropical Fish Revenue Share (%), by Types 2025 & 2033
- Figure 30: Asia Pacific Tropical Fish Revenue (undefined), by Country 2025 & 2033
- Figure 31: Asia Pacific Tropical Fish Revenue Share (%), by Country 2025 & 2033
List of Tables
- Table 1: Global Tropical Fish Revenue undefined Forecast, by Application 2020 & 2033
- Table 2: Global Tropical Fish Revenue undefined Forecast, by Types 2020 & 2033
- Table 3: Global Tropical Fish Revenue undefined Forecast, by Region 2020 & 2033
- Table 4: Global Tropical Fish Revenue undefined Forecast, by Application 2020 & 2033
- Table 5: Global Tropical Fish Revenue undefined Forecast, by Types 2020 & 2033
- Table 6: Global Tropical Fish Revenue undefined Forecast, by Country 2020 & 2033
- Table 7: United States Tropical Fish Revenue (undefined) Forecast, by Application 2020 & 2033
- Table 8: Canada Tropical Fish Revenue (undefined) Forecast, by Application 2020 & 2033
- Table 9: Mexico Tropical Fish Revenue (undefined) Forecast, by Application 2020 & 2033
- Table 10: Global Tropical Fish Revenue undefined Forecast, by Application 2020 & 2033
- Table 11: Global Tropical Fish Revenue undefined Forecast, by Types 2020 & 2033
- Table 12: Global Tropical Fish Revenue undefined Forecast, by Country 2020 & 2033
- Table 13: Brazil Tropical Fish Revenue (undefined) Forecast, by Application 2020 & 2033
- Table 14: Argentina Tropical Fish Revenue (undefined) Forecast, by Application 2020 & 2033
- Table 15: Rest of South America Tropical Fish Revenue (undefined) Forecast, by Application 2020 & 2033
- Table 16: Global Tropical Fish Revenue undefined Forecast, by Application 2020 & 2033
- Table 17: Global Tropical Fish Revenue undefined Forecast, by Types 2020 & 2033
- Table 18: Global Tropical Fish Revenue undefined Forecast, by Country 2020 & 2033
- Table 19: United Kingdom Tropical Fish Revenue (undefined) Forecast, by Application 2020 & 2033
- Table 20: Germany Tropical Fish Revenue (undefined) Forecast, by Application 2020 & 2033
- Table 21: France Tropical Fish Revenue (undefined) Forecast, by Application 2020 & 2033
- Table 22: Italy Tropical Fish Revenue (undefined) Forecast, by Application 2020 & 2033
- Table 23: Spain Tropical Fish Revenue (undefined) Forecast, by Application 2020 & 2033
- Table 24: Russia Tropical Fish Revenue (undefined) Forecast, by Application 2020 & 2033
- Table 25: Benelux Tropical Fish Revenue (undefined) Forecast, by Application 2020 & 2033
- Table 26: Nordics Tropical Fish Revenue (undefined) Forecast, by Application 2020 & 2033
- Table 27: Rest of Europe Tropical Fish Revenue (undefined) Forecast, by Application 2020 & 2033
- Table 28: Global Tropical Fish Revenue undefined Forecast, by Application 2020 & 2033
- Table 29: Global Tropical Fish Revenue undefined Forecast, by Types 2020 & 2033
- Table 30: Global Tropical Fish Revenue undefined Forecast, by Country 2020 & 2033
- Table 31: Turkey Tropical Fish Revenue (undefined) Forecast, by Application 2020 & 2033
- Table 32: Israel Tropical Fish Revenue (undefined) Forecast, by Application 2020 & 2033
- Table 33: GCC Tropical Fish Revenue (undefined) Forecast, by Application 2020 & 2033
- Table 34: North Africa Tropical Fish Revenue (undefined) Forecast, by Application 2020 & 2033
- Table 35: South Africa Tropical Fish Revenue (undefined) Forecast, by Application 2020 & 2033
- Table 36: Rest of Middle East & Africa Tropical Fish Revenue (undefined) Forecast, by Application 2020 & 2033
- Table 37: Global Tropical Fish Revenue undefined Forecast, by Application 2020 & 2033
- Table 38: Global Tropical Fish Revenue undefined Forecast, by Types 2020 & 2033
- Table 39: Global Tropical Fish Revenue undefined Forecast, by Country 2020 & 2033
- Table 40: China Tropical Fish Revenue (undefined) Forecast, by Application 2020 & 2033
- Table 41: India Tropical Fish Revenue (undefined) Forecast, by Application 2020 & 2033
- Table 42: Japan Tropical Fish Revenue (undefined) Forecast, by Application 2020 & 2033
- Table 43: South Korea Tropical Fish Revenue (undefined) Forecast, by Application 2020 & 2033
- Table 44: ASEAN Tropical Fish Revenue (undefined) Forecast, by Application 2020 & 2033
- Table 45: Oceania Tropical Fish Revenue (undefined) Forecast, by Application 2020 & 2033
- Table 46: Rest of Asia Pacific Tropical Fish Revenue (undefined) Forecast, by Application 2020 & 2033
Frequently Asked Questions
1. What is the projected Compound Annual Growth Rate (CAGR) of the Tropical Fish?
The projected CAGR is approximately 9.2%.
2. Which companies are prominent players in the Tropical Fish?
Key companies in the market include Pool Fisheries, Blue Ridge Fish Hatchery, Arkansas Farm Bureau, Blackwater Creek Koi Farms, Hazorea Aquatics, Oasis Fish Farm, Aqua Leisure, Imperial Tropicals, Florida Tropical Fish Direct, BioAquatix, Captive Bred, Shanghua Yichong, Shanghai Wanjin Ornamental Fish Farm, Guangzhou ZhengDa Aquaculture, Arizona Aquatic Gardens.
3. What are the main segments of the Tropical Fish?
The market segments include Application, Types.
4. Can you provide details about the market size?
The market size is estimated to be USD XXX N/A as of 2022.
5. What are some drivers contributing to market growth?
N/A
6. What are the notable trends driving market growth?
N/A
7. Are there any restraints impacting market growth?
N/A
8. Can you provide examples of recent developments in the market?
N/A
9. What pricing options are available for accessing the report?
Pricing options include single-user, multi-user, and enterprise licenses priced at USD 3350.00, USD 5025.00, and USD 6700.00 respectively.
10. Is the market size provided in terms of value or volume?
The market size is provided in terms of value, measured in N/A.
11. Are there any specific market keywords associated with the report?
Yes, the market keyword associated with the report is "Tropical Fish," which aids in identifying and referencing the specific market segment covered.
12. How do I determine which pricing option suits my needs best?
The pricing options vary based on user requirements and access needs. Individual users may opt for single-user licenses, while businesses requiring broader access may choose multi-user or enterprise licenses for cost-effective access to the report.
13. Are there any additional resources or data provided in the Tropical Fish report?
While the report offers comprehensive insights, it's advisable to review the specific contents or supplementary materials provided to ascertain if additional resources or data are available.
14. How can I stay updated on further developments or reports in the Tropical Fish?
To stay informed about further developments, trends, and reports in the Tropical Fish, consider subscribing to industry newsletters, following relevant companies and organizations, or regularly checking reputable industry news sources and publications.
Methodology
Step 1 - Identification of Relevant Samples Size from Population Database


Step 2 - Approaches for Defining Global Market Size (Value, Volume* & Price*)

Note*: In applicable scenarios
Step 3 - Data Sources
Primary Research
- Web Analytics
- Survey Reports
- Research Institute
- Latest Research Reports
- Opinion Leaders
Secondary Research
- Annual Reports
- White Paper
- Latest Press Release
- Industry Association
- Paid Database
- Investor Presentations

Step 4 - Data Triangulation
Involves using different sources of information in order to increase the validity of a study
These sources are likely to be stakeholders in a program - participants, other researchers, program staff, other community members, and so on.
Then we put all data in single framework & apply various statistical tools to find out the dynamic on the market.
During the analysis stage, feedback from the stakeholder groups would be compared to determine areas of agreement as well as areas of divergence