

Key Insights
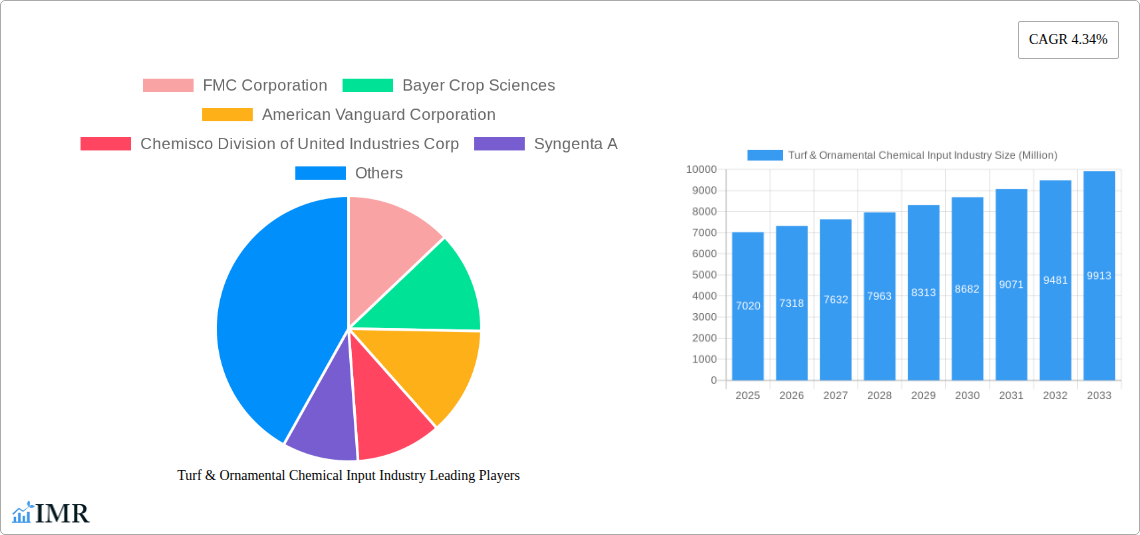
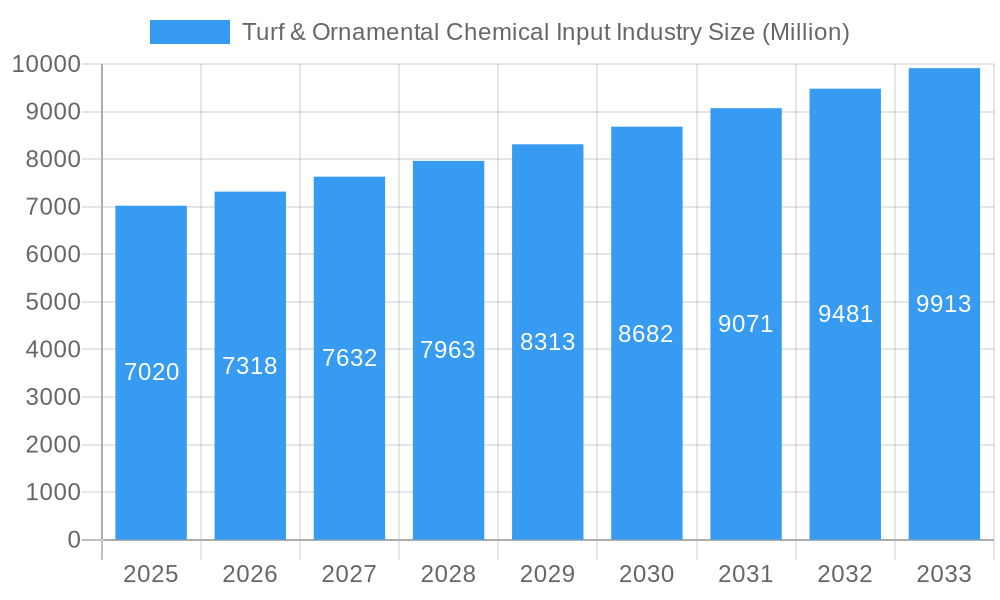
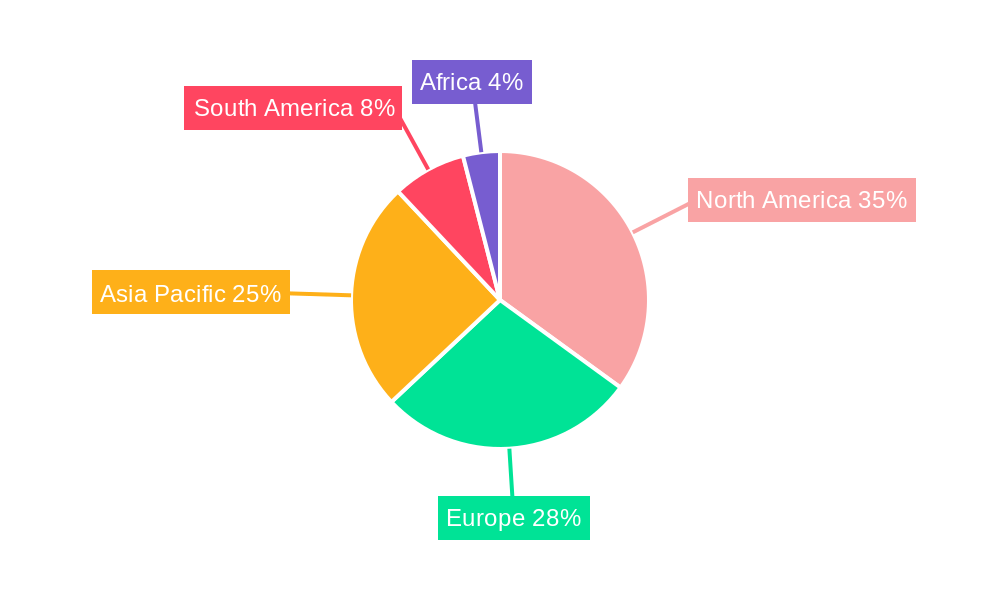
The global Turf & Ornamental Chemical Input market, valued at $7.02 billion in 2025, is projected to experience robust growth, driven by increasing urbanization, rising landscaping demands, and a growing preference for aesthetically pleasing outdoor spaces. This translates to a Compound Annual Growth Rate (CAGR) of 4.34% from 2025 to 2033. Key market drivers include the need for effective pest and disease control in turf and ornamental plants, the demand for improved yield and quality, and the increasing adoption of sustainable agricultural practices. The market is segmented by type of ornamental grass (Feather Reed Grass, Fountain Grass, Purple Millet, Ravenna Grass, Fibre Optic Grass, and Others), synthetic chemical inputs (pesticides, fertilizers, plant growth regulators, and others), and type of turf grass (Bermuda Grass, Zoysia Grass, Blue Kentucky Grass, Rye Grass, Tall Fescue, and Others). North America and Europe currently hold significant market shares, but the Asia-Pacific region is anticipated to witness rapid growth due to increasing disposable incomes and burgeoning infrastructure development. Major players like FMC Corporation, Bayer Crop Sciences, and Syngenta are shaping the market through innovation in product development and strategic partnerships. Challenges include stringent environmental regulations, fluctuating raw material prices, and the growing demand for organic and bio-based alternatives.
Turf & Ornamental Chemical Input Industry Market Size (In Billion)
The market's growth trajectory will be significantly influenced by advancements in chemical formulations, focusing on improved efficacy and reduced environmental impact. The increasing awareness of the environmental consequences of chemical usage is pushing the development and adoption of biopesticides and other sustainable solutions. Furthermore, the growing popularity of professional landscaping services and the rise of the DIY gardening segment are further fueling demand. Competition among established players and the emergence of new entrants will continue to intensify, requiring companies to focus on product differentiation, effective distribution networks, and strong brand building strategies to maintain their market positions. The forecast period (2025-2033) promises substantial opportunities for companies that can effectively cater to the evolving needs and preferences of the market.
Turf & Ornamental Chemical Input Industry Company Market Share
Turf & Ornamental Chemical Input Industry Market Report: 2019-2033
This comprehensive report provides a detailed analysis of the Turf & Ornamental Chemical Input industry, encompassing market dynamics, growth trends, regional performance, product landscape, and key players. With a study period spanning 2019-2033 (base year 2025, forecast period 2025-2033), this report offers invaluable insights for industry professionals, investors, and stakeholders seeking to understand and capitalize on this dynamic market. The report focuses on key segments including turf grass (Bermuda, Zoysia, Blue Kentucky, Rye, Tall Fescue, Others) and ornamental grasses (Feather Reed, Fountain, Purple Millet, Ravenna, Fibre Optic, Others), and chemical inputs (pesticides, fertilizers, plant growth regulators, others). The total market size is predicted to reach xx Million by 2033.
Turf & Ornamental Chemical Input Industry Market Dynamics & Structure
The Turf & Ornamental Chemical Input market is a dynamic and evolving sector characterized by a moderate degree of concentration. Leading global players such as FMC Corporation, Bayer Crop Sciences, and Syngenta command a significant share of the market, driving innovation and shaping industry trends. The market's trajectory is strongly influenced by a dual focus: continuous technological advancement, particularly in the development of sustainable and bio-based solutions, and navigating an increasingly stringent regulatory landscape concerning chemical usage and environmental impact. Competitive pressures are multifaceted, arising not only from established giants but also from agile emerging companies championing bio-pesticides and other eco-friendly alternatives. Mergers and acquisitions (M&A) remain a prevalent strategy, underscoring the industry's drive towards consolidation, portfolio expansion, and the acquisition of innovative technologies.
- Market Concentration: Moderately concentrated, with the top 5 players expected to hold approximately 55-65% market share in 2024.
- Technological Innovation: A pronounced emphasis on developing low-impact, high-efficacy products; biopesticides and microbial solutions are gaining significant traction.
- Regulatory Landscape: Increasingly stringent regulations on pesticide and herbicide use, coupled with environmental protection mandates, are significantly impacting product development cycles and market access.
- Competitive Substitutes: The rising adoption of biopesticides, beneficial insects, and comprehensive Integrated Pest Management (IPM) strategies presents a growing challenge to traditional chemical inputs.
- End-User Demographics: The primary end-users comprise professional landscaping services, golf course management, sports field maintenance, public parks, and a growing segment of residential users seeking to maintain their lawns and gardens.
- M&A Trends: Approximately 15-25 significant M&A deals were recorded between 2019-2024, reflecting ongoing industry consolidation and strategic realignment.
Turf & Ornamental Chemical Input Industry Growth Trends & Insights
The Turf & Ornamental Chemical Input market experienced a CAGR of xx% during the historical period (2019-2024), driven by increasing urbanization, rising disposable incomes, and growing demand for aesthetically pleasing landscapes. Technological advancements in product formulation and application methods have improved efficacy and reduced environmental impact. However, consumer awareness of environmental concerns and preference for sustainable solutions are influencing adoption rates. Market penetration of bio-pesticides is increasing steadily but remains relatively low compared to traditional chemical inputs. The forecast period (2025-2033) anticipates continued growth, albeit at a slightly moderated pace, influenced by evolving consumer preferences and regulatory changes. The market is expected to reach xx Million by 2033.
Dominant Regions, Countries, or Segments in Turf & Ornamental Chemical Input Industry
North America and Europe currently dominate the Turf & Ornamental Chemical Input market, driven by high per capita spending on landscaping and established turf management practices. However, Asia-Pacific is expected to witness significant growth during the forecast period, fuelled by increasing urbanization and rising disposable incomes. Within the product segments, pesticides currently hold the largest market share, followed by fertilizers and plant growth regulators. Among turf grasses, Bermuda and Zoysia grass hold significant market share. In ornamental grasses, Feather Reed and Fountain grasses are popular choices.
- Key Drivers (North America & Europe): High disposable incomes, established landscaping industry, strong regulatory frameworks (though stringent).
- Key Drivers (Asia-Pacific): Rapid urbanization, rising middle class, increasing demand for aesthetically pleasing landscapes.
- Segment Dominance: Pesticides (xx Million in 2024), followed by Fertilizers (xx Million in 2024). Bermuda and Zoysia grasses lead in the turf grass segment.
- Growth Potential: Asia-Pacific presents the highest growth potential due to expanding urban landscapes and increasing disposable income.
Turf & Ornamental Chemical Input Industry Product Landscape
The Turf & Ornamental Chemical Input market boasts an extensive and diverse product portfolio designed to enhance the health, appearance, and resilience of turfgrass and ornamental plants. This includes a robust offering of traditional chemical-based pesticides (herbicides, insecticides, fungicides), essential fertilizers providing vital nutrients, and plant growth regulators that manage developmental processes. Concurrently, there is a significant and growing segment of bio-based alternatives, derived from natural sources, which are gaining considerable market acceptance. Recent innovations are keenly focused on enhancing product efficacy, minimizing environmental footprints, and simplifying application processes for both professional applicators and end-consumers. Products are differentiated and marketed based on their proven effectiveness, demonstrable environmental profiles, and ease of integration into existing management practices. Key advancements include the development of sophisticated slow-release fertilizer formulations for sustained nutrient delivery and the introduction of highly targeted pesticides designed to precisely address specific pest or disease issues, thereby minimizing collateral environmental impact.
Key Drivers, Barriers & Challenges in Turf & Ornamental Chemical Input Industry
Key Drivers: The industry is propelled by several significant factors. The escalating demand for aesthetically pleasing and well-maintained landscapes, driven by urbanization and increased leisure time, fuels the need for effective turf and ornamental management solutions. Rising disposable incomes, particularly in developing economies, translate to greater investment in landscaping and garden care. Furthermore, continuous technological advancements are yielding more effective, targeted, and environmentally conscious products, thereby expanding market opportunities.
Key Barriers & Challenges: The industry faces considerable headwinds. Stringent environmental regulations and evolving public perception are increasingly limiting the use of certain conventional chemicals and favoring more sustainable options. The growing consumer preference for eco-friendly and organic alternatives presents a significant challenge to traditional product sales. Supply chain disruptions, amplified by global events, can impact the availability and cost of raw materials and finished goods. Intense competition among established multinational corporations and innovative new entrants offering disruptive solutions also shapes market dynamics. The impact of evolving regulatory changes could potentially lead to a market size reduction of approximately $500 Million - $800 Million by 2033, necessitating strategic adaptation.
Emerging Opportunities in Turf & Ornamental Chemical Input Industry
Emerging opportunities lie in the development and adoption of bio-pesticides and other sustainable solutions. The growing consumer demand for environmentally friendly products creates a significant opportunity for companies that offer these options. Untapped markets in developing countries also present significant growth potential. Furthermore, technological advancements in precision application techniques and data-driven solutions for optimizing turf and ornamental management represent key emerging opportunities.
Growth Accelerators in the Turf & Ornamental Chemical Input Industry
Long-term growth will be accelerated by strategic partnerships between chemical companies and technology providers, focused on developing advanced application systems and data analytics tools. Expansion into new geographical markets, particularly in developing economies, will also play a critical role. The development and adoption of innovative products, such as bio-based pesticides and fertilizers, is another key growth catalyst.
Key Players Shaping the Turf & Ornamental Chemical Input Market
- FMC Corporation
- Bayer Crop Sciences
- American Vanguard Corporation
- Chemisco Division of United Industries Corp
- Syngenta A
- Precision Laboratories
- DowDuPont (now Dow and DuPont de Nemours Inc. - separate entities)
- Monsanto Company (acquired by Bayer)
- Gowan International
- Chemtura Agro Solutions
- Adama Agricultural Solutions
- Koch Agronomic Services LLC
- Nufarm Ltd
- BASF SE
Notable Milestones in Turf & Ornamental Chemical Input Industry Sector
- March 2022: BASF introduced Pillar SC Intrinsic brand fungicide, offering broad-spectrum disease control. This launch significantly impacted the fungicide segment, boosting market competitiveness.
- January 2022: Syngenta's acquisition of Nematrident and Unispore bioinsecticides broadened its portfolio and strengthened its position in the biopesticide market, driving further market growth in this segment.
In-Depth Turf & Ornamental Chemical Input Industry Market Outlook
The Turf & Ornamental Chemical Input market is projected for sustained and robust growth in the coming years. This expansion will be underpinned by persistent global trends such as increasing urbanization, a rising global middle class with greater disposable incomes, and the unwavering demand for aesthetically appealing and functional green spaces. Strategic and substantial investments in research and development will be paramount for continued success, with a sharp focus on pioneering sustainable solutions, developing advanced application technologies for precision delivery, and enhancing product biodegradability. Companies that proactively embrace environmentally friendly product formulations and leverage cutting-edge precision application technologies are poised to achieve a distinct competitive advantage. The market exhibits significant untapped potential for expansion, particularly in rapidly developing economies and through the widespread adoption of innovative, next-generation products that address both efficacy and sustainability demands.
Turf & Ornamental Chemical Input Industry Segmentation
-
1. Type of Turf Grass
- 1.1. Bermuda Grass
- 1.2. Zoysia Grass
- 1.3. Blue Kentucky Grass
- 1.4. Rye Grass
- 1.5. Tall Fescue
- 1.6. Others
-
2. Type of Ornamental Grass
- 2.1. Feather Reed Grass
- 2.2. Fountain Grass
- 2.3. Purple Millet
- 2.4. Ravenna Grass
- 2.5. Fibre Optic Grass
- 2.6. Others
-
3. Synthetic Chemical Inputs
- 3.1. Pesticides
- 3.2. Fertilizers
- 3.3. Plant Growth Regulators
- 3.4. Others
-
4. Type of Turf Grass
- 4.1. Bermuda Grass
- 4.2. Zoysia Grass
- 4.3. Blue Kentucky Grass
- 4.4. Rye Grass
- 4.5. Tall Fescue
- 4.6. Others
-
5. Type of Ornamental Grass
- 5.1. Feather Reed Grass
- 5.2. Fountain Grass
- 5.3. Purple Millet
- 5.4. Ravenna Grass
- 5.5. Fibre Optic Grass
- 5.6. Others
-
6. Synthetic Chemical Inputs
- 6.1. Pesticides
- 6.2. Fertilizers
- 6.3. Plant Growth Regulators
- 6.4. Others
Turf & Ornamental Chemical Input Industry Segmentation By Geography
-
1. North America
- 1.1. United States
- 1.2. Canada
- 1.3. Mexico
- 1.4. Rest of North America
-
2. Europe
- 2.1. Spain
- 2.2. United Kingdom
- 2.3. France
- 2.4. Germany
- 2.5. Denmark
- 2.6. Italy
- 2.7. Rest of Europe
-
3. Asia Pacific
- 3.1. China
- 3.2. India
- 3.3. Japan
- 3.4. Thailand
- 3.5. Australia
- 3.6. Rest of Asia Pacific
-
4. South America
- 4.1. Brazil
- 4.2. Argentina
- 4.3. Rest of South America
-
5. Africa
- 5.1. South Africa
- 5.2. Rest of Africa
Turf & Ornamental Chemical Input Industry Regional Market Share
Geographic Coverage of Turf & Ornamental Chemical Input Industry
Turf & Ornamental Chemical Input Industry REPORT HIGHLIGHTS
| Aspects | Details |
|---|---|
| Study Period | 2020-2034 |
| Base Year | 2025 |
| Estimated Year | 2026 |
| Forecast Period | 2026-2034 |
| Historical Period | 2020-2025 |
| Growth Rate | CAGR of 4.34% from 2020-2034 |
| Segmentation |
|
Table of Contents
- 1. Introduction
- 1.1. Research Scope
- 1.2. Market Segmentation
- 1.3. Research Objective
- 1.4. Definitions and Assumptions
- 2. Executive Summary
- 2.1. Market Snapshot
- 3. Market Dynamics
- 3.1. Market Drivers
- 3.2. Market Restrains
- 3.3. Market Trends
- 3.4. Market Opportunities
- 4. Market Factor Analysis
- 4.1. Porters Five Forces
- 4.1.1. Bargaining Power of Suppliers
- 4.1.2. Bargaining Power of Buyers
- 4.1.3. Threat of New Entrants
- 4.1.4. Threat of Substitutes
- 4.1.5. Competitive Rivalry
- 4.2. PESTEL analysis
- 4.3. BCG Analysis
- 4.3.1. Stars (High Growth, High Market Share)
- 4.3.2. Cash Cows (Low Growth, High Market Share)
- 4.3.3. Question Mark (High Growth, Low Market Share)
- 4.3.4. Dogs (Low Growth, Low Market Share)
- 4.4. Ansoff Matrix Analysis
- 4.5. Supply Chain Analysis
- 4.6. Regulatory Landscape
- 4.7. Current Market Potential and Opportunity Assessment (TAM–SAM–SOM Framework)
- 4.8. IMR Analyst Note
- 4.1. Porters Five Forces
- 5. Market Analysis, Insights and Forecast 2021-2033
- 5.1. Market Analysis, Insights and Forecast - by Type of Turf Grass
- 5.1.1. Bermuda Grass
- 5.1.2. Zoysia Grass
- 5.1.3. Blue Kentucky Grass
- 5.1.4. Rye Grass
- 5.1.5. Tall Fescue
- 5.1.6. Others
- 5.2. Market Analysis, Insights and Forecast - by Type of Ornamental Grass
- 5.2.1. Feather Reed Grass
- 5.2.2. Fountain Grass
- 5.2.3. Purple Millet
- 5.2.4. Ravenna Grass
- 5.2.5. Fibre Optic Grass
- 5.2.6. Others
- 5.3. Market Analysis, Insights and Forecast - by Synthetic Chemical Inputs
- 5.3.1. Pesticides
- 5.3.2. Fertilizers
- 5.3.3. Plant Growth Regulators
- 5.3.4. Others
- 5.4. Market Analysis, Insights and Forecast - by Type of Turf Grass
- 5.4.1. Bermuda Grass
- 5.4.2. Zoysia Grass
- 5.4.3. Blue Kentucky Grass
- 5.4.4. Rye Grass
- 5.4.5. Tall Fescue
- 5.4.6. Others
- 5.5. Market Analysis, Insights and Forecast - by Type of Ornamental Grass
- 5.5.1. Feather Reed Grass
- 5.5.2. Fountain Grass
- 5.5.3. Purple Millet
- 5.5.4. Ravenna Grass
- 5.5.5. Fibre Optic Grass
- 5.5.6. Others
- 5.6. Market Analysis, Insights and Forecast - by Synthetic Chemical Inputs
- 5.6.1. Pesticides
- 5.6.2. Fertilizers
- 5.6.3. Plant Growth Regulators
- 5.6.4. Others
- 5.7. Market Analysis, Insights and Forecast - by Region
- 5.7.1. North America
- 5.7.2. Europe
- 5.7.3. Asia Pacific
- 5.7.4. South America
- 5.7.5. Africa
- 5.1. Market Analysis, Insights and Forecast - by Type of Turf Grass
- 6. Global Turf & Ornamental Chemical Input Industry Analysis, Insights and Forecast, 2021-2033
- 6.1. Market Analysis, Insights and Forecast - by Type of Turf Grass
- 6.1.1. Bermuda Grass
- 6.1.2. Zoysia Grass
- 6.1.3. Blue Kentucky Grass
- 6.1.4. Rye Grass
- 6.1.5. Tall Fescue
- 6.1.6. Others
- 6.2. Market Analysis, Insights and Forecast - by Type of Ornamental Grass
- 6.2.1. Feather Reed Grass
- 6.2.2. Fountain Grass
- 6.2.3. Purple Millet
- 6.2.4. Ravenna Grass
- 6.2.5. Fibre Optic Grass
- 6.2.6. Others
- 6.3. Market Analysis, Insights and Forecast - by Synthetic Chemical Inputs
- 6.3.1. Pesticides
- 6.3.2. Fertilizers
- 6.3.3. Plant Growth Regulators
- 6.3.4. Others
- 6.4. Market Analysis, Insights and Forecast - by Type of Turf Grass
- 6.4.1. Bermuda Grass
- 6.4.2. Zoysia Grass
- 6.4.3. Blue Kentucky Grass
- 6.4.4. Rye Grass
- 6.4.5. Tall Fescue
- 6.4.6. Others
- 6.5. Market Analysis, Insights and Forecast - by Type of Ornamental Grass
- 6.5.1. Feather Reed Grass
- 6.5.2. Fountain Grass
- 6.5.3. Purple Millet
- 6.5.4. Ravenna Grass
- 6.5.5. Fibre Optic Grass
- 6.5.6. Others
- 6.6. Market Analysis, Insights and Forecast - by Synthetic Chemical Inputs
- 6.6.1. Pesticides
- 6.6.2. Fertilizers
- 6.6.3. Plant Growth Regulators
- 6.6.4. Others
- 6.1. Market Analysis, Insights and Forecast - by Type of Turf Grass
- 7. North America Turf & Ornamental Chemical Input Industry Analysis, Insights and Forecast, 2020-2032
- 7.1. Market Analysis, Insights and Forecast - by Type of Turf Grass
- 7.1.1. Bermuda Grass
- 7.1.2. Zoysia Grass
- 7.1.3. Blue Kentucky Grass
- 7.1.4. Rye Grass
- 7.1.5. Tall Fescue
- 7.1.6. Others
- 7.2. Market Analysis, Insights and Forecast - by Type of Ornamental Grass
- 7.2.1. Feather Reed Grass
- 7.2.2. Fountain Grass
- 7.2.3. Purple Millet
- 7.2.4. Ravenna Grass
- 7.2.5. Fibre Optic Grass
- 7.2.6. Others
- 7.3. Market Analysis, Insights and Forecast - by Synthetic Chemical Inputs
- 7.3.1. Pesticides
- 7.3.2. Fertilizers
- 7.3.3. Plant Growth Regulators
- 7.3.4. Others
- 7.4. Market Analysis, Insights and Forecast - by Type of Turf Grass
- 7.4.1. Bermuda Grass
- 7.4.2. Zoysia Grass
- 7.4.3. Blue Kentucky Grass
- 7.4.4. Rye Grass
- 7.4.5. Tall Fescue
- 7.4.6. Others
- 7.5. Market Analysis, Insights and Forecast - by Type of Ornamental Grass
- 7.5.1. Feather Reed Grass
- 7.5.2. Fountain Grass
- 7.5.3. Purple Millet
- 7.5.4. Ravenna Grass
- 7.5.5. Fibre Optic Grass
- 7.5.6. Others
- 7.6. Market Analysis, Insights and Forecast - by Synthetic Chemical Inputs
- 7.6.1. Pesticides
- 7.6.2. Fertilizers
- 7.6.3. Plant Growth Regulators
- 7.6.4. Others
- 7.1. Market Analysis, Insights and Forecast - by Type of Turf Grass
- 8. Europe Turf & Ornamental Chemical Input Industry Analysis, Insights and Forecast, 2020-2032
- 8.1. Market Analysis, Insights and Forecast - by Type of Turf Grass
- 8.1.1. Bermuda Grass
- 8.1.2. Zoysia Grass
- 8.1.3. Blue Kentucky Grass
- 8.1.4. Rye Grass
- 8.1.5. Tall Fescue
- 8.1.6. Others
- 8.2. Market Analysis, Insights and Forecast - by Type of Ornamental Grass
- 8.2.1. Feather Reed Grass
- 8.2.2. Fountain Grass
- 8.2.3. Purple Millet
- 8.2.4. Ravenna Grass
- 8.2.5. Fibre Optic Grass
- 8.2.6. Others
- 8.3. Market Analysis, Insights and Forecast - by Synthetic Chemical Inputs
- 8.3.1. Pesticides
- 8.3.2. Fertilizers
- 8.3.3. Plant Growth Regulators
- 8.3.4. Others
- 8.4. Market Analysis, Insights and Forecast - by Type of Turf Grass
- 8.4.1. Bermuda Grass
- 8.4.2. Zoysia Grass
- 8.4.3. Blue Kentucky Grass
- 8.4.4. Rye Grass
- 8.4.5. Tall Fescue
- 8.4.6. Others
- 8.5. Market Analysis, Insights and Forecast - by Type of Ornamental Grass
- 8.5.1. Feather Reed Grass
- 8.5.2. Fountain Grass
- 8.5.3. Purple Millet
- 8.5.4. Ravenna Grass
- 8.5.5. Fibre Optic Grass
- 8.5.6. Others
- 8.6. Market Analysis, Insights and Forecast - by Synthetic Chemical Inputs
- 8.6.1. Pesticides
- 8.6.2. Fertilizers
- 8.6.3. Plant Growth Regulators
- 8.6.4. Others
- 8.1. Market Analysis, Insights and Forecast - by Type of Turf Grass
- 9. Asia Pacific Turf & Ornamental Chemical Input Industry Analysis, Insights and Forecast, 2020-2032
- 9.1. Market Analysis, Insights and Forecast - by Type of Turf Grass
- 9.1.1. Bermuda Grass
- 9.1.2. Zoysia Grass
- 9.1.3. Blue Kentucky Grass
- 9.1.4. Rye Grass
- 9.1.5. Tall Fescue
- 9.1.6. Others
- 9.2. Market Analysis, Insights and Forecast - by Type of Ornamental Grass
- 9.2.1. Feather Reed Grass
- 9.2.2. Fountain Grass
- 9.2.3. Purple Millet
- 9.2.4. Ravenna Grass
- 9.2.5. Fibre Optic Grass
- 9.2.6. Others
- 9.3. Market Analysis, Insights and Forecast - by Synthetic Chemical Inputs
- 9.3.1. Pesticides
- 9.3.2. Fertilizers
- 9.3.3. Plant Growth Regulators
- 9.3.4. Others
- 9.4. Market Analysis, Insights and Forecast - by Type of Turf Grass
- 9.4.1. Bermuda Grass
- 9.4.2. Zoysia Grass
- 9.4.3. Blue Kentucky Grass
- 9.4.4. Rye Grass
- 9.4.5. Tall Fescue
- 9.4.6. Others
- 9.5. Market Analysis, Insights and Forecast - by Type of Ornamental Grass
- 9.5.1. Feather Reed Grass
- 9.5.2. Fountain Grass
- 9.5.3. Purple Millet
- 9.5.4. Ravenna Grass
- 9.5.5. Fibre Optic Grass
- 9.5.6. Others
- 9.6. Market Analysis, Insights and Forecast - by Synthetic Chemical Inputs
- 9.6.1. Pesticides
- 9.6.2. Fertilizers
- 9.6.3. Plant Growth Regulators
- 9.6.4. Others
- 9.1. Market Analysis, Insights and Forecast - by Type of Turf Grass
- 10. South America Turf & Ornamental Chemical Input Industry Analysis, Insights and Forecast, 2020-2032
- 10.1. Market Analysis, Insights and Forecast - by Type of Turf Grass
- 10.1.1. Bermuda Grass
- 10.1.2. Zoysia Grass
- 10.1.3. Blue Kentucky Grass
- 10.1.4. Rye Grass
- 10.1.5. Tall Fescue
- 10.1.6. Others
- 10.2. Market Analysis, Insights and Forecast - by Type of Ornamental Grass
- 10.2.1. Feather Reed Grass
- 10.2.2. Fountain Grass
- 10.2.3. Purple Millet
- 10.2.4. Ravenna Grass
- 10.2.5. Fibre Optic Grass
- 10.2.6. Others
- 10.3. Market Analysis, Insights and Forecast - by Synthetic Chemical Inputs
- 10.3.1. Pesticides
- 10.3.2. Fertilizers
- 10.3.3. Plant Growth Regulators
- 10.3.4. Others
- 10.4. Market Analysis, Insights and Forecast - by Type of Turf Grass
- 10.4.1. Bermuda Grass
- 10.4.2. Zoysia Grass
- 10.4.3. Blue Kentucky Grass
- 10.4.4. Rye Grass
- 10.4.5. Tall Fescue
- 10.4.6. Others
- 10.5. Market Analysis, Insights and Forecast - by Type of Ornamental Grass
- 10.5.1. Feather Reed Grass
- 10.5.2. Fountain Grass
- 10.5.3. Purple Millet
- 10.5.4. Ravenna Grass
- 10.5.5. Fibre Optic Grass
- 10.5.6. Others
- 10.6. Market Analysis, Insights and Forecast - by Synthetic Chemical Inputs
- 10.6.1. Pesticides
- 10.6.2. Fertilizers
- 10.6.3. Plant Growth Regulators
- 10.6.4. Others
- 10.1. Market Analysis, Insights and Forecast - by Type of Turf Grass
- 11. Africa Turf & Ornamental Chemical Input Industry Analysis, Insights and Forecast, 2020-2032
- 11.1. Market Analysis, Insights and Forecast - by Type of Turf Grass
- 11.1.1. Bermuda Grass
- 11.1.2. Zoysia Grass
- 11.1.3. Blue Kentucky Grass
- 11.1.4. Rye Grass
- 11.1.5. Tall Fescue
- 11.1.6. Others
- 11.2. Market Analysis, Insights and Forecast - by Type of Ornamental Grass
- 11.2.1. Feather Reed Grass
- 11.2.2. Fountain Grass
- 11.2.3. Purple Millet
- 11.2.4. Ravenna Grass
- 11.2.5. Fibre Optic Grass
- 11.2.6. Others
- 11.3. Market Analysis, Insights and Forecast - by Synthetic Chemical Inputs
- 11.3.1. Pesticides
- 11.3.2. Fertilizers
- 11.3.3. Plant Growth Regulators
- 11.3.4. Others
- 11.4. Market Analysis, Insights and Forecast - by Type of Turf Grass
- 11.4.1. Bermuda Grass
- 11.4.2. Zoysia Grass
- 11.4.3. Blue Kentucky Grass
- 11.4.4. Rye Grass
- 11.4.5. Tall Fescue
- 11.4.6. Others
- 11.5. Market Analysis, Insights and Forecast - by Type of Ornamental Grass
- 11.5.1. Feather Reed Grass
- 11.5.2. Fountain Grass
- 11.5.3. Purple Millet
- 11.5.4. Ravenna Grass
- 11.5.5. Fibre Optic Grass
- 11.5.6. Others
- 11.6. Market Analysis, Insights and Forecast - by Synthetic Chemical Inputs
- 11.6.1. Pesticides
- 11.6.2. Fertilizers
- 11.6.3. Plant Growth Regulators
- 11.6.4. Others
- 11.1. Market Analysis, Insights and Forecast - by Type of Turf Grass
- 12. Competitive Analysis
- 12.1. Company Profiles
- 12.1.1 FMC Corporation
- 12.1.1.1. Company Overview
- 12.1.1.2. Products
- 12.1.1.3. Company Financials
- 12.1.1.4. SWOT Analysis
- 12.1.2 Bayer Crop Sciences
- 12.1.2.1. Company Overview
- 12.1.2.2. Products
- 12.1.2.3. Company Financials
- 12.1.2.4. SWOT Analysis
- 12.1.3 American Vanguard Corporation
- 12.1.3.1. Company Overview
- 12.1.3.2. Products
- 12.1.3.3. Company Financials
- 12.1.3.4. SWOT Analysis
- 12.1.4 Chemisco Division of United Industries Corp
- 12.1.4.1. Company Overview
- 12.1.4.2. Products
- 12.1.4.3. Company Financials
- 12.1.4.4. SWOT Analysis
- 12.1.5 Syngenta A
- 12.1.5.1. Company Overview
- 12.1.5.2. Products
- 12.1.5.3. Company Financials
- 12.1.5.4. SWOT Analysis
- 12.1.6 Precision Laboratories
- 12.1.6.1. Company Overview
- 12.1.6.2. Products
- 12.1.6.3. Company Financials
- 12.1.6.4. SWOT Analysis
- 12.1.7 DowDuPont
- 12.1.7.1. Company Overview
- 12.1.7.2. Products
- 12.1.7.3. Company Financials
- 12.1.7.4. SWOT Analysis
- 12.1.8 Monsanto Company
- 12.1.8.1. Company Overview
- 12.1.8.2. Products
- 12.1.8.3. Company Financials
- 12.1.8.4. SWOT Analysis
- 12.1.9 Gowan International
- 12.1.9.1. Company Overview
- 12.1.9.2. Products
- 12.1.9.3. Company Financials
- 12.1.9.4. SWOT Analysis
- 12.1.10 Chemtura Agro Solutions
- 12.1.10.1. Company Overview
- 12.1.10.2. Products
- 12.1.10.3. Company Financials
- 12.1.10.4. SWOT Analysis
- 12.1.11 Adama Agricultural Solutions
- 12.1.11.1. Company Overview
- 12.1.11.2. Products
- 12.1.11.3. Company Financials
- 12.1.11.4. SWOT Analysis
- 12.1.12 Koch Agronomic Services LLC
- 12.1.12.1. Company Overview
- 12.1.12.2. Products
- 12.1.12.3. Company Financials
- 12.1.12.4. SWOT Analysis
- 12.1.13 Nufarm Ltd
- 12.1.13.1. Company Overview
- 12.1.13.2. Products
- 12.1.13.3. Company Financials
- 12.1.13.4. SWOT Analysis
- 12.1.14 BASF SE
- 12.1.14.1. Company Overview
- 12.1.14.2. Products
- 12.1.14.3. Company Financials
- 12.1.14.4. SWOT Analysis
- 12.1.1 FMC Corporation
- 12.2. Market Entropy
- 12.2.1 Company's Key Areas Served
- 12.2.2 Recent Developments
- 12.3. Company Market Share Analysis 2025
- 12.3.1 Top 5 Companies Market Share Analysis
- 12.3.2 Top 3 Companies Market Share Analysis
- 12.4. List of Potential Customers
- 13. Research Methodology
List of Figures
- Figure 1: Global Turf & Ornamental Chemical Input Industry Revenue Breakdown (Million, %) by Region 2025 & 2033
- Figure 2: Global Turf & Ornamental Chemical Input Industry Volume Breakdown (Kiloton, %) by Region 2025 & 2033
- Figure 3: North America Turf & Ornamental Chemical Input Industry Revenue (Million), by Type of Turf Grass 2025 & 2033
- Figure 4: North America Turf & Ornamental Chemical Input Industry Volume (Kiloton), by Type of Turf Grass 2025 & 2033
- Figure 5: North America Turf & Ornamental Chemical Input Industry Revenue Share (%), by Type of Turf Grass 2025 & 2033
- Figure 6: North America Turf & Ornamental Chemical Input Industry Volume Share (%), by Type of Turf Grass 2025 & 2033
- Figure 7: North America Turf & Ornamental Chemical Input Industry Revenue (Million), by Type of Ornamental Grass 2025 & 2033
- Figure 8: North America Turf & Ornamental Chemical Input Industry Volume (Kiloton), by Type of Ornamental Grass 2025 & 2033
- Figure 9: North America Turf & Ornamental Chemical Input Industry Revenue Share (%), by Type of Ornamental Grass 2025 & 2033
- Figure 10: North America Turf & Ornamental Chemical Input Industry Volume Share (%), by Type of Ornamental Grass 2025 & 2033
- Figure 11: North America Turf & Ornamental Chemical Input Industry Revenue (Million), by Synthetic Chemical Inputs 2025 & 2033
- Figure 12: North America Turf & Ornamental Chemical Input Industry Volume (Kiloton), by Synthetic Chemical Inputs 2025 & 2033
- Figure 13: North America Turf & Ornamental Chemical Input Industry Revenue Share (%), by Synthetic Chemical Inputs 2025 & 2033
- Figure 14: North America Turf & Ornamental Chemical Input Industry Volume Share (%), by Synthetic Chemical Inputs 2025 & 2033
- Figure 15: North America Turf & Ornamental Chemical Input Industry Revenue (Million), by Type of Turf Grass 2025 & 2033
- Figure 16: North America Turf & Ornamental Chemical Input Industry Volume (Kiloton), by Type of Turf Grass 2025 & 2033
- Figure 17: North America Turf & Ornamental Chemical Input Industry Revenue Share (%), by Type of Turf Grass 2025 & 2033
- Figure 18: North America Turf & Ornamental Chemical Input Industry Volume Share (%), by Type of Turf Grass 2025 & 2033
- Figure 19: North America Turf & Ornamental Chemical Input Industry Revenue (Million), by Type of Ornamental Grass 2025 & 2033
- Figure 20: North America Turf & Ornamental Chemical Input Industry Volume (Kiloton), by Type of Ornamental Grass 2025 & 2033
- Figure 21: North America Turf & Ornamental Chemical Input Industry Revenue Share (%), by Type of Ornamental Grass 2025 & 2033
- Figure 22: North America Turf & Ornamental Chemical Input Industry Volume Share (%), by Type of Ornamental Grass 2025 & 2033
- Figure 23: North America Turf & Ornamental Chemical Input Industry Revenue (Million), by Synthetic Chemical Inputs 2025 & 2033
- Figure 24: North America Turf & Ornamental Chemical Input Industry Volume (Kiloton), by Synthetic Chemical Inputs 2025 & 2033
- Figure 25: North America Turf & Ornamental Chemical Input Industry Revenue Share (%), by Synthetic Chemical Inputs 2025 & 2033
- Figure 26: North America Turf & Ornamental Chemical Input Industry Volume Share (%), by Synthetic Chemical Inputs 2025 & 2033
- Figure 27: North America Turf & Ornamental Chemical Input Industry Revenue (Million), by Country 2025 & 2033
- Figure 28: North America Turf & Ornamental Chemical Input Industry Volume (Kiloton), by Country 2025 & 2033
- Figure 29: North America Turf & Ornamental Chemical Input Industry Revenue Share (%), by Country 2025 & 2033
- Figure 30: North America Turf & Ornamental Chemical Input Industry Volume Share (%), by Country 2025 & 2033
- Figure 31: Europe Turf & Ornamental Chemical Input Industry Revenue (Million), by Type of Turf Grass 2025 & 2033
- Figure 32: Europe Turf & Ornamental Chemical Input Industry Volume (Kiloton), by Type of Turf Grass 2025 & 2033
- Figure 33: Europe Turf & Ornamental Chemical Input Industry Revenue Share (%), by Type of Turf Grass 2025 & 2033
- Figure 34: Europe Turf & Ornamental Chemical Input Industry Volume Share (%), by Type of Turf Grass 2025 & 2033
- Figure 35: Europe Turf & Ornamental Chemical Input Industry Revenue (Million), by Type of Ornamental Grass 2025 & 2033
- Figure 36: Europe Turf & Ornamental Chemical Input Industry Volume (Kiloton), by Type of Ornamental Grass 2025 & 2033
- Figure 37: Europe Turf & Ornamental Chemical Input Industry Revenue Share (%), by Type of Ornamental Grass 2025 & 2033
- Figure 38: Europe Turf & Ornamental Chemical Input Industry Volume Share (%), by Type of Ornamental Grass 2025 & 2033
- Figure 39: Europe Turf & Ornamental Chemical Input Industry Revenue (Million), by Synthetic Chemical Inputs 2025 & 2033
- Figure 40: Europe Turf & Ornamental Chemical Input Industry Volume (Kiloton), by Synthetic Chemical Inputs 2025 & 2033
- Figure 41: Europe Turf & Ornamental Chemical Input Industry Revenue Share (%), by Synthetic Chemical Inputs 2025 & 2033
- Figure 42: Europe Turf & Ornamental Chemical Input Industry Volume Share (%), by Synthetic Chemical Inputs 2025 & 2033
- Figure 43: Europe Turf & Ornamental Chemical Input Industry Revenue (Million), by Type of Turf Grass 2025 & 2033
- Figure 44: Europe Turf & Ornamental Chemical Input Industry Volume (Kiloton), by Type of Turf Grass 2025 & 2033
- Figure 45: Europe Turf & Ornamental Chemical Input Industry Revenue Share (%), by Type of Turf Grass 2025 & 2033
- Figure 46: Europe Turf & Ornamental Chemical Input Industry Volume Share (%), by Type of Turf Grass 2025 & 2033
- Figure 47: Europe Turf & Ornamental Chemical Input Industry Revenue (Million), by Type of Ornamental Grass 2025 & 2033
- Figure 48: Europe Turf & Ornamental Chemical Input Industry Volume (Kiloton), by Type of Ornamental Grass 2025 & 2033
- Figure 49: Europe Turf & Ornamental Chemical Input Industry Revenue Share (%), by Type of Ornamental Grass 2025 & 2033
- Figure 50: Europe Turf & Ornamental Chemical Input Industry Volume Share (%), by Type of Ornamental Grass 2025 & 2033
- Figure 51: Europe Turf & Ornamental Chemical Input Industry Revenue (Million), by Synthetic Chemical Inputs 2025 & 2033
- Figure 52: Europe Turf & Ornamental Chemical Input Industry Volume (Kiloton), by Synthetic Chemical Inputs 2025 & 2033
- Figure 53: Europe Turf & Ornamental Chemical Input Industry Revenue Share (%), by Synthetic Chemical Inputs 2025 & 2033
- Figure 54: Europe Turf & Ornamental Chemical Input Industry Volume Share (%), by Synthetic Chemical Inputs 2025 & 2033
- Figure 55: Europe Turf & Ornamental Chemical Input Industry Revenue (Million), by Country 2025 & 2033
- Figure 56: Europe Turf & Ornamental Chemical Input Industry Volume (Kiloton), by Country 2025 & 2033
- Figure 57: Europe Turf & Ornamental Chemical Input Industry Revenue Share (%), by Country 2025 & 2033
- Figure 58: Europe Turf & Ornamental Chemical Input Industry Volume Share (%), by Country 2025 & 2033
- Figure 59: Asia Pacific Turf & Ornamental Chemical Input Industry Revenue (Million), by Type of Turf Grass 2025 & 2033
- Figure 60: Asia Pacific Turf & Ornamental Chemical Input Industry Volume (Kiloton), by Type of Turf Grass 2025 & 2033
- Figure 61: Asia Pacific Turf & Ornamental Chemical Input Industry Revenue Share (%), by Type of Turf Grass 2025 & 2033
- Figure 62: Asia Pacific Turf & Ornamental Chemical Input Industry Volume Share (%), by Type of Turf Grass 2025 & 2033
- Figure 63: Asia Pacific Turf & Ornamental Chemical Input Industry Revenue (Million), by Type of Ornamental Grass 2025 & 2033
- Figure 64: Asia Pacific Turf & Ornamental Chemical Input Industry Volume (Kiloton), by Type of Ornamental Grass 2025 & 2033
- Figure 65: Asia Pacific Turf & Ornamental Chemical Input Industry Revenue Share (%), by Type of Ornamental Grass 2025 & 2033
- Figure 66: Asia Pacific Turf & Ornamental Chemical Input Industry Volume Share (%), by Type of Ornamental Grass 2025 & 2033
- Figure 67: Asia Pacific Turf & Ornamental Chemical Input Industry Revenue (Million), by Synthetic Chemical Inputs 2025 & 2033
- Figure 68: Asia Pacific Turf & Ornamental Chemical Input Industry Volume (Kiloton), by Synthetic Chemical Inputs 2025 & 2033
- Figure 69: Asia Pacific Turf & Ornamental Chemical Input Industry Revenue Share (%), by Synthetic Chemical Inputs 2025 & 2033
- Figure 70: Asia Pacific Turf & Ornamental Chemical Input Industry Volume Share (%), by Synthetic Chemical Inputs 2025 & 2033
- Figure 71: Asia Pacific Turf & Ornamental Chemical Input Industry Revenue (Million), by Type of Turf Grass 2025 & 2033
- Figure 72: Asia Pacific Turf & Ornamental Chemical Input Industry Volume (Kiloton), by Type of Turf Grass 2025 & 2033
- Figure 73: Asia Pacific Turf & Ornamental Chemical Input Industry Revenue Share (%), by Type of Turf Grass 2025 & 2033
- Figure 74: Asia Pacific Turf & Ornamental Chemical Input Industry Volume Share (%), by Type of Turf Grass 2025 & 2033
- Figure 75: Asia Pacific Turf & Ornamental Chemical Input Industry Revenue (Million), by Type of Ornamental Grass 2025 & 2033
- Figure 76: Asia Pacific Turf & Ornamental Chemical Input Industry Volume (Kiloton), by Type of Ornamental Grass 2025 & 2033
- Figure 77: Asia Pacific Turf & Ornamental Chemical Input Industry Revenue Share (%), by Type of Ornamental Grass 2025 & 2033
- Figure 78: Asia Pacific Turf & Ornamental Chemical Input Industry Volume Share (%), by Type of Ornamental Grass 2025 & 2033
- Figure 79: Asia Pacific Turf & Ornamental Chemical Input Industry Revenue (Million), by Synthetic Chemical Inputs 2025 & 2033
- Figure 80: Asia Pacific Turf & Ornamental Chemical Input Industry Volume (Kiloton), by Synthetic Chemical Inputs 2025 & 2033
- Figure 81: Asia Pacific Turf & Ornamental Chemical Input Industry Revenue Share (%), by Synthetic Chemical Inputs 2025 & 2033
- Figure 82: Asia Pacific Turf & Ornamental Chemical Input Industry Volume Share (%), by Synthetic Chemical Inputs 2025 & 2033
- Figure 83: Asia Pacific Turf & Ornamental Chemical Input Industry Revenue (Million), by Country 2025 & 2033
- Figure 84: Asia Pacific Turf & Ornamental Chemical Input Industry Volume (Kiloton), by Country 2025 & 2033
- Figure 85: Asia Pacific Turf & Ornamental Chemical Input Industry Revenue Share (%), by Country 2025 & 2033
- Figure 86: Asia Pacific Turf & Ornamental Chemical Input Industry Volume Share (%), by Country 2025 & 2033
- Figure 87: South America Turf & Ornamental Chemical Input Industry Revenue (Million), by Type of Turf Grass 2025 & 2033
- Figure 88: South America Turf & Ornamental Chemical Input Industry Volume (Kiloton), by Type of Turf Grass 2025 & 2033
- Figure 89: South America Turf & Ornamental Chemical Input Industry Revenue Share (%), by Type of Turf Grass 2025 & 2033
- Figure 90: South America Turf & Ornamental Chemical Input Industry Volume Share (%), by Type of Turf Grass 2025 & 2033
- Figure 91: South America Turf & Ornamental Chemical Input Industry Revenue (Million), by Type of Ornamental Grass 2025 & 2033
- Figure 92: South America Turf & Ornamental Chemical Input Industry Volume (Kiloton), by Type of Ornamental Grass 2025 & 2033
- Figure 93: South America Turf & Ornamental Chemical Input Industry Revenue Share (%), by Type of Ornamental Grass 2025 & 2033
- Figure 94: South America Turf & Ornamental Chemical Input Industry Volume Share (%), by Type of Ornamental Grass 2025 & 2033
- Figure 95: South America Turf & Ornamental Chemical Input Industry Revenue (Million), by Synthetic Chemical Inputs 2025 & 2033
- Figure 96: South America Turf & Ornamental Chemical Input Industry Volume (Kiloton), by Synthetic Chemical Inputs 2025 & 2033
- Figure 97: South America Turf & Ornamental Chemical Input Industry Revenue Share (%), by Synthetic Chemical Inputs 2025 & 2033
- Figure 98: South America Turf & Ornamental Chemical Input Industry Volume Share (%), by Synthetic Chemical Inputs 2025 & 2033
- Figure 99: South America Turf & Ornamental Chemical Input Industry Revenue (Million), by Type of Turf Grass 2025 & 2033
- Figure 100: South America Turf & Ornamental Chemical Input Industry Volume (Kiloton), by Type of Turf Grass 2025 & 2033
- Figure 101: South America Turf & Ornamental Chemical Input Industry Revenue Share (%), by Type of Turf Grass 2025 & 2033
- Figure 102: South America Turf & Ornamental Chemical Input Industry Volume Share (%), by Type of Turf Grass 2025 & 2033
- Figure 103: South America Turf & Ornamental Chemical Input Industry Revenue (Million), by Type of Ornamental Grass 2025 & 2033
- Figure 104: South America Turf & Ornamental Chemical Input Industry Volume (Kiloton), by Type of Ornamental Grass 2025 & 2033
- Figure 105: South America Turf & Ornamental Chemical Input Industry Revenue Share (%), by Type of Ornamental Grass 2025 & 2033
- Figure 106: South America Turf & Ornamental Chemical Input Industry Volume Share (%), by Type of Ornamental Grass 2025 & 2033
- Figure 107: South America Turf & Ornamental Chemical Input Industry Revenue (Million), by Synthetic Chemical Inputs 2025 & 2033
- Figure 108: South America Turf & Ornamental Chemical Input Industry Volume (Kiloton), by Synthetic Chemical Inputs 2025 & 2033
- Figure 109: South America Turf & Ornamental Chemical Input Industry Revenue Share (%), by Synthetic Chemical Inputs 2025 & 2033
- Figure 110: South America Turf & Ornamental Chemical Input Industry Volume Share (%), by Synthetic Chemical Inputs 2025 & 2033
- Figure 111: South America Turf & Ornamental Chemical Input Industry Revenue (Million), by Country 2025 & 2033
- Figure 112: South America Turf & Ornamental Chemical Input Industry Volume (Kiloton), by Country 2025 & 2033
- Figure 113: South America Turf & Ornamental Chemical Input Industry Revenue Share (%), by Country 2025 & 2033
- Figure 114: South America Turf & Ornamental Chemical Input Industry Volume Share (%), by Country 2025 & 2033
- Figure 115: Africa Turf & Ornamental Chemical Input Industry Revenue (Million), by Type of Turf Grass 2025 & 2033
- Figure 116: Africa Turf & Ornamental Chemical Input Industry Volume (Kiloton), by Type of Turf Grass 2025 & 2033
- Figure 117: Africa Turf & Ornamental Chemical Input Industry Revenue Share (%), by Type of Turf Grass 2025 & 2033
- Figure 118: Africa Turf & Ornamental Chemical Input Industry Volume Share (%), by Type of Turf Grass 2025 & 2033
- Figure 119: Africa Turf & Ornamental Chemical Input Industry Revenue (Million), by Type of Ornamental Grass 2025 & 2033
- Figure 120: Africa Turf & Ornamental Chemical Input Industry Volume (Kiloton), by Type of Ornamental Grass 2025 & 2033
- Figure 121: Africa Turf & Ornamental Chemical Input Industry Revenue Share (%), by Type of Ornamental Grass 2025 & 2033
- Figure 122: Africa Turf & Ornamental Chemical Input Industry Volume Share (%), by Type of Ornamental Grass 2025 & 2033
- Figure 123: Africa Turf & Ornamental Chemical Input Industry Revenue (Million), by Synthetic Chemical Inputs 2025 & 2033
- Figure 124: Africa Turf & Ornamental Chemical Input Industry Volume (Kiloton), by Synthetic Chemical Inputs 2025 & 2033
- Figure 125: Africa Turf & Ornamental Chemical Input Industry Revenue Share (%), by Synthetic Chemical Inputs 2025 & 2033
- Figure 126: Africa Turf & Ornamental Chemical Input Industry Volume Share (%), by Synthetic Chemical Inputs 2025 & 2033
- Figure 127: Africa Turf & Ornamental Chemical Input Industry Revenue (Million), by Type of Turf Grass 2025 & 2033
- Figure 128: Africa Turf & Ornamental Chemical Input Industry Volume (Kiloton), by Type of Turf Grass 2025 & 2033
- Figure 129: Africa Turf & Ornamental Chemical Input Industry Revenue Share (%), by Type of Turf Grass 2025 & 2033
- Figure 130: Africa Turf & Ornamental Chemical Input Industry Volume Share (%), by Type of Turf Grass 2025 & 2033
- Figure 131: Africa Turf & Ornamental Chemical Input Industry Revenue (Million), by Type of Ornamental Grass 2025 & 2033
- Figure 132: Africa Turf & Ornamental Chemical Input Industry Volume (Kiloton), by Type of Ornamental Grass 2025 & 2033
- Figure 133: Africa Turf & Ornamental Chemical Input Industry Revenue Share (%), by Type of Ornamental Grass 2025 & 2033
- Figure 134: Africa Turf & Ornamental Chemical Input Industry Volume Share (%), by Type of Ornamental Grass 2025 & 2033
- Figure 135: Africa Turf & Ornamental Chemical Input Industry Revenue (Million), by Synthetic Chemical Inputs 2025 & 2033
- Figure 136: Africa Turf & Ornamental Chemical Input Industry Volume (Kiloton), by Synthetic Chemical Inputs 2025 & 2033
- Figure 137: Africa Turf & Ornamental Chemical Input Industry Revenue Share (%), by Synthetic Chemical Inputs 2025 & 2033
- Figure 138: Africa Turf & Ornamental Chemical Input Industry Volume Share (%), by Synthetic Chemical Inputs 2025 & 2033
- Figure 139: Africa Turf & Ornamental Chemical Input Industry Revenue (Million), by Country 2025 & 2033
- Figure 140: Africa Turf & Ornamental Chemical Input Industry Volume (Kiloton), by Country 2025 & 2033
- Figure 141: Africa Turf & Ornamental Chemical Input Industry Revenue Share (%), by Country 2025 & 2033
- Figure 142: Africa Turf & Ornamental Chemical Input Industry Volume Share (%), by Country 2025 & 2033
List of Tables
- Table 1: Global Turf & Ornamental Chemical Input Industry Revenue Million Forecast, by Type of Turf Grass 2020 & 2033
- Table 2: Global Turf & Ornamental Chemical Input Industry Volume Kiloton Forecast, by Type of Turf Grass 2020 & 2033
- Table 3: Global Turf & Ornamental Chemical Input Industry Revenue Million Forecast, by Type of Ornamental Grass 2020 & 2033
- Table 4: Global Turf & Ornamental Chemical Input Industry Volume Kiloton Forecast, by Type of Ornamental Grass 2020 & 2033
- Table 5: Global Turf & Ornamental Chemical Input Industry Revenue Million Forecast, by Synthetic Chemical Inputs 2020 & 2033
- Table 6: Global Turf & Ornamental Chemical Input Industry Volume Kiloton Forecast, by Synthetic Chemical Inputs 2020 & 2033
- Table 7: Global Turf & Ornamental Chemical Input Industry Revenue Million Forecast, by Type of Turf Grass 2020 & 2033
- Table 8: Global Turf & Ornamental Chemical Input Industry Volume Kiloton Forecast, by Type of Turf Grass 2020 & 2033
- Table 9: Global Turf & Ornamental Chemical Input Industry Revenue Million Forecast, by Type of Ornamental Grass 2020 & 2033
- Table 10: Global Turf & Ornamental Chemical Input Industry Volume Kiloton Forecast, by Type of Ornamental Grass 2020 & 2033
- Table 11: Global Turf & Ornamental Chemical Input Industry Revenue Million Forecast, by Synthetic Chemical Inputs 2020 & 2033
- Table 12: Global Turf & Ornamental Chemical Input Industry Volume Kiloton Forecast, by Synthetic Chemical Inputs 2020 & 2033
- Table 13: Global Turf & Ornamental Chemical Input Industry Revenue Million Forecast, by Region 2020 & 2033
- Table 14: Global Turf & Ornamental Chemical Input Industry Volume Kiloton Forecast, by Region 2020 & 2033
- Table 15: Global Turf & Ornamental Chemical Input Industry Revenue Million Forecast, by Type of Turf Grass 2020 & 2033
- Table 16: Global Turf & Ornamental Chemical Input Industry Volume Kiloton Forecast, by Type of Turf Grass 2020 & 2033
- Table 17: Global Turf & Ornamental Chemical Input Industry Revenue Million Forecast, by Type of Ornamental Grass 2020 & 2033
- Table 18: Global Turf & Ornamental Chemical Input Industry Volume Kiloton Forecast, by Type of Ornamental Grass 2020 & 2033
- Table 19: Global Turf & Ornamental Chemical Input Industry Revenue Million Forecast, by Synthetic Chemical Inputs 2020 & 2033
- Table 20: Global Turf & Ornamental Chemical Input Industry Volume Kiloton Forecast, by Synthetic Chemical Inputs 2020 & 2033
- Table 21: Global Turf & Ornamental Chemical Input Industry Revenue Million Forecast, by Type of Turf Grass 2020 & 2033
- Table 22: Global Turf & Ornamental Chemical Input Industry Volume Kiloton Forecast, by Type of Turf Grass 2020 & 2033
- Table 23: Global Turf & Ornamental Chemical Input Industry Revenue Million Forecast, by Type of Ornamental Grass 2020 & 2033
- Table 24: Global Turf & Ornamental Chemical Input Industry Volume Kiloton Forecast, by Type of Ornamental Grass 2020 & 2033
- Table 25: Global Turf & Ornamental Chemical Input Industry Revenue Million Forecast, by Synthetic Chemical Inputs 2020 & 2033
- Table 26: Global Turf & Ornamental Chemical Input Industry Volume Kiloton Forecast, by Synthetic Chemical Inputs 2020 & 2033
- Table 27: Global Turf & Ornamental Chemical Input Industry Revenue Million Forecast, by Country 2020 & 2033
- Table 28: Global Turf & Ornamental Chemical Input Industry Volume Kiloton Forecast, by Country 2020 & 2033
- Table 29: United States Turf & Ornamental Chemical Input Industry Revenue (Million) Forecast, by Application 2020 & 2033
- Table 30: United States Turf & Ornamental Chemical Input Industry Volume (Kiloton) Forecast, by Application 2020 & 2033
- Table 31: Canada Turf & Ornamental Chemical Input Industry Revenue (Million) Forecast, by Application 2020 & 2033
- Table 32: Canada Turf & Ornamental Chemical Input Industry Volume (Kiloton) Forecast, by Application 2020 & 2033
- Table 33: Mexico Turf & Ornamental Chemical Input Industry Revenue (Million) Forecast, by Application 2020 & 2033
- Table 34: Mexico Turf & Ornamental Chemical Input Industry Volume (Kiloton) Forecast, by Application 2020 & 2033
- Table 35: Rest of North America Turf & Ornamental Chemical Input Industry Revenue (Million) Forecast, by Application 2020 & 2033
- Table 36: Rest of North America Turf & Ornamental Chemical Input Industry Volume (Kiloton) Forecast, by Application 2020 & 2033
- Table 37: Global Turf & Ornamental Chemical Input Industry Revenue Million Forecast, by Type of Turf Grass 2020 & 2033
- Table 38: Global Turf & Ornamental Chemical Input Industry Volume Kiloton Forecast, by Type of Turf Grass 2020 & 2033
- Table 39: Global Turf & Ornamental Chemical Input Industry Revenue Million Forecast, by Type of Ornamental Grass 2020 & 2033
- Table 40: Global Turf & Ornamental Chemical Input Industry Volume Kiloton Forecast, by Type of Ornamental Grass 2020 & 2033
- Table 41: Global Turf & Ornamental Chemical Input Industry Revenue Million Forecast, by Synthetic Chemical Inputs 2020 & 2033
- Table 42: Global Turf & Ornamental Chemical Input Industry Volume Kiloton Forecast, by Synthetic Chemical Inputs 2020 & 2033
- Table 43: Global Turf & Ornamental Chemical Input Industry Revenue Million Forecast, by Type of Turf Grass 2020 & 2033
- Table 44: Global Turf & Ornamental Chemical Input Industry Volume Kiloton Forecast, by Type of Turf Grass 2020 & 2033
- Table 45: Global Turf & Ornamental Chemical Input Industry Revenue Million Forecast, by Type of Ornamental Grass 2020 & 2033
- Table 46: Global Turf & Ornamental Chemical Input Industry Volume Kiloton Forecast, by Type of Ornamental Grass 2020 & 2033
- Table 47: Global Turf & Ornamental Chemical Input Industry Revenue Million Forecast, by Synthetic Chemical Inputs 2020 & 2033
- Table 48: Global Turf & Ornamental Chemical Input Industry Volume Kiloton Forecast, by Synthetic Chemical Inputs 2020 & 2033
- Table 49: Global Turf & Ornamental Chemical Input Industry Revenue Million Forecast, by Country 2020 & 2033
- Table 50: Global Turf & Ornamental Chemical Input Industry Volume Kiloton Forecast, by Country 2020 & 2033
- Table 51: Spain Turf & Ornamental Chemical Input Industry Revenue (Million) Forecast, by Application 2020 & 2033
- Table 52: Spain Turf & Ornamental Chemical Input Industry Volume (Kiloton) Forecast, by Application 2020 & 2033
- Table 53: United Kingdom Turf & Ornamental Chemical Input Industry Revenue (Million) Forecast, by Application 2020 & 2033
- Table 54: United Kingdom Turf & Ornamental Chemical Input Industry Volume (Kiloton) Forecast, by Application 2020 & 2033
- Table 55: France Turf & Ornamental Chemical Input Industry Revenue (Million) Forecast, by Application 2020 & 2033
- Table 56: France Turf & Ornamental Chemical Input Industry Volume (Kiloton) Forecast, by Application 2020 & 2033
- Table 57: Germany Turf & Ornamental Chemical Input Industry Revenue (Million) Forecast, by Application 2020 & 2033
- Table 58: Germany Turf & Ornamental Chemical Input Industry Volume (Kiloton) Forecast, by Application 2020 & 2033
- Table 59: Denmark Turf & Ornamental Chemical Input Industry Revenue (Million) Forecast, by Application 2020 & 2033
- Table 60: Denmark Turf & Ornamental Chemical Input Industry Volume (Kiloton) Forecast, by Application 2020 & 2033
- Table 61: Italy Turf & Ornamental Chemical Input Industry Revenue (Million) Forecast, by Application 2020 & 2033
- Table 62: Italy Turf & Ornamental Chemical Input Industry Volume (Kiloton) Forecast, by Application 2020 & 2033
- Table 63: Rest of Europe Turf & Ornamental Chemical Input Industry Revenue (Million) Forecast, by Application 2020 & 2033
- Table 64: Rest of Europe Turf & Ornamental Chemical Input Industry Volume (Kiloton) Forecast, by Application 2020 & 2033
- Table 65: Global Turf & Ornamental Chemical Input Industry Revenue Million Forecast, by Type of Turf Grass 2020 & 2033
- Table 66: Global Turf & Ornamental Chemical Input Industry Volume Kiloton Forecast, by Type of Turf Grass 2020 & 2033
- Table 67: Global Turf & Ornamental Chemical Input Industry Revenue Million Forecast, by Type of Ornamental Grass 2020 & 2033
- Table 68: Global Turf & Ornamental Chemical Input Industry Volume Kiloton Forecast, by Type of Ornamental Grass 2020 & 2033
- Table 69: Global Turf & Ornamental Chemical Input Industry Revenue Million Forecast, by Synthetic Chemical Inputs 2020 & 2033
- Table 70: Global Turf & Ornamental Chemical Input Industry Volume Kiloton Forecast, by Synthetic Chemical Inputs 2020 & 2033
- Table 71: Global Turf & Ornamental Chemical Input Industry Revenue Million Forecast, by Type of Turf Grass 2020 & 2033
- Table 72: Global Turf & Ornamental Chemical Input Industry Volume Kiloton Forecast, by Type of Turf Grass 2020 & 2033
- Table 73: Global Turf & Ornamental Chemical Input Industry Revenue Million Forecast, by Type of Ornamental Grass 2020 & 2033
- Table 74: Global Turf & Ornamental Chemical Input Industry Volume Kiloton Forecast, by Type of Ornamental Grass 2020 & 2033
- Table 75: Global Turf & Ornamental Chemical Input Industry Revenue Million Forecast, by Synthetic Chemical Inputs 2020 & 2033
- Table 76: Global Turf & Ornamental Chemical Input Industry Volume Kiloton Forecast, by Synthetic Chemical Inputs 2020 & 2033
- Table 77: Global Turf & Ornamental Chemical Input Industry Revenue Million Forecast, by Country 2020 & 2033
- Table 78: Global Turf & Ornamental Chemical Input Industry Volume Kiloton Forecast, by Country 2020 & 2033
- Table 79: China Turf & Ornamental Chemical Input Industry Revenue (Million) Forecast, by Application 2020 & 2033
- Table 80: China Turf & Ornamental Chemical Input Industry Volume (Kiloton) Forecast, by Application 2020 & 2033
- Table 81: India Turf & Ornamental Chemical Input Industry Revenue (Million) Forecast, by Application 2020 & 2033
- Table 82: India Turf & Ornamental Chemical Input Industry Volume (Kiloton) Forecast, by Application 2020 & 2033
- Table 83: Japan Turf & Ornamental Chemical Input Industry Revenue (Million) Forecast, by Application 2020 & 2033
- Table 84: Japan Turf & Ornamental Chemical Input Industry Volume (Kiloton) Forecast, by Application 2020 & 2033
- Table 85: Thailand Turf & Ornamental Chemical Input Industry Revenue (Million) Forecast, by Application 2020 & 2033
- Table 86: Thailand Turf & Ornamental Chemical Input Industry Volume (Kiloton) Forecast, by Application 2020 & 2033
- Table 87: Australia Turf & Ornamental Chemical Input Industry Revenue (Million) Forecast, by Application 2020 & 2033
- Table 88: Australia Turf & Ornamental Chemical Input Industry Volume (Kiloton) Forecast, by Application 2020 & 2033
- Table 89: Rest of Asia Pacific Turf & Ornamental Chemical Input Industry Revenue (Million) Forecast, by Application 2020 & 2033
- Table 90: Rest of Asia Pacific Turf & Ornamental Chemical Input Industry Volume (Kiloton) Forecast, by Application 2020 & 2033
- Table 91: Global Turf & Ornamental Chemical Input Industry Revenue Million Forecast, by Type of Turf Grass 2020 & 2033
- Table 92: Global Turf & Ornamental Chemical Input Industry Volume Kiloton Forecast, by Type of Turf Grass 2020 & 2033
- Table 93: Global Turf & Ornamental Chemical Input Industry Revenue Million Forecast, by Type of Ornamental Grass 2020 & 2033
- Table 94: Global Turf & Ornamental Chemical Input Industry Volume Kiloton Forecast, by Type of Ornamental Grass 2020 & 2033
- Table 95: Global Turf & Ornamental Chemical Input Industry Revenue Million Forecast, by Synthetic Chemical Inputs 2020 & 2033
- Table 96: Global Turf & Ornamental Chemical Input Industry Volume Kiloton Forecast, by Synthetic Chemical Inputs 2020 & 2033
- Table 97: Global Turf & Ornamental Chemical Input Industry Revenue Million Forecast, by Type of Turf Grass 2020 & 2033
- Table 98: Global Turf & Ornamental Chemical Input Industry Volume Kiloton Forecast, by Type of Turf Grass 2020 & 2033
- Table 99: Global Turf & Ornamental Chemical Input Industry Revenue Million Forecast, by Type of Ornamental Grass 2020 & 2033
- Table 100: Global Turf & Ornamental Chemical Input Industry Volume Kiloton Forecast, by Type of Ornamental Grass 2020 & 2033
- Table 101: Global Turf & Ornamental Chemical Input Industry Revenue Million Forecast, by Synthetic Chemical Inputs 2020 & 2033
- Table 102: Global Turf & Ornamental Chemical Input Industry Volume Kiloton Forecast, by Synthetic Chemical Inputs 2020 & 2033
- Table 103: Global Turf & Ornamental Chemical Input Industry Revenue Million Forecast, by Country 2020 & 2033
- Table 104: Global Turf & Ornamental Chemical Input Industry Volume Kiloton Forecast, by Country 2020 & 2033
- Table 105: Brazil Turf & Ornamental Chemical Input Industry Revenue (Million) Forecast, by Application 2020 & 2033
- Table 106: Brazil Turf & Ornamental Chemical Input Industry Volume (Kiloton) Forecast, by Application 2020 & 2033
- Table 107: Argentina Turf & Ornamental Chemical Input Industry Revenue (Million) Forecast, by Application 2020 & 2033
- Table 108: Argentina Turf & Ornamental Chemical Input Industry Volume (Kiloton) Forecast, by Application 2020 & 2033
- Table 109: Rest of South America Turf & Ornamental Chemical Input Industry Revenue (Million) Forecast, by Application 2020 & 2033
- Table 110: Rest of South America Turf & Ornamental Chemical Input Industry Volume (Kiloton) Forecast, by Application 2020 & 2033
- Table 111: Global Turf & Ornamental Chemical Input Industry Revenue Million Forecast, by Type of Turf Grass 2020 & 2033
- Table 112: Global Turf & Ornamental Chemical Input Industry Volume Kiloton Forecast, by Type of Turf Grass 2020 & 2033
- Table 113: Global Turf & Ornamental Chemical Input Industry Revenue Million Forecast, by Type of Ornamental Grass 2020 & 2033
- Table 114: Global Turf & Ornamental Chemical Input Industry Volume Kiloton Forecast, by Type of Ornamental Grass 2020 & 2033
- Table 115: Global Turf & Ornamental Chemical Input Industry Revenue Million Forecast, by Synthetic Chemical Inputs 2020 & 2033
- Table 116: Global Turf & Ornamental Chemical Input Industry Volume Kiloton Forecast, by Synthetic Chemical Inputs 2020 & 2033
- Table 117: Global Turf & Ornamental Chemical Input Industry Revenue Million Forecast, by Type of Turf Grass 2020 & 2033
- Table 118: Global Turf & Ornamental Chemical Input Industry Volume Kiloton Forecast, by Type of Turf Grass 2020 & 2033
- Table 119: Global Turf & Ornamental Chemical Input Industry Revenue Million Forecast, by Type of Ornamental Grass 2020 & 2033
- Table 120: Global Turf & Ornamental Chemical Input Industry Volume Kiloton Forecast, by Type of Ornamental Grass 2020 & 2033
- Table 121: Global Turf & Ornamental Chemical Input Industry Revenue Million Forecast, by Synthetic Chemical Inputs 2020 & 2033
- Table 122: Global Turf & Ornamental Chemical Input Industry Volume Kiloton Forecast, by Synthetic Chemical Inputs 2020 & 2033
- Table 123: Global Turf & Ornamental Chemical Input Industry Revenue Million Forecast, by Country 2020 & 2033
- Table 124: Global Turf & Ornamental Chemical Input Industry Volume Kiloton Forecast, by Country 2020 & 2033
- Table 125: South Africa Turf & Ornamental Chemical Input Industry Revenue (Million) Forecast, by Application 2020 & 2033
- Table 126: South Africa Turf & Ornamental Chemical Input Industry Volume (Kiloton) Forecast, by Application 2020 & 2033
- Table 127: Rest of Africa Turf & Ornamental Chemical Input Industry Revenue (Million) Forecast, by Application 2020 & 2033
- Table 128: Rest of Africa Turf & Ornamental Chemical Input Industry Volume (Kiloton) Forecast, by Application 2020 & 2033
Frequently Asked Questions
1. What is the projected Compound Annual Growth Rate (CAGR) of the Turf & Ornamental Chemical Input Industry?
The projected CAGR is approximately 4.34%.
2. Which companies are prominent players in the Turf & Ornamental Chemical Input Industry?
Key companies in the market include FMC Corporation, Bayer Crop Sciences, American Vanguard Corporation, Chemisco Division of United Industries Corp, Syngenta A, Precision Laboratories, DowDuPont, Monsanto Company, Gowan International, Chemtura Agro Solutions, Adama Agricultural Solutions, Koch Agronomic Services LLC, Nufarm Ltd, BASF SE.
3. What are the main segments of the Turf & Ornamental Chemical Input Industry?
The market segments include Type of Turf Grass, Type of Ornamental Grass, Synthetic Chemical Inputs, Type of Turf Grass, Type of Ornamental Grass, Synthetic Chemical Inputs.
4. Can you provide details about the market size?
The market size is estimated to be USD 7.02 Million as of 2022.
5. What are some drivers contributing to market growth?
Seed Treatment As A Solution To Enhance Yield; Growing Awareness For Seed Treatment Among The Farmers; Rising Trend Of Organic Farming.
6. What are the notable trends driving market growth?
Increasing Development of the Golf Courses and Sports Field.
7. Are there any restraints impacting market growth?
Limitations Across Farm-Level Seed Treatment; Rising Environmental Concerns.
8. Can you provide examples of recent developments in the market?
March 2022: BASF introduced Pillar SC Intrinsic brand fungicide.This fungicide provided broad-spectrum control of 26 cool- and warm-season turf diseases, like brown patch, dollar spot, leaf spots and large patch with one use rate. Pillar SC Intrinsic brand fungicide is the first fungicide developed for lawn care from BASF.
9. What pricing options are available for accessing the report?
Pricing options include single-user, multi-user, and enterprise licenses priced at USD 4750, USD 5250, and USD 8750 respectively.
10. Is the market size provided in terms of value or volume?
The market size is provided in terms of value, measured in Million and volume, measured in Kiloton.
11. Are there any specific market keywords associated with the report?
Yes, the market keyword associated with the report is "Turf & Ornamental Chemical Input Industry," which aids in identifying and referencing the specific market segment covered.
12. How do I determine which pricing option suits my needs best?
The pricing options vary based on user requirements and access needs. Individual users may opt for single-user licenses, while businesses requiring broader access may choose multi-user or enterprise licenses for cost-effective access to the report.
13. Are there any additional resources or data provided in the Turf & Ornamental Chemical Input Industry report?
While the report offers comprehensive insights, it's advisable to review the specific contents or supplementary materials provided to ascertain if additional resources or data are available.
14. How can I stay updated on further developments or reports in the Turf & Ornamental Chemical Input Industry?
To stay informed about further developments, trends, and reports in the Turf & Ornamental Chemical Input Industry, consider subscribing to industry newsletters, following relevant companies and organizations, or regularly checking reputable industry news sources and publications.
Methodology
Step 1 - Identification of Relevant Samples Size from Population Database


Step 2 - Approaches for Defining Global Market Size (Value, Volume* & Price*)

Note*: In applicable scenarios
Step 3 - Data Sources
Primary Research
- Web Analytics
- Survey Reports
- Research Institute
- Latest Research Reports
- Opinion Leaders
Secondary Research
- Annual Reports
- White Paper
- Latest Press Release
- Industry Association
- Paid Database
- Investor Presentations

Step 4 - Data Triangulation
Involves using different sources of information in order to increase the validity of a study
These sources are likely to be stakeholders in a program - participants, other researchers, program staff, other community members, and so on.
Then we put all data in single framework & apply various statistical tools to find out the dynamic on the market.
During the analysis stage, feedback from the stakeholder groups would be compared to determine areas of agreement as well as areas of divergence